
The Percent Positive Trend for the S&P 500 (^PTSPX) and Percent Positive Trend for the NYSE (^PTNYSE) each reversed back up into a column of Xs.
As the S&P 500 SPX continues to push close to new highs, we are seeing a number of the underlying constituents of the index return to positive trends. The Percent Positive Trend for the S&P 500 ^PTSPX has reversed back into a column of X’s at 78% this week. After falling to a low of 8% on the chart back in March, PTSPX reversed up in April and was off to the races, rising all the way to 82% by mid-June. The current reading of 78% simply means that 78% of all S&P 500 stocks are in positive trends today, which is generally a positive sign for the market. This also comes as the Percent Positive Trend for the NYSE ^PTNYSE has reversed back to X’s at 56%, indicating a majority of NYSE stocks are in positive trends.
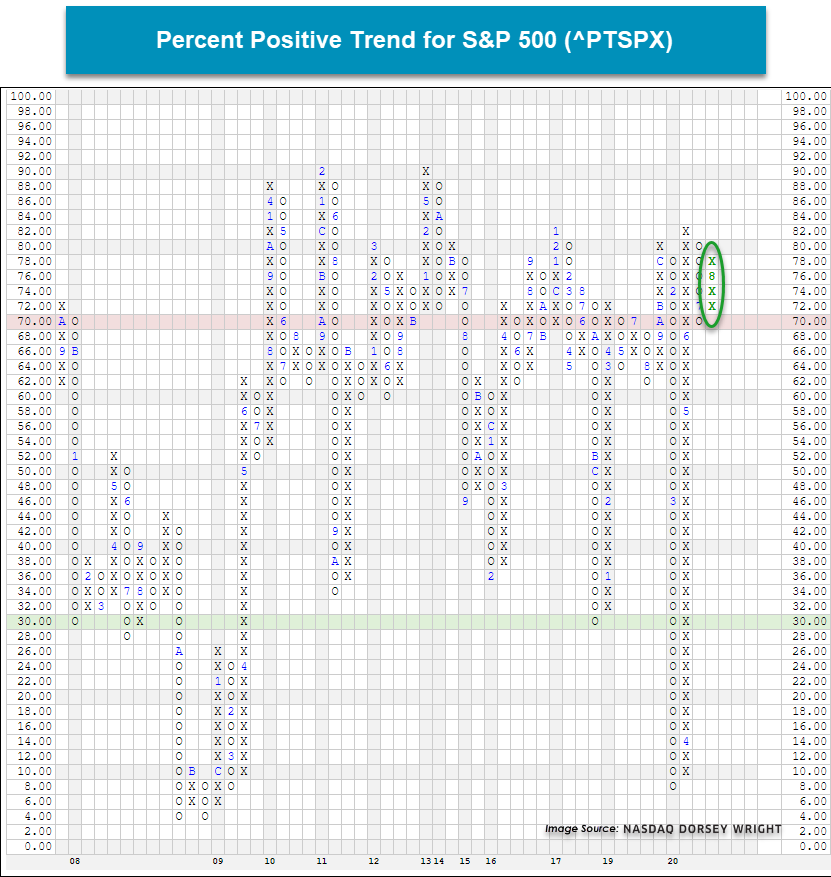
Going back to mid-2000, there have been 20 reversals back to X’s above 50% for the PTSPX chart and more often then not it has been a positive sign for the market. Of the previous 20 times the PTSPX reversed up while above 50%, the average 1-week, 2-week, 1-month, and 6-month returns have been positive. The average 6-month return was 3.17% for the S&P 500 with 13 out of the 20 occurrences showing positive returns. While there have not been all that many occasions to examine, as the PT charts are typically viewed as a long-term indicator, the reversal back to X’s for trend indicators like ^PTSPX or ^PTNYSE are signs that more stocks are returning to positive trends, which has historically been a good sign for the market.

