Precious Pullbacks and Soft Surges
Remember, these are technical comments only. Just as you must be aware of fundamental data for the stocks we recommend based on technical criteria in the report, so too must you be aware of important data regarding delivery, market moving government releases, and other factors that may influence commodity pricing. We try to limit our technical comments to the most actively traded contracts in advance of delivery, but some contracts trade actively right up to delivery while others taper off well in advance. Be sure you check your dates before trading these contracts. For questions regarding this section or additional coverage of commodities email james.west@dorseywright.com.
Data represented in the table below is through 8/11/2020:
Broad Market Commodities Report
Portfolio View - Commodity Indices
| Symbol | Name | Price | PnF Trend | RS Signal | RS Col. | 200 Day MA | Weekly Mom |
|---|---|---|---|---|---|---|---|
| CL/ | Crude Oil Continuous | 41.54 | Positive | Buy | X | 42.69 | -6W |
| DBLCIX | Deutsche Bank Liquid Commodities Index | 273.59 | Negative | Sell | O | 279.49 | +18W |
| DWACOMMOD | DWA Continuous Commodity Index | 495.76 | Positive | Buy | O | 461.31 | -183W |
| GC/ | Gold Continuous | 1917.50 | Positive | Buy | X | 1651.53 | +6W |
| HG/ | Copper Continuous | 2.84 | Positive | Buy | X | 2.60 | -2W |
| ZG/ | Corn (Electronic Day Session) Continuous | 311.75 | Negative | Buy | O | 351.68 | -4W |
The recent week of market action ushered in more headlines surrounding the commodities space, specifically the sharp pullback in precious metals and rebound in softs. Recent darlings like Gold GC/ and Silver SI/ experienced rather dramatic moves lower over the past week, posting losses of -5.76% and -6.54%, respectively (returns from 8/4/20 - 8/11/20). Consequently, GC/ returned to a sell signal on its default Point and Figure chart after a series of four consecutive buy signals and SI/ reversed down into a column of Os, yet remained above near-term support offered at $23.50 to maintain its two consecutive buy signals. Tracking ETFs like the SPDR Gold Trust GLD and iShares Silver Trust SLV also downshifted yet remain on Point and Figure buy signals on their default chart. However, perhaps noteworthy is the divergence in score direction between GLD and SLV, as the latter maintains a strongly positive score direction while GLD shows negative recent movement. Both funds remain above the optimal 4.00 score threshold and in overall positive trends, but ensure alerts are set if any further deterioration manifests.
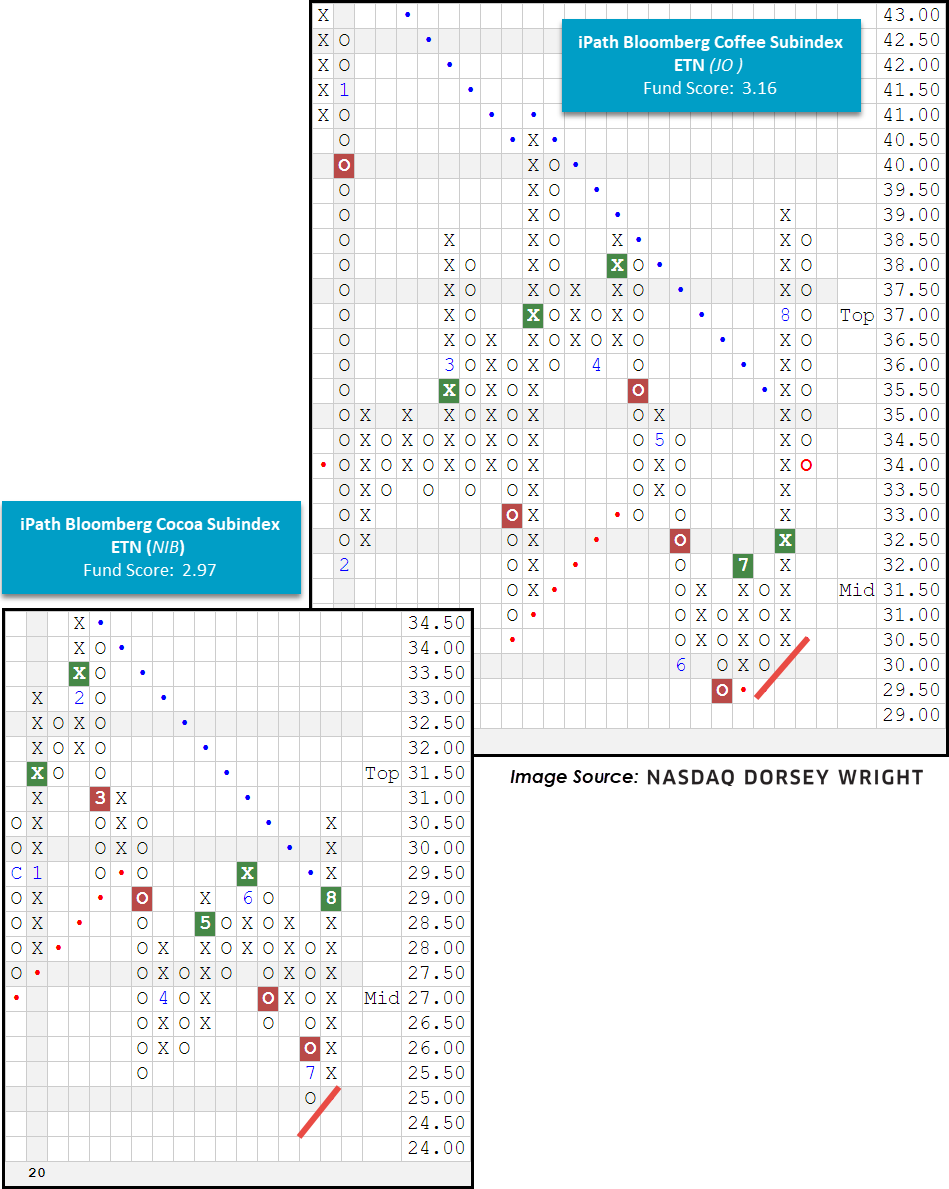
On the contrary, we note near-term improvement from soft commodities like Cocoa CC/ and Coffee KC/. In fact, according to data from the Commodity Futures Trading Commission, “short positions in sugar were down by nearly 10,000 contracts, cocoa shorts were cut by more than 7,000 contracts and coffee shorts fell by more than 19,000 contracts” (Source: wsj.com). From a technical perspective, we find CC/ and KC/ both reentering positive trends in the last three weeks, demonstrating absolute strength after posting bottoms in June and July. Furthermore, products like the iPath Bloomberg Cocoa Subindex Total Return ETN NIB and iPath Bloomberg Coffee Subindex Total Return ETN JO reentered positive trends in the past two weeks, and also sport strongly positive score directions north of 2.0. Note the current fund scores for NIB and JO are also hovering around the acceptable 3.0 score line, yet still below the optimal fund scores put out by the precious metals camp.
In aggregate, the near-term pullback in precious metals and rebound in soft commodities has narrowed the leadership gap within the alternative assets space; however, the weight of the evidence does not yet suggest a change in the leaders themselves.

