
Most Requested Symbols

Upcoming webinars and events and a change in the CURRSHARES model.
The European Union came to an agreement on a new spending package earlier this week, which sent shares of several individual country representatives higher.
Today's featured stock is Zoetis Inc (ZTS).
ABG, HQY, KL, MWK, NDSN, OLLI, SGRY, TENB, WSM & XEL.
Call: ProLogis (PLD) Put: Ralph Lauren (RL), Covered Write: JD.com (JD)
Market Update Webinar Replay: Missed Monday's webcast? Click the link(s) below for a recap.
Mid -Year Market Review: Join the Nasdaq Dorsey Wright team on Wednesday, July 29 at 1 pm EST as we discuss the volatile market movement through the first six months of the year and what to monitor in the second half of 2020. Click here to register.
Speakers include:

Virtual Investment Models Workshop: The Investment Models Workshop is designed specifically for financial professionals looking to incorporate Nasdaq Dorsey Wright's (NDW) turnkey model solutions into their investment practice, as well as those who would just like to learn more. This three-hour virtual course will not only give you the chance to engage with experts from NDW, but will also expose you to new strategies, investment frameworks, and best practices for utilizing the NDW Research Platform to help you manage your business with more confidence, efficiency, and greater scale. Investments & Wealth Institute® has accepted the Nasdaq Dorsey Wright Investment Models Workshop for 3 hours of CE credit towards the CIMA®, CPWA®, CIMC®, and RMA certifications. The workshop will take place on Thursday, August 6 from 12:30 pm - 3:30 pm EST. Click here for more information.
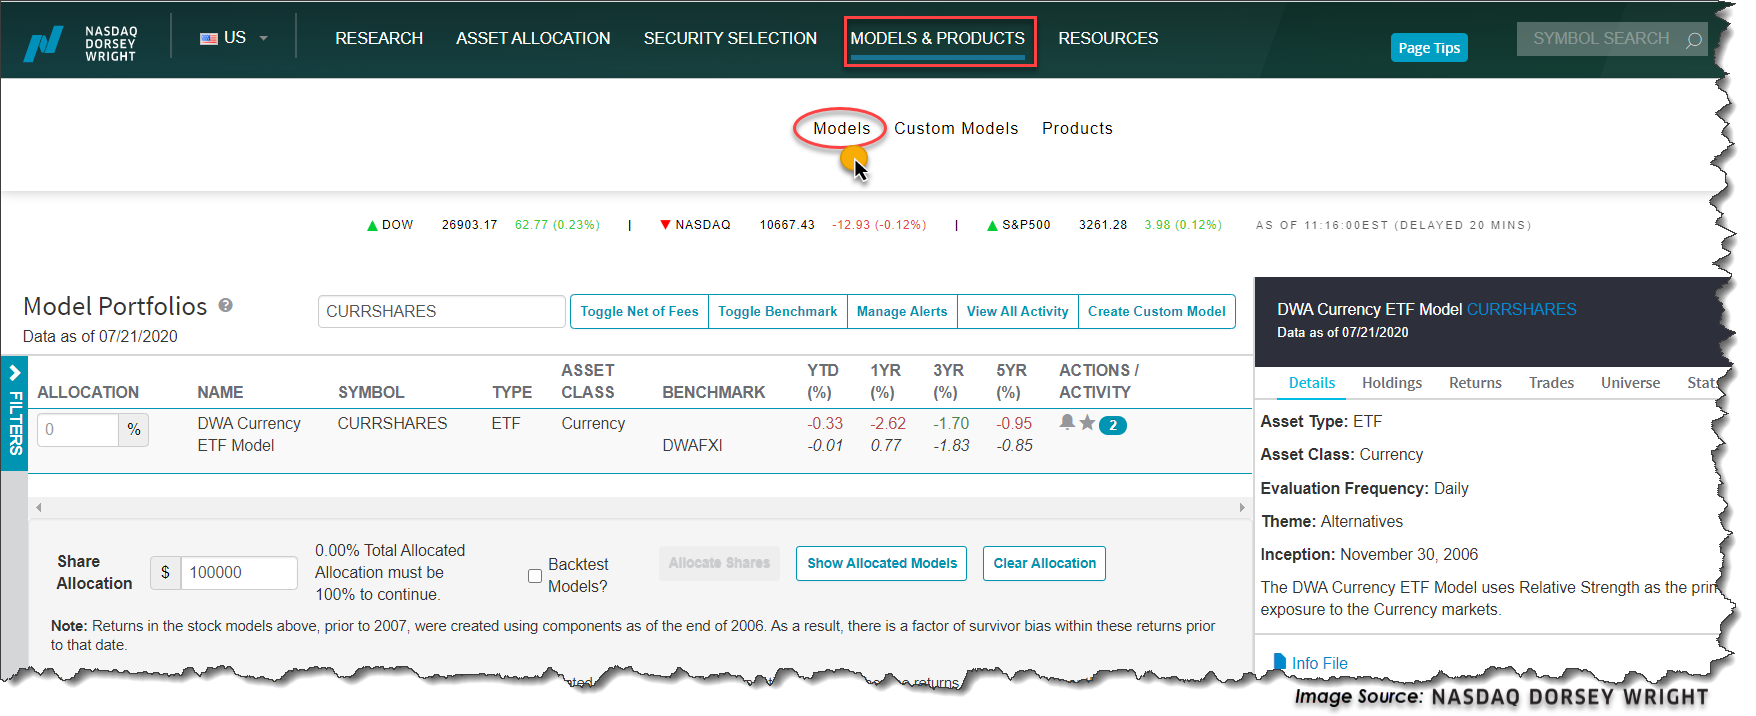
As a result of yesterday’s market action (7/21), the DWA Currency Model CURRSHARES experienced a change, selling its position in our Money Market Proxy using the 13 Week T-Bill MNYMKT as it sufficiently fell out of favor in the matrix. MNYMKT had been a holding in the model since January 2019, and during that time, it posted a gain of 2.34%. Replacing MNYMKT is the Invesco CurrencyShares Australian Dollar Trust FXA as it has moved up to the top of the matrix. The last time FXA was in the model was back in May 2017. In addition to holding FXA, the model also holds the Invesco CurrencyShares Euro Trust FXE and the Invesco CurrencyShares Swiss Franc FXF, at 33% each.
For those unfamiliar with this currency model, it is a provider-agnostic model with 11 currency-based ETFs including cash. It is designed to hold the three strongest positions at all times as demonstrated by relative strength. For more information, visit the Models page located under the Models & Products menu.

Each week the analysts at DWA review and comment on all major asset classes in the global markets. Shown below is the summary or snapshot of the primary technical indicators we follow for multiple areas. Should there be changes mid-week we will certainly bring these to your attention via the report.
| Universe | BP Col & Level (actual) | BP Rev Level | PT Col & Level (actual) | PT Rev Level | HiLo Col & Level (actual) | HiLo Rev Level | 10 Week Col & Level (actual) | 10 Week Rev Level | 30 Week Col & Level (actual) | 30 Week Rev Level |
|---|---|---|---|---|---|---|---|---|---|---|
| ALL |
|
56% |
|
40% |
|
84% |
|
60% |
|
42% |
| NYSE |
|
54% |
|
56% |
|
86% |
|
62% |
|
36% |
| OTC |
|
54% |
|
38% |
|
84% |
|
60% |
|
44% |
| World |
|
54% |
|
40% |
|
|
|
66% |
|
40% |
The most notable change in the DALI asset class rankings was the move up to number one by Fixed Income while Cash dipped back to number two. Cash lost enough signals over the course of the past week to slip to number two in the DALI rankings while Fixed Income ticked up to number one. There are just 17 signals separating the number two ranked asset class (Cash) and the number three ranked (Domestic Equity). It is also interesting to note that the Commodities asset class has picked up about 15 new buy signals over the course of the past couple days, suggesting that a large part of the signals Fixed Income and Cash lost were lost to Commodities. With that said, Commodities still sit in the number five position with just 140 signals today, but as Gold, Silver, and even Crude have seen notable rallies of late the Commodities asset class will be one to watch over the coming days and weeks.

The Domestic Equities asset class is certainly within striking distance of moving back into one of the top two spots, so this will be something to monitor especially for those following DALI based asset allocation strategies like a 3 Legged Stool or Tactical Tilt. Note a move back into one of the top two asset classes would be cause for portfolio adjustments to increase equities which fell out of the top two spots in mid March, and despite the rally the market has seen, Domestic Equities have not been able to move back up. One of the things that has been extremely difficult in this market has been the speed and velocity of which this market corrected and subsequently recovered, as well as the narrowness of the leadership. To put the speed of this pullback into perspective it took the market just 22 days to fall 20% from the February 19th peak. That was the fastest correction of 20% the we have ever seen (excluding the 1930’s). In 2008 it took nine months for the market to correct 20% off the October 2007 high (October 2007 to July 2008). In 2002, it took 6 months to hit 20% down (January 2002 to July 2002).
This correction also came off a rather strong move higher in equities off the December 2018 low. The S&P 500 was up 44% from 12/24/18 to 2/19/20, also during the run FV was up 45% and PDP was up 55%. That explosive move higher, while great for the 2019 calendar year, left a number of relative strength charts up on stems; therefore, in order to generate sell signals they needed to fall more than 20%. Unlike 2018, which was a benefit to the portfolios, this time around it was not. This brings us to the “why haven’t we gone back in?” Well for very similar, yet completely opposite reasons. As quick as the move down was off the Feb peak, the rally back as been equally as explosive to the upside leaving relative strength charts, in some cases, far away from buy signals upon the initial reversals up. The best case scenario would have been to get some back and forth action off the bottom to setup buy signals from much lower levels; however, that didn’t happen for many charts. This “V shaped” recovery the market has experienced is a very difficult environment for relative strength or trend following of any kind, and is not the common bottoming process for the market. In the 2002 and 2008/09 bottom you got quite a bit of back and forth, as those bottoms were more of a process then an event like this year.
Only time will tell how this ultimately unfolds. There certainly are a fair number of risks out there in the market. But as it stands Domestic Equities are separated by the number two ranked asset class by just 17 signals. Interestingly, Domestic Equities have added the second most buy signals (51) since the end of March. Only International Equities have added more (53), so we will continue to monitor the relative strength charts, watch for potential changes, and adjust portfolios accordingly when and if the time comes.


| Symbol | Name | Price | Yield | PnF Trend | RS Signal | RS Col. | Fund Score | 200 Day MA | Weekly Mom |
|---|---|---|---|---|---|---|---|---|---|
| DIA | SPDR Dow Jones Industrial Average ETF Trust | 268.34 | 2.23 | Positive | X | 3.52 | 262.45 | +1W | |
| EEM | iShares MSCI Emerging Markets ETF | 43.72 | 2.04 | Positive | Sell | O | 4.52 | 40.63 | +15W |
| EFA | iShares MSCI EAFE ETF | 63.95 | 2.55 | Positive | Sell | O | 1.65 | 62.93 | +1W |
| FM | iShares MSCI Frontier 100 ETF | 23.82 | 3.33 | Negative | Sell | O | 0.30 | 26.31 | -3W |
| IJH | iShares S&P MidCap 400 Index Fund | 184.37 | 1.75 | Positive | Buy | O | 2.84 | 183.04 | -4W |
| IJR | iShares S&P SmallCap 600 Index Fund | 70.69 | 1.67 | Positive | Buy | O | 2.48 | 72.35 | +1W |
| QQQ | Invesco QQQ Trust | 264.00 | 0.62 | Positive | Buy | X | 5.84 | 215.67 | +4W |
| RSP | Invesco S&P 500 Equal Weight ETF | 106.33 | 2.02 | Positive | Buy | X | 3.67 | 104.52 | -4W |
| SPY | SPDR S&P 500 ETF Trust | 325.01 | 1.76 | Positive | O | 4.23 | 303.18 | +1W | |
| XLG | Invesco S&P 500 Top 50 ETF | 251.91 | 1.45 | Positive | O | 5.58 | 225.57 | +2W |
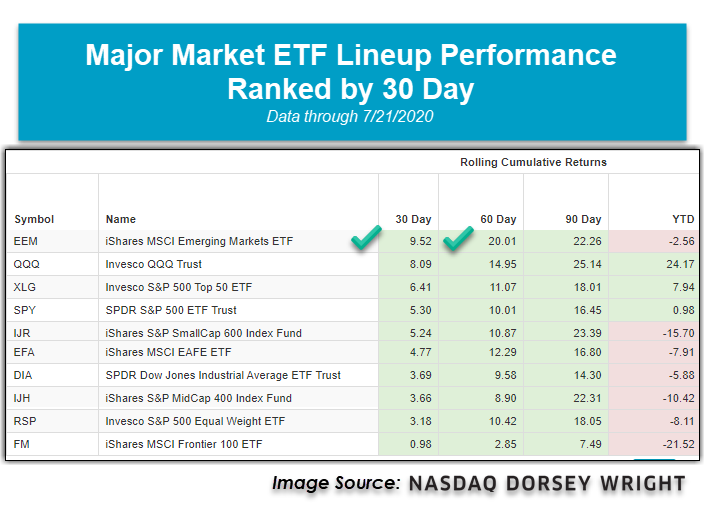
Over the last week of market action, nine of the ten major market ETFs covered in this report finished the week in positive territory while just one ETF finished in the red. When all was said and done, the best performing of the group was the iShares S&P SmallCap 600 Index Fund IJR, which posted a notable gain of 4.59% while the iShares MSCI Frontier 100 ETF FM was the worst-performing fund with a cumulative seven-day loss of -1.08%. There are now three major market funds sitting in positive territory on a year-to-date basis; the Invesco QQQ Trust QQQ continues to dominate the performance rankings with a gain of 24.17%. At the same time, the Invesco S&P 500 Top 50 ETF XLG is the second-best performing, up 7.94%, and the SPDR S&P 500 ETF Trust SPY is currently ranked third in terms of performance so far into 2020, up 0.98%. Today, we will highlight the recent strength from the iShares MSCI Emerging Markets ETF EEM as it is the best-performing major market fund over the last 30 and 60 days, up 9.52% and 20.01%, respectively.
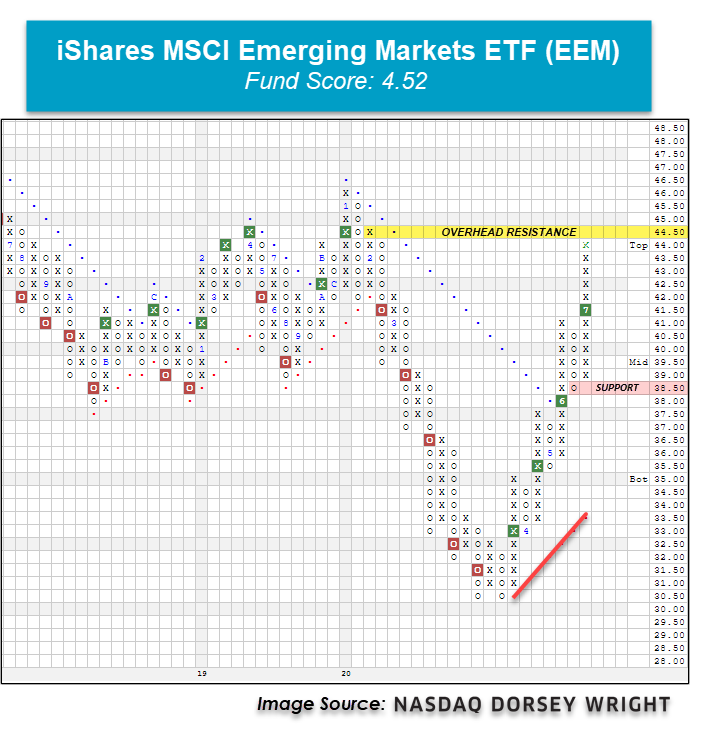
With yesterday’s intraday action, the iShares MSCI Emerging Markets ETF EEM printed an X at the $44 level, putting the fund just half a point off of its February high of $44.50 and two points off of its multi-year high watermark of $46 recorded in January. This rally comes as EEM continues to recover off of its $30.50 March low recorded as a result of the sell-off triggered by the COVID-19 global pandemic. Before reaching this multi-year low level, EEM moved to a sell signal in February with a triple bottom break at $41.50 and gave a total of five consecutive sell signals over the next month. On March 25, EEM returned to a buy signal at $33 and has since recorded a total of four successive buy signals, confirming that demand is in control. Additionally, EEM just experienced a flip to positive monthly momentum after having spent the four previous months negative, suggesting the potential for higher prices.
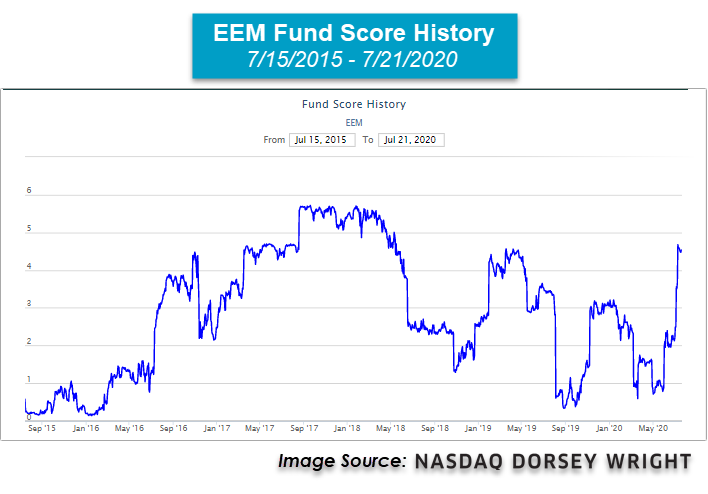
As we mentioned in last week’s International Equity Overview, while the improvement in technical strength is visible on EEM’s trend chart, it is also evident when we review EEM’s recent uptick in fund score. Recall that EEM saw its first significant score gain between Thursday, July 2, and Monday, July 6, where its 2.49 score improved by over one full point, jumping to 3.56. The score underwent another significant increase later that week, as the July 9 reading increased by a whole score point to 4.68. Currently, EEM remains close to that reading with a fund score of 4.52. This swift improvement recently observed in EEM’s score speaks to the flexible and dynamic nature of the NDW fund scoring system evaluated daily. As a refresher, the NDW fund scoring system uses a total of 19 data points to determine the technical health of a fund, combining both absolute and relative metrics. In addition to its current strong score of 4.52, EEM also possesses a strongly positive score direction of 3.93, which speaks to the score’s significant peak-to-trough improvement over the trailing six months.
Overall, the weight of the evidence is positive here for EEM; however, the fund is 87% overbought on its 10-week trading band, signaling an overbought trading posture. As a result, those looking to initiate new positions may want to scale in here or wait for a potential pullback/normalization of the fund’s OBOS% reading. From here, initial support is offered at $38.50, while resistance sits at $44.50, EEM’s February high. Note EEM offers a yield of 2.04%. Despite being the stronger area when we break down the international space, EEM remains negative on the year with a loss of -2.56%. In comparison, EEM’s developed counterpart, the iShares MSCI EAFE ETF EFA is down -7.91%, underperforming EEM by more than 5%.
SECTOR BULLISH PERCENT CHANGES
| Reversed to X | Reversed to O |
|---|---|
| 18 (BPAERO | 40), (BPAUTO | 66), (BPBUSI | 62), (BPCOMP | 52), (BPELEC | 68), (BPFOOD | 52), (BPGUTI | 44), (BPHEAL | 58), (BPINSU | 60), (BPLEIS | 58), (BPMACH | 70), (BPPROT | 60), (BPREST | 50), (BPSOFT | 60), (BPTELE | 54), (BPTRAN | 56), (BPWALL | 72), (BPWAST | 46), |
0 |
| To Xs | To Os |
|---|---|
| Internet ( 0.13 to 62 ) | None |
Average Level
56.23
| Sector |
|---|
| None |
| Sector |
|---|
| Aerospace Airline (40%) - Bull Confirmed |
| Utilities / Gas (44%) - Bull Confirmed |
| Restaurants (50%) - Bear Correction |
| Textiles / Apparel (50%) - Bull Confirmed |
| Waste Management (46%) - Bear Correction |
| Sector |
|---|
| Biomedics/Genetics (50%) - Bear Confirmed |
| Finance (50%) - Bull Correction |
| Internet (56%) - Bull Correction |
| Real Estate (52%) - Bear Alert |
| Retailing (52%) - Bull Correction |
SECTOR INDICATOR CHART CHANGES
PT is the percentage of stocks within a sector that are trading above their bullish support lines. RSX is the percentage of stocks within a sector whose relative strength charts are in a column of Xs. RSP is the percentage of stocks within a sector whose relative strength charts are on a buy signal. The strongest sectors, i.e. market leaders, will have most of these indicators positive and moving higher in a column of Xs.
|
There were mostly PT charts rising this week, with 6 rising and 1 moving lower. The following sector charts rose: Chemicals [^PTCHEM], Electronics [^PTELEC], Forest Prods/Paper [^PTFORE]-Rev. , Healthcare [^PTHEAL], Internet [^PTINET], Precious Metals [^PTPREC]. The following sector chart fell: Gaming [^PTGAME]. There were 1 that reversed to X. |
|
| ^PT Charts Reversing Up - | ^PT Charts Reversing Down - |
|
|
| ^PT Charts Moving Higher - | ^PT Charts Moving Lower - |
|
|
|
There were mostly falling sector RSX charts this week, with 17 falling and 2 rising. The following sector charts rose: Oil Service [^RSXOILS]-Rev. , Protection Safety Equipment [^RSXPROT]. The following sector charts fell: Aerospace Airline [^RSXAERO], Autos and Parts [^RSXAUTO], Banks [^RSXBANK], Biomedics/Genetics [^RSXBIOM], Business Products [^RSXBUSI], Computers [^RSXCOMP]-Rev. , Finance [^RSXFINA]-Rev. , Internet [^RSXINET]-Rev. , Leisure [^RSXLEIS], Oil [^RSXOIL], Real Estate [^RSXREAL], Retailing [^RSXRETA], Savings & Loans [^RSXSAVI], Steel/Iron [^RSXSTEE], Textiles/Apparel [^RSXTEXT], Transports/Non Air [^RSXTRAN], Waste Management [^RSXWAST]. There were no sector RSX charts that moved to a buy or sell signal this week. |
|
| ^RSX Charts Reversing Up - | ^RSX Charts Reversing Down - |
|
|
| ^RSX Charts Moving Higher - | ^RSX Charts Moving Lower - |
|
|
|
There were equal amounts of rising and falling sector RSP charts this week, with 4 both rising and falling. The following sector charts rose: Healthcare [^RSPHEAL], Precious Metals [^RSPPREC], Semiconductors [^RSPSEMI], Software [^RSPSOFT]. The following sector charts fell: Gaming [^RSPGAME], Oil [^RSPOIL], Oil Service [^RSPOILS]-Rev. , Restaurants [^RSPREST]. There were 1 that reversed to O. |
|
| ^RSP Charts Reversing Up - | ^RSP Charts Reversing Down - |
|
|
|
| ^RSP Charts Moving Higher - | ^RSP Charts Moving Lower - |
FAVORED SECTOR STATUS CHANGES
A sector is considered to be Favored if it has 3 or 4 of the sector indicators (Relative Strength, RSX, RSP, & PT) positive, Average if it has 2 of the 4 indicators positive, & Unfavored if it has 0 or 1 of the indicators positive. The table below contains those sectors that have experienced a Favored Sector Status change over the past week. It is best to focus on sectors that are about 50% or lower on their Bullish Percent charts & are in Xs. Note: If a sector moves from Favored to Average, it doesn't necessarily mean that the sector in question has to be sold - it just means you need to evaluate your individual positions with exposure to that sector.
| Changes since 07/15/2020 | Full Report |
|
|
|
|
||||
|
|
|
|
|
|
||
|
|
|
|
|
|
||
|
|
|
|
|
|
||

Global economic uncertainty stemming from the COVID-19 fallout has continued, as countries search for the best way to kick start their economies with an increasing number of employees readily available to return to work. This is not just a problem for the U.S., as many foreign governments work through stimulus options to increase their economic activity. Earlier this week, the European Union (EU) announced their latest spending plan, which included over $2 trillion in fresh stimulus for the member countries (source: wsj.com).
This came as positive news for many investors in the region, leading to rallies in European equities as shown through the iShares MSCI Eurozone ETF EZU, which moved higher to give its fifth consecutive buy signal at $39 after the announcement was made Tuesday. EZU had already seen a substantial rally off its March low of $25.50, allowing for a technically sound recent fund score posting of 3.55 following the recent news. Some areas within the EU have held up much better than others, however, with a specific focus on the Netherlands, Germany, and Sweden, each of which has representatives ranking in the top half of our World ETF Premade Matrix that also has favorable recent fund scores.
The iShares MSCI Netherlands ETF EWN has shown continued strength since reversing up from a multi-year low of $22 in March, giving four consecutive buy signals while also moving back to a positive trend in May. The stimulus news earlier this week led to a further increase in demand for the fund, as EWN moved to a new all-time high in trading Tuesday at $35. This continued improvement for the Netherlands representative has led the fund to rank 3rd out of the 48 country or region-specific funds found in the World ETF Matrix, demonstrating its strength among global equities. The recent 5.28 fund score posting for EWN bests the average European fund of 2.70 as well as the average non-US equity fund of 3.08 and is paired with a strongly positive 4.64 score direction, indicative of its recent price rally. Weekly and monthly momentum each recently flipped positive, suggesting the potential for further price appreciation from here. Those looking to add exposure should note that EWN is in overbought territory after the recent price movement, with initial support found at $31.

The iShares MSCI Germany ETF EWG and the iShares MSCI Sweden ETF EWD have each also led the EU member countries from a relative strength perspective, coming in at respective rankings of 14th and 16th in the World ETF Matrix. These areas have each moved higher to be at or near new 52-week highs after the stimulus announcement earlier this week, and have also each given four consecutive buy signals since their March lows. Germany (EWG) carries a favorable fund score of 3.99, while Sweden (EWD) shows a slightly better score of 4.55, each of which is paired with a score direction exceeding 3.00. In a similar fashion to the EWN, the continued price improvement from these funds has led to overbought/oversold (OBOS) readings north of our 70% threshold, indicating that new exposure would be best considered following a pullback or normalization of their respective trading bands.


Remember, these are technical comments only. Just as you must be aware of fundamental data for the stocks we recommend based on technical criteria in the report, so too must you be aware of important data regarding delivery, market moving government releases, and other factors that may influence commodity pricing. We try to limit our technical comments to the most actively traded contracts in advance of delivery, but some contracts trade actively right up to delivery while others taper off well in advance. Be sure you check your dates before trading these contracts. For questions regarding this section or additional coverage of commodities email james.west@dorseywright.com.
Data represented in the table below is through 07/22/2020:
Broad Market Commodities Report
| Symbol | Name | Price | PnF Trend | RS Signal | RS Col. | 200 Day MA | Weekly Mom |
|---|---|---|---|---|---|---|---|
| CL/ | Crude Oil Continuous | 41.96 | Positive | Buy | X | 43.62 | -3W |
| DBLCIX | Deutsche Bank Liquid Commodities Index | 268.23 | Negative | Sell | O | 282.49 | +15W |
| DWACOMMOD | DWA Continuous Commodity Index | 472.45 | Negative | Buy | O | 459.65 | -180W |
| GC/ | Gold Continuous | 1842.30 | Positive | Buy | X | 1615.56 | +3W |
| HG/ | Copper Continuous | 2.94 | Positive | Buy | X | 2.58 | +14W |
| ZG/ | Corn (Electronic Day Session) Continuous | 323.00 | Negative | Buy | O | 357.21 | -1W |
As anecdotes beginning with, “This has not happened since…” continue to surface, we have seen a correlated up move across several asset classes, in a departure from the longer-term status quo. We look to the Consumer Price Index (CPI) and the US dollar for evidence that this could be inflation driven.
Since March, both the Federal Reserve Bank and Congress have taken “unprecedented” policy measures to provide liquidity, stabilize the market, and bolster the economy. While there are a number of potential side effects of these stimulative actions, one that causes concern for many investors is inflation. As discussed several weeks ago, evidence for inflation stems from a general increase in prices and a fall in the purchasing power of money. The first piece of the equation can be measured using the Consumer Price Index (CPI), which provides a measure of the average change over time in prices paid by urban consumers for a market basket of consumer goods and services. According to the Bureau of Labor Statistics (as of 7/14), the consumer price index for all urban consumers rose 0.6% in June, while core inflation (which excludes food and energy prices) rose 0.2%. On a year-over-year basis, core inflation rose 1.2% (bls.gov). Although an increase, the reading remains well-below the beginning of the year as well as target inflation levels.
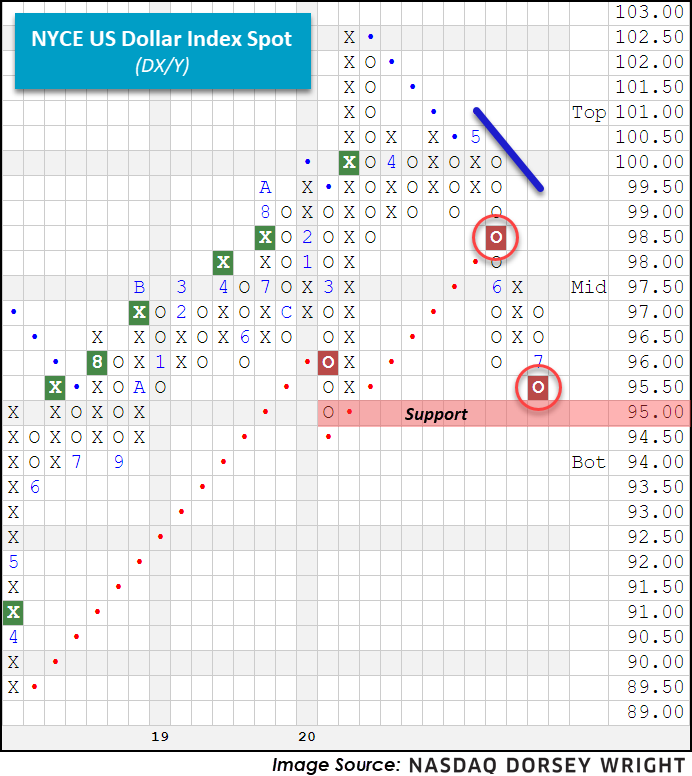
For the second piece of the equation, we turn to the US Dollar DX/Y and look for signs of weakness. Looking at the chart below we find DX/Y on two consecutive sell signals, most recently completing a bearish catapult. In addition, weekly and monthly momentum recently flipped to negative, each suggesting the potential for additional downside movement as we generally see these readings stay in one direction for seven to eight periods. The next level of support for DX/Y resides at 95.
Investors who are looking to take advantage of a weakening US dollar (should the trend continue) may wish to consider the Invesco DB US Dollar Index Bearish Fund UDN, a product designed to benefit from a weakening domestic currency. UDN currently sports a favorable 3.80 fund score and has a sharply positive score direction of 3.65, while also recently reentering a positive trend on its $0.10 chart. Furthermore, contrary to DX/Y, UDN recently experienced a flip to positive weekly and monthly momentum, suggesting the potential for additional upside. Note that UDN is currently in overbought territory with a weekly Overbought/Oversold (OBOS) reading of 72% while DX/Y is in oversold territory with a weekly OBOS reading of -75% (through 7/21).
In aggregate, there is evidence of rising inflation (or at least a market expectation for it), however, it is difficult to draw concrete conclusions given the multiple variables at play affecting the US Dollar. To keep track of further technical developments for DX/Y or the Consumer Price Index CONSUMERPRICE, make sure to use the blue “Set Alert” button at the top of chart pages.
Average Level
41.71
| AGG | iShares US Core Bond ETF |
| USO | United States Oil Fund |
| DIA | SPDR Dow Jones Industrial Average ETF |
| DVY | iShares Dow Jones Select Dividend Index ETF |
| DX/Y | NYCE U.S.Dollar Index Spot |
| EFA | iShares MSCI EAFE ETF |
| FXE | Invesco CurrencyShares Euro Trust |
| GLD | SPDR Gold Trust |
| GSG | iShares S&P GSCI Commodity-Indexed Trust |
| HYG | iShares iBoxx $ High Yield Corporate Bond ETF |
| ICF | iShares Cohen & Steers Realty ETF |
| IEF | iShares Barclays 7-10 Yr. Tres. Bond ETF |
| LQD | iShares iBoxx $ Investment Grade Corp. Bond ETF |
| IJH | iShares S&P 400 MidCap Index Fund |
| ONEQ | Fidelity Nasdaq Composite Index Track |
| QQQ | Invesco QQQ Trust |
| RSP | Invesco S&P 500 Equal Weight ETF |
| IWM | iShares Russell 2000 Index ETF |
| SHY | iShares Barclays 1-3 Year Tres. Bond ETF |
| IJR | iShares S&P 600 SmallCap Index Fund |
| SPY | SPDR S&P 500 Index ETF Trust |
| TLT | iShares Barclays 20+ Year Treasury Bond ETF |
| GCC | WisdomTree Continuous Commodity Index Fund |
| VOOG | Vanguard S&P 500 Growth ETF |
| VOOV | Vanguard S&P 500 Value ETF |
| EEM | iShares MSCI Emerging Markets ETF |
| XLG | Invesco S&P 500 Top 50 ETF |
Relative strength is a measure of how a stock is performing when compared to something else, in this case the S&P 500 Equal Weighted Index (SPXEWI). Each day the stock's closing price is divided by that of the SPXEWI, the resulting numbers decimal is moved two places and then plotted on a Point & Figure chart. Whenever the relative strength chart shows a double top buy signal (e.g. RS Buy or Positive Relative Strength), it suggests the stock is likely to outperform the market for the foreseeable future. Conversely, whenever the relative strength chart gives a double bottom sell signal (e.g. RS Sell or Negative Relative Strength) it suggests the stock will under-perform the market. Relative strength signals tend to last roughly 18 to 24 months on average. Consequently, changes from buy signals to sell signals (and vice versa) are important to be aware of as they are longer-term implications of a stock's likely performance versus the indices. Using the Point & Figure chart along with the relative strength chart will allow you to better ascertain risk-reward and other trade management tools, but we always want to over-weight our portfolios toward those stocks that are on RS buy signals, giving us the best chance of outperforming the broader market.
In the Optionable Universe, this week we saw 15 relative strength buy signals compared to 26 last week. On the sell side, there were 9 relative strength sell signals compared to 24 last week.
| Symbol | Company | Sector | Price | RS vs Market Signal | RS vs Market Column | RS vs Peer Signal | RS vs Peer Column | Tech Attrib |
|---|---|---|---|---|---|---|---|---|
| ARCB | ArcBest Corp. | Industrial Goods & Svcs | 31.490 | Buy | X | Buy | X | 5 |
| AEL | American Equity Investment Life Holding | Insurance | 26.200 | Buy | X | Sell | X | 4 |
| CMD | Cantel Medical Corp. | Medical Products | 50.670 | Buy | X | Buy | X | 4 |
| HOFT | Hooker Furniture Corporation | Cyclical Goods and Services | 21.710 | Buy | X | Sell | X | 4 |
| INFY | Infosys Technologies Limited (India) ADR | Technology Services | 12.490 | Buy | X | Sell | X | 4 |
| KTCC | Key Tronic Corp | Technology Hardware Equip | 7.150 | Buy | X | Buy | X | 5 |
| TREE | LendingTree Inc. | Banks | 354.760 | Buy | X | Buy | X | 5 |
| AAOI | Applied Optoelectronics, Inc. | Semiconductors | 13.925 | Buy | X | Sell | X | 3 |
| SUM | Summit Materials Inc | Construction | 18.220 | Buy | X | Buy | X | 4 |
| EVH | Evolent Health | Software | 10.270 | Buy | X | Sell | X | 4 |
| CPLG | CorePoint Lodging, Inc. | Real Estate Investment & Services | 5.060 | Buy | X | Buy | X | 4 |
| ALLY.TR | Ally Financial Inc. TR | Financial Services | 21.914 | Buy | X | Sell | X | 4 |
| SUM.TR | Summit Materials Inc TR | Construction | 18.220 | Buy | X | Buy | X | 4 |
| PII.TR | Polaris Inc. TR | Cyclical Goods and Services | 100.133 | Buy | X | Buy | X | 5 |
| CPLG.TR | CorePoint Lodging, Inc. TR | Real Estate Investment & Services | 5.306 | Buy | X | Buy | X | 4 |
| Symbol | Company | Sector | Price | RS vs Market Signal | RS vs Market Column | RS vs Peer Signal | RS vs Peer Column | Tech Attrib |
|---|---|---|---|---|---|---|---|---|
| ESS | Essex Property Trust Inc | Equity REITs | 215.720 | Sell | O | Buy | O | 1 |
| DRH | Diamondrock Hospitality Company | Equity REITs | 5.120 | Sell | O | Buy | O | 1 |
| NNVC | NanoViricides, Inc. | Pharmaceuticals | 6.960 | Sell | O | Buy | O | 1 |
| SCYX | Scynexis Inc. | Pharmaceuticals | 6.920 | Sell | O | Sell | O | 0 |
| KEGX | KEY ENERGY SERVICES, INC. | Oil Companies Major | 12.370 | Sell | O | Sell | O | 0 |
| ZYME | Zymeworks Inc. | Biotechnology | 30.650 | Sell | O | Buy | O | 1 |
| DRH.TR | Diamondrock Hospitality Company TR | Equity REITs | 5.120 | Sell | O | Buy | O | 1 |
| INN.TR | Summit Hotel Properties TR | Cyclical Goods and Services | 5.584 | Sell | O | Sell | O | 0 |
| NKLA | Nikola Corp. | Automobiles | 39.750 | Sell | O | Sell | O | 1 |
| Symbol | Company | Sector | Current Price | Action Price | Target | Stop | Notes |
|---|---|---|---|---|---|---|---|
| SIMO | Silicon Motion Technology Corporation (Taiwan) ADR | Semiconductors | $43.37 | upper 40s - lower 50s | 75 | 40 | 3 for 5'er, favored SEMI sector, multi consec buy signals,good support 3.4% yield Earnings 7/29 |
| BIG | Big Lots, Inc. | Retailing | $41.18 | hi 30s - low 40s | 66 | 32 | 3 for 5'er, #3 of 82 names in favored RETA sector matrix, pullback from multi-year high, 3%, pot. covered write |
| ABC | AmerisourceBergen Corporation | Drugs | $104.15 | mid 90s to low 100s | 122 | 81 | 4 for 5'er, favored DRUG sector, big base breakout, pullback from multi-year high, 1.7% yield. Earnings 8/5 |
| PYPL | Paypal Holdings Inc | Business Products | $175.58 | high 160s - low 180s | 200 | 138 | 4 for 5'er, top 10% of favored BUSI sector matrix, multi consec buy signals, pullback from ATH, pot. cov write, Earn. 7/29 |
| MBUU | Malibu Boats Inc. | Leisure | $57.17 | low $50s to low $60s | $71 | $44 | 5 for 5'er, LT peer RS buy signal, pos mon mom, fav DWALEIS Spread Triple Top Buy Signal |
| CHGG | Chegg Inc | Business Products | $76.58 | low-to-mid 70s | 101 | 62 | 5 for 5'er, top 10% of favored BUSI sector matrix, pullback from ATH, pos wkly mom flip, pot. cov write, Earn. 8/3 |
| MNST | Monster Beverage Corp. | Food Beverages/Soap | $75.00 | 70s | 87 | 62 | 5 for 5'er, top 20% of FOOD sector matrix, bullish triangle, pos wkly mom flip, Earn. 8/5 |
| NAV | Navistar International Corporation | Autos and Parts | $30.80 | high $20s to low $30s | $42 | $25 | 4 for 5'er, top 25% of DWAAUTO, consec buy signals, |
| ZTS | Zoetis Inc. | Drugs | $145.01 | 140s - low 150s | 166 | 118 | 4 for 5'er, top half of DRUG sector matrix, multi consec buys, pos wkly mom flip |
| Symbol | Company | Sector | Current Price | Action Price | Target | Stop | Notes |
|---|---|---|---|---|---|---|---|
| TAP | Molson Coors Company | Food Beverages/Soap | $35.85 | mid 30s | $22 | $41 | 0 for 5'er, consec sell signals, spread triple bottom, LT market RS sell signal, bottom of DWAFOOD Earnings 7/30 |
| Symbol | Company | Sector | Current Price | Action Price | Target | Stop | Notes |
|---|---|---|---|---|---|---|---|
| BBY | Best Buy Co., Inc. | Retailing | $90.28 | 82 - 90 | 97 | 72 | 4 for 5'er, favored RETA sector, bullish catapult, 2.6% yield, pot. covered write |
| Comment |
|---|
| BBY Best Buy Co., Inc. R ($97.64) - Retailing - BBY has moved above the ideal action range. OK to hold here. We will raise our stop to $80, the third potential sell signal on BBY's default chart. |
ZTS Zoetis Inc. R ($145.06) - Drugs - ZTS is a 4 for 5'er that ranks in the top half of the drugs sector matrix and has been on a market RS buy signal for more than five years. On its default chart, ZTS has given three consecutive buy signals and recently reached $146, matching the all-time high it established earlier this year. A recent flip to positive weekly momentum is a positive sign of ZTS's potential for further upside. Long exposure may be added in the $140s to low $150s and we will set our initial stop at $118, the potential trend line violation on ZTS's default chart. We will use the bullish price objective, $166 as our target price. ZTS carries a 0.5% yield.
| 19 | 20 | ||||||||||||||||||||||||||||||||||||||||||||||||||||
| 146.00 | X | • | X | 146.00 | |||||||||||||||||||||||||||||||||||||||||||||||||
| 144.00 | X | O | • | X | 144.00 | ||||||||||||||||||||||||||||||||||||||||||||||||
| 142.00 | X | X | O | X | • | 6 | X | 142.00 | |||||||||||||||||||||||||||||||||||||||||||||
| 140.00 | X | O | 2 | O | X | O | • | X | O | X | X | 140.00 | |||||||||||||||||||||||||||||||||||||||||
| 138.00 | X | O | X | O | X | O | • | X | O | X | O | 7 | 138.00 | ||||||||||||||||||||||||||||||||||||||||
| 136.00 | X | O | X | O | X | O | • | X | X | O | X | O | X | 136.00 | |||||||||||||||||||||||||||||||||||||||
| 134.00 | 1 | O | O | 3 | O | • | X | O | X | O | X | O | X | Mid | 134.00 | ||||||||||||||||||||||||||||||||||||||
| 132.00 | X | O | X | O | • | 5 | X | O | X | O | O | 132.00 | |||||||||||||||||||||||||||||||||||||||||
| 130.00 | 9 | X | X | O | X | O | • | X | X | X | X | O | X | O | 130.00 | ||||||||||||||||||||||||||||||||||||||
| 128.00 | X | O | A | O | X | X | O | O | • | X | O | X | O | X | O | X | O | X | 128.00 | ||||||||||||||||||||||||||||||||||
| 126.00 | X | O | X | O | X | O | X | X | O | • | X | O | X | O | X | O | X | O | X | 126.00 | |||||||||||||||||||||||||||||||||
| 124.00 | X | O | X | O | X | O | X | O | C | O | X | O | O | O | O | X | 124.00 | ||||||||||||||||||||||||||||||||||||
| 122.00 | X | O | X | O | B | X | O | X | O | X | O | 122.00 | |||||||||||||||||||||||||||||||||||||||||
| 120.00 | X | O | O | O | X | O | X | X | 120.00 | ||||||||||||||||||||||||||||||||||||||||||||
| 118.00 | 8 | O | X | O | X | X | X | O | X | • | 118.00 | ||||||||||||||||||||||||||||||||||||||||||
| 116.00 | X | O | O | X | O | X | O | X | O | X | • | Bot | 116.00 | ||||||||||||||||||||||||||||||||||||||||
| 114.00 | X | O | X | O | X | O | X | 4 | X | • | 114.00 | ||||||||||||||||||||||||||||||||||||||||||
| 112.00 | X | O | X | O | X | X | O | O | • | 112.00 | |||||||||||||||||||||||||||||||||||||||||||
| 110.00 | X | O | X | O | X | O | X | • | 110.00 | ||||||||||||||||||||||||||||||||||||||||||||
| 108.00 | X | O | O | X | O | X | • | 108.00 | |||||||||||||||||||||||||||||||||||||||||||||
| 106.00 | 6 | O | X | O | X | • | 106.00 | ||||||||||||||||||||||||||||||||||||||||||||||
| 104.00 | 5 | O | X | O | X | • | 104.00 | ||||||||||||||||||||||||||||||||||||||||||||||
| 102.00 | 4 | X | • | O | X | O | X | • | 102.00 | ||||||||||||||||||||||||||||||||||||||||||||
| 100.00 | X | O | X | • | O | X | O | X | • | 100.00 | |||||||||||||||||||||||||||||||||||||||||||
| 99.00 | X | O | X | • | O | X | O | X | • | 99.00 | |||||||||||||||||||||||||||||||||||||||||||
| 98.00 | X | O | X | • | O | X | O | X | • | 98.00 | |||||||||||||||||||||||||||||||||||||||||||
| 97.00 | X | X | O | • | O | O | X | • | 97.00 | ||||||||||||||||||||||||||||||||||||||||||||
| 96.00 | • | 3 | O | X | • | O | X | • | 96.00 | ||||||||||||||||||||||||||||||||||||||||||||
| 95.00 | X | • | • | X | O | X | • | O | X | • | 95.00 | ||||||||||||||||||||||||||||||||||||||||||
| 94.00 | X | O | X | • | X | O | X | • | O | X | • | 94.00 | |||||||||||||||||||||||||||||||||||||||||
| 93.00 | X | O | X | O | • | X | O | X | • | O | X | • | 93.00 | ||||||||||||||||||||||||||||||||||||||||
| 92.00 | X | O | X | O | X | • | X | O | • | O | X | • | 92.00 | ||||||||||||||||||||||||||||||||||||||||
| 91.00 | O | X | C | X | O | • | X | • | O | • | 91.00 | ||||||||||||||||||||||||||||||||||||||||||
| 90.00 | O | X | O | X | O | • | X | • | • | 90.00 | |||||||||||||||||||||||||||||||||||||||||||
| 89.00 | O | X | O | X | O | • | X | • | 89.00 | ||||||||||||||||||||||||||||||||||||||||||||
| 88.00 | O | O | O | • | X | • | 88.00 | ||||||||||||||||||||||||||||||||||||||||||||||
| 87.00 | O | X | 2 | • | 87.00 | ||||||||||||||||||||||||||||||||||||||||||||||||
| 86.00 | O | X | O | X | • | 86.00 | |||||||||||||||||||||||||||||||||||||||||||||||
| 85.00 | O | X | X | O | X | • | 85.00 | ||||||||||||||||||||||||||||||||||||||||||||||
| 84.00 | O | X | O | X | O | X | • | 84.00 | |||||||||||||||||||||||||||||||||||||||||||||
| 83.00 | O | X | O | X | O | • | 83.00 | ||||||||||||||||||||||||||||||||||||||||||||||
| 82.00 | O | X | 1 | • | 82.00 | ||||||||||||||||||||||||||||||||||||||||||||||||
| 81.00 | O | X | • | 81.00 | |||||||||||||||||||||||||||||||||||||||||||||||||
| 80.00 | • | O | X | • | 80.00 | ||||||||||||||||||||||||||||||||||||||||||||||||
| 79.00 | • | O | • | 79.00 | |||||||||||||||||||||||||||||||||||||||||||||||||
| 19 | 20 |
| ABG Asbury Automotive Group Inc. ($103.90) - Retailing - ABG broke a double top at $104 on Wednesday, marking the fourth consecutive buy signal on the chart. This stock is a 5 for 5’er that ranks 9th out of 82 stocks in the favored retailing sector. Monthly momentum just flipped positive, adding to the positive technical picture. From here, initial support sits at $97 while overhead resistance lies at $122, the stock’s all-time high. Earnings are expected on 7/28. |
| HQY HealthEquity, Inc. ($55.89) - Healthcare - HQY broke a double bottom at $56 after bouncing off of its bearish resistance line once again. This marks the fourth consecutive sell signal for this 0 for 5’er, confirming that supply is in control. Both weekly and monthly momentum metrics are both negative. Avoid as the weight of the evidence is negative. Initial support sits at $55. |
| KL Kirkland Lake Gold Inc ($48.64) - Precious Metals - KL broke a double top at $49 on Wednesday, marking the second consecutive buy signal on the chart. This stock is a solid 4 for 5’er within the favored precious metals sector that has maintained a long-term market RS buy signal since February 2016. Monthly momentum just flipped positive, while weekly momentum has been positive for four weeks. The weight of the evidence is positive. From here, initial support sits at $44. |
| MWK Mohawk Group Holdings, Inc. ($6.79) - Internet - MWK completed a bullish catapult pattern on Wednesday with a double top buy signal at $6.50. This stock is a 4 for 5’er within the favored internet sector that has experienced two months of positive monthly momentum. Note MWK is testing resistance at current levels and has support available at $4.50. |
| NDSN Nordson Corporation ($192.90) - Machinery and Tools - Nordson shares moved higher to $194 and broke a double top, marking its second consecutive buy signal. This 5 for 5'er has been in a positive trend since April and has maintained a market RS buy signal since November 2016. Monthly momentum has been positive for three months, suggesting that there may be room for more upside potential. NDSN is actionable at current levels. From here, support is offered at $186 with resistance at $196. Note that earnings are expected on 8/18/20. |
| OLLI Ollies Bargain Outlet Holding Inc. ($108.05) - Retailing - OLLI returned to a buy signal with a double top breakout at $102 before moving higher to $110 with today’s action. As a result, OLLI is now trading at new all-time highs. This stock is a solid 3 for 5’er within the favored retailing sector that moved back into a positive trend in early April. OLLI currently ranks 22nd out of 82 names in the sector RS matrix, confirming its strength versus its peers. Demand is in control, and the technical weight of the evidence is positive. From here, initial support sits at $94. |
| SGRY Surgery Partners ($15.13) - Healthcare - SGRY reversed up into a column of Xs Wednesday and broke a double top at $15.50. This 5 for 5'er moved to a positive trend last week and ranks in the top half of the favored healthcare sector RS matrix. Weekly momentum also recently flipped positive, suggesting the potential for further upside from here. Exposure may be considered at current levels, with initial support offered at $13.50. Further support may be found at the bullish support line, which currently sits at $11.50. Note that SGRY is at overhead resistance from June of this year and has earnings expected on 8/5. |
| TENB Tenable Holdings, Inc. ($31.29) - Software - TENB continued higher Wednesday to complete a bullish triangle at $32, marking a third consecutive buy signal and matching a 52-week high last seen in June. This 3 for 5'er moved to a positive trend in April and ranks in the top half of the favored software sector RS matrix. The overall technical picture continues to strengthen here. Initial support can be found at $28 with further support found at $27. Note that earnings are expected on 7/28. |
| WSM Williams-Sonoma, Inc. ($85.84) - Retailing - Williams-Sonoma shares returned to a buy signal with a double top breakout at $86 before pushing higher to $87. This 5 for 5'er has been in a positive trend since April and has maintained a market RS buy signal since May. Additionally, WSM ranks in the top third of the favored retailing sector RS matrix. Monthly momentum has been positive for three months, suggesting the potential for higher prices. From here, initial support sits at $81 with overhead resistance at $88. Note WSM offers a 2.33% yield. |
| XEL Xcel Energy, Inc. ($68.68) - Utilities/Electricity - Shares of XEL advanced on Wednesday to break a spread quintuple top at $68, returning the stock to a buy signal. The 4 for 5'er ranks in the top quartile of the favored utilities/electricity stock sector matrix and reentered a positive trend in April of this year, demonstrating favorable relative and absolute strength, respectively. In addition, XEL recently experienced a flip to positive weekly momentum, suggesting the potential for further upside. Demand is in control. The next level of resistance resides at $70 while initial support is offered at $62. Note XEL also offers a yield of 2.6% and expects to release earnings on July 30th. |
| Name | Option Symbol | Action | Stop Loss |
|---|---|---|---|
| ProLogis - $98.38 | PLD2020K95 | Buy the November 95.00 calls at 8.80 | 92.00 |
| Name | Option | Action |
|---|---|---|
| Home Depot, Inc. ( HD) | Sep. 250.00 Calls | Raise the option stop loss to 18.45 (CP: 20.45) |
| Agilent Technologies, Inc ( A) | Nov. 85.00 Calls | Raise the option stop loss to 11.50 (CP: 13.50) |
| Monster Beverage Corp. ( MNST) | Sep. 65.00 Calls | Raise the option stop loss to 9.40 (CP: 11.40) |
| Lowe's Companies, Inc. ( LOW) | Sep. 130.00 Calls | Raise the option stop loss to 17.95 (CP: 19.95) |
| Lowe's Companies, Inc. ( LOW) | Oct. 130.00 Calls | Raise the option stop loss to 19.60 (CP: 21.60) |
| Monster Beverage Corp. ( MNST) | Dec. 70.00 Calls | Raise the option stop loss to 7.40 (CP: 9.40) |
| Carmax Group ( KMX) | Oct. 92.50 Calls | Initiate an option stop loss of 9.00 (CP: 11.00) |
| Best Buy Co., Inc. ( BBY) | Oct. 85.00 Calls | Initiate an option stop loss of 11.65 (CP: 13.65) |
| Name | Option Symbol | Action | Stop Loss |
|---|---|---|---|
| Ralph Lauren - $71.36 | RL2016V75 | Buy the October 75.00 puts at 9.60 | 76.00 |
| Name | Option | Action |
|---|---|---|
|
|
||
| Name | Option Sym. | Call to Sell | Call Price | Investment for 500 Shares | Annual Called Rtn. | Annual Static Rtn. | Downside Protection |
|---|---|---|---|---|---|---|---|
| JD.COM INC $62.61 | JD2016J65 | Oct. 65.00 | 3.85 | $29,323.45 | 41.50% | 23.11% | 5.16% |
| Name | Action |
|---|---|
| Bank of America (BAC) - 24.42 | Sell the November 25.00 Calls. |
| Applied Materials, Inc. (AMAT) - 63.81 | Sell the October 65.00 Calls. |
| Chegg Inc (CHGG) - 76.58 | Sell the October 75.00 Calls. |
| Big Lots, Inc. (BIG) - 41.18 | Sell the October 42.50 Calls. |
| Wendy's Company (WEN) - 22.81 | Sell the October 23.00 Calls. |
| Fifth Third Bancorp (FITB) - 19.36 | Sell the November 19.00 Calls. |
| Chegg Inc (CHGG) - 76.58 | Sell the October 75.00 Calls. |
| Wendy's Company (WEN) - 22.81 | Sell the November 23.00 Calls. |
| L Brands Inc. (LB) - 18.87 | Sell the November 20.00 Calls. |
| Name | Covered Write |
|---|---|
| Micron Technology, Inc. ( MU - 51.52 ) | October 50.00 covered write. |
| Best Buy Co., Inc. ( BBY - 90.28 ) | September 90.00 covered write. |
Daily Equity & Market Analysis
Loading, Please Wait...
