
Assessing inflation with negative Consumer Price Index numbers and a falling dollar.
Remember, these are technical comments only. Just as you must be aware of fundamental data for the stocks we recommend based on technical criteria in the report, so too must you be aware of important data regarding delivery, market moving government releases, and other factors that may influence commodity pricing. We try to limit our technical comments to the most actively traded contracts in advance of delivery, but some contracts trade actively right up to delivery while others taper off well in advance. Be sure you check your dates before trading these contracts. For questions regarding this section or additional coverage of commodities email james.west@dorseywright.com.
Data represented in the table below is through 06/09/2020:
Broad Market Commodities Report
Portfolio View - Commodity Indices
| Symbol | Name | Price | PnF Trend | RS Signal | RS Col. | 200 Day MA | Weekly Mom |
|---|---|---|---|---|---|---|---|
| CL/ | Crude Oil Continuous | 38.72 | Negative | Buy | X | 46.04 | +7W |
| DBLCIX | Deutsche Bank Liquid Commodities Index | 256.84 | Negative | Sell | O | 290.29 | +9W |
| DWACOMMOD | DWA Continuous Commodity Index | 452.25 | Negative | Buy | O | 460.41 | +8W |
| GC/ | Gold Continuous | 1720.80 | Positive | Buy | X | 1577.40 | -5W |
| HG/ | Copper Continuous | 2.60 | Negative | Buy | O | 2.56 | +8W |
| ZG/ | Corn (Electronic Day Session) Continuous | 327.25 | Negative | Buy | O | 361.85 | +6W |
Since March, both the Federal Reserve Bank and Congress have taken “unprecedented” policy measures to provide liquidity, inflate asset prices, and ultimately stimulate the economy. While it is still very much up for debate whether or not quantitative easing leads to inflation in the long-term, having a game plan for potential inflation is important in guiding long-term investment decisions.The first step is finding evidence of inflation, which is defined as “a general increase in prices and fall in the purchasing value of money.” Given this definition, evidence of inflation would be a rise in prices and or a decrease in the value of the dollar. The first piece of the equation can be measured using the Consumer Price Index (CPI). The index provides a measure of the average change over time in prices paid by urban consumers for a market basket of consumer goods and services. According to the Bureau of Labor Statistics, the CPI has fallen for the last three consecutive months of March, April, and most recently, May (source: BLS). For now, the CPI has painted a picture of deflation rather than inflation.
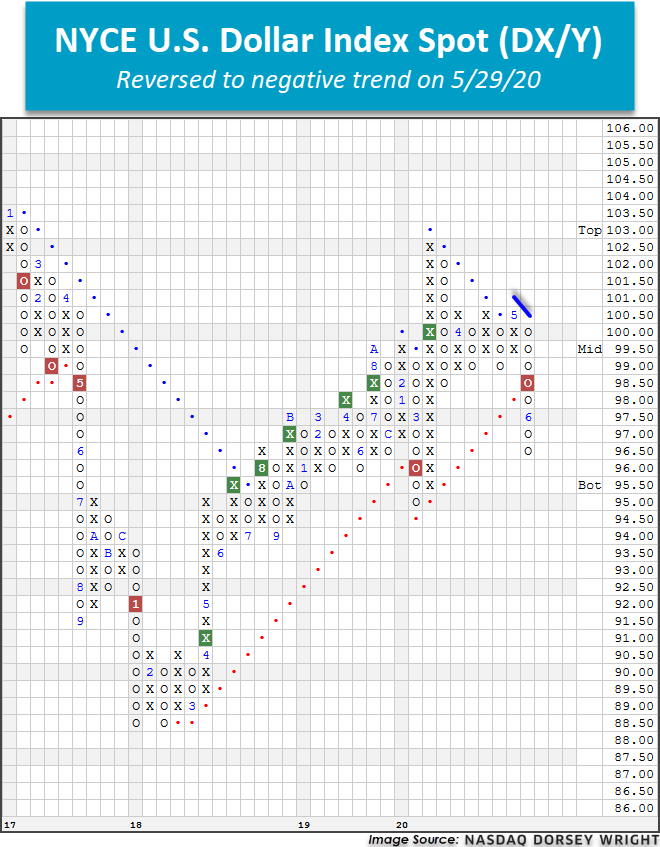
For the second part of the equation, we turn to the dollar. If there is evidence of inflation, then the value of the dollar should be decreasing. When we look at the NYCE U.S. Dollar Index Spot DX/Y there are signs of weakness. After two months of consolidation near the $100 level on its Point & Figure Chart, DX/Y broke through a triple bottom at $98.50 to return to a sell signal and has since fallen into a negative trend at the end of May.
What do we make of these conflicting pieces of evidence? Although there hasn’t been a general increase in prices, we have also seen signs of a decrease in the purchasing power of the dollar. One fact worth remembering is that the Consumer Price Index is reported monthly and posthumously, whereas DX/Y is constantly changing and potentially can be seen as more of a leading view of potential inflation. Although the evidence is not overwhelming at this point, if you’re concerned about inflation and are looking for an alternative to using Treasury inflation-protected securities (TIPS), there is another option. The Index IQ Real Return ETF CPI tracks an index that seeks to provide a “real return” or a return above the rate of inflation thus providing a hedge to a rise in the Consumer Price Index. The fund holds a variety of fixed income, equities, and real asset funds in an “ETF of ETFs” wrapper. This provides a unique alternative to traditional inflation-protected fixed income investments and is dynamic to reflect inflation expectations. Despite a suboptimal fund score of 1.62, CPI has rallied off its March low of $25.10 to complete three consecutive buy signals on its way to $27.30 on the more-sensitive 0.10 pt chart. From here, support is offered at $27. Note that CPI carries a yield of 2.17% and an expense ratio of 0.44%.

For more information on liquid alternative strategies including CPI, please register for next Tuesday's (6/16) webinar at 2 pm ET.
