
Today we highlight the iShares MSCI Emerging Markets ETF (EEM) and its recent technical improvement.
Portfolio View - Major Market ETFs
| Symbol | Name | Price | Yield | PnF Trend | RS Signal | RS Col. | Fund Score | 200 Day MA | Weekly Mom |
|---|---|---|---|---|---|---|---|---|---|
| DIA | SPDR Dow Jones Industrial Average ETF Trust | 268.34 | 2.23 | Positive | X | 3.52 | 262.45 | +1W | |
| EEM | iShares MSCI Emerging Markets ETF | 43.72 | 2.04 | Positive | Sell | O | 4.52 | 40.63 | +15W |
| EFA | iShares MSCI EAFE ETF | 63.95 | 2.55 | Positive | Sell | O | 1.65 | 62.93 | +1W |
| FM | iShares MSCI Frontier 100 ETF | 23.82 | 3.33 | Negative | Sell | O | 0.30 | 26.31 | -3W |
| IJH | iShares S&P MidCap 400 Index Fund | 184.37 | 1.75 | Positive | Buy | O | 2.84 | 183.04 | -4W |
| IJR | iShares S&P SmallCap 600 Index Fund | 70.69 | 1.67 | Positive | Buy | O | 2.48 | 72.35 | +1W |
| QQQ | Invesco QQQ Trust | 264.00 | 0.62 | Positive | Buy | X | 5.84 | 215.67 | +4W |
| RSP | Invesco S&P 500 Equal Weight ETF | 106.33 | 2.02 | Positive | Buy | X | 3.67 | 104.52 | -4W |
| SPY | SPDR S&P 500 ETF Trust | 325.01 | 1.76 | Positive | O | 4.23 | 303.18 | +1W | |
| XLG | Invesco S&P 500 Top 50 ETF | 251.91 | 1.45 | Positive | O | 5.58 | 225.57 | +2W |
Additional Comments:
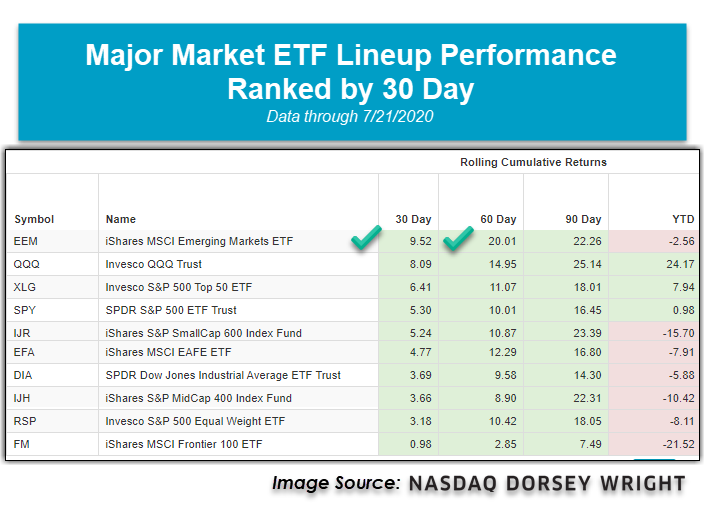
Over the last week of market action, nine of the ten major market ETFs covered in this report finished the week in positive territory while just one ETF finished in the red. When all was said and done, the best performing of the group was the iShares S&P SmallCap 600 Index Fund IJR, which posted a notable gain of 4.59% while the iShares MSCI Frontier 100 ETF FM was the worst-performing fund with a cumulative seven-day loss of -1.08%. There are now three major market funds sitting in positive territory on a year-to-date basis; the Invesco QQQ Trust QQQ continues to dominate the performance rankings with a gain of 24.17%. At the same time, the Invesco S&P 500 Top 50 ETF XLG is the second-best performing, up 7.94%, and the SPDR S&P 500 ETF Trust SPY is currently ranked third in terms of performance so far into 2020, up 0.98%. Today, we will highlight the recent strength from the iShares MSCI Emerging Markets ETF EEM as it is the best-performing major market fund over the last 30 and 60 days, up 9.52% and 20.01%, respectively.
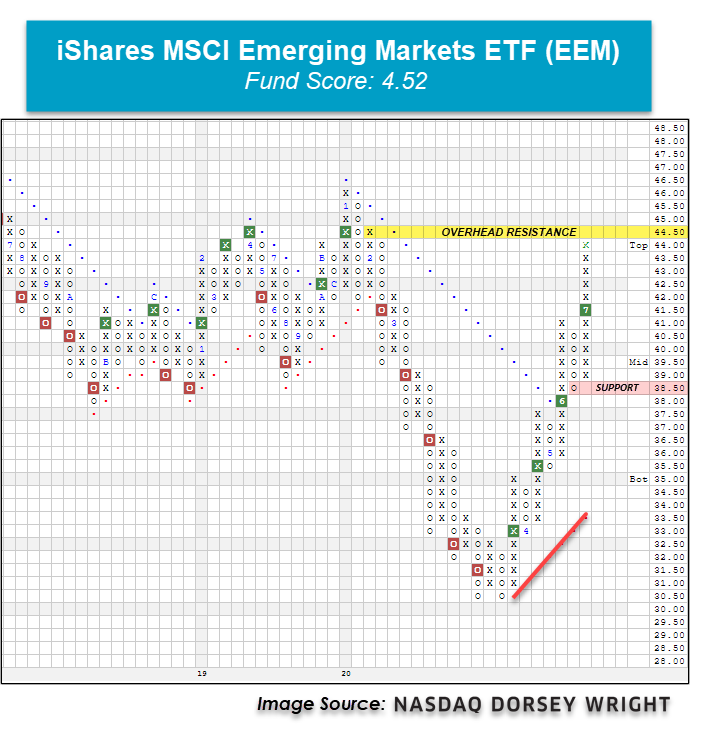
With yesterday’s intraday action, the iShares MSCI Emerging Markets ETF EEM printed an X at the $44 level, putting the fund just half a point off of its February high of $44.50 and two points off of its multi-year high watermark of $46 recorded in January. This rally comes as EEM continues to recover off of its $30.50 March low recorded as a result of the sell-off triggered by the COVID-19 global pandemic. Before reaching this multi-year low level, EEM moved to a sell signal in February with a triple bottom break at $41.50 and gave a total of five consecutive sell signals over the next month. On March 25, EEM returned to a buy signal at $33 and has since recorded a total of four successive buy signals, confirming that demand is in control. Additionally, EEM just experienced a flip to positive monthly momentum after having spent the four previous months negative, suggesting the potential for higher prices.
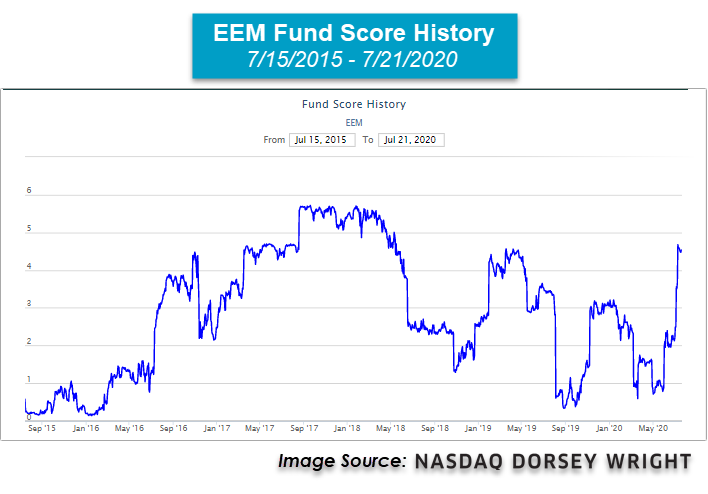
As we mentioned in last week’s International Equity Overview, while the improvement in technical strength is visible on EEM’s trend chart, it is also evident when we review EEM’s recent uptick in fund score. Recall that EEM saw its first significant score gain between Thursday, July 2, and Monday, July 6, where its 2.49 score improved by over one full point, jumping to 3.56. The score underwent another significant increase later that week, as the July 9 reading increased by a whole score point to 4.68. Currently, EEM remains close to that reading with a fund score of 4.52. This swift improvement recently observed in EEM’s score speaks to the flexible and dynamic nature of the NDW fund scoring system evaluated daily. As a refresher, the NDW fund scoring system uses a total of 19 data points to determine the technical health of a fund, combining both absolute and relative metrics. In addition to its current strong score of 4.52, EEM also possesses a strongly positive score direction of 3.93, which speaks to the score’s significant peak-to-trough improvement over the trailing six months.
Overall, the weight of the evidence is positive here for EEM; however, the fund is 87% overbought on its 10-week trading band, signaling an overbought trading posture. As a result, those looking to initiate new positions may want to scale in here or wait for a potential pullback/normalization of the fund’s OBOS% reading. From here, initial support is offered at $38.50, while resistance sits at $44.50, EEM’s February high. Note EEM offers a yield of 2.04%. Despite being the stronger area when we break down the international space, EEM remains negative on the year with a loss of -2.56%. In comparison, EEM’s developed counterpart, the iShares MSCI EAFE ETF EFA is down -7.91%, underperforming EEM by more than 5%.
