The US dollar begins to show signs of technical weakness
Remember, these are technical comments only. Just as you must be aware of fundamental data for the stocks we recommend based on technical criteria in the report, so too must you be aware of important data regarding delivery, market moving government releases, and other factors that may influence commodity pricing. We try to limit our technical comments to the most actively traded contracts in advance of delivery, but some contracts trade actively right up to delivery while others taper off well in advance. Be sure you check your dates before trading these contracts. For questions regarding this section or additional coverage of commodities email james.west@dorseywright.com.
Data represented in the table below is through 07/22/2020:
Broad Market Commodities Report
Portfolio View - Commodity Indices
| Symbol | Name | Price | PnF Trend | RS Signal | RS Col. | 200 Day MA | Weekly Mom |
|---|---|---|---|---|---|---|---|
| CL/ | Crude Oil Continuous | 41.96 | Positive | Buy | X | 43.62 | -3W |
| DBLCIX | Deutsche Bank Liquid Commodities Index | 268.23 | Negative | Sell | O | 282.49 | +15W |
| DWACOMMOD | DWA Continuous Commodity Index | 472.45 | Negative | Buy | O | 459.65 | -180W |
| GC/ | Gold Continuous | 1842.30 | Positive | Buy | X | 1615.56 | +3W |
| HG/ | Copper Continuous | 2.94 | Positive | Buy | X | 2.58 | +14W |
| ZG/ | Corn (Electronic Day Session) Continuous | 323.00 | Negative | Buy | O | 357.21 | -1W |
As anecdotes beginning with, “This has not happened since…” continue to surface, we have seen a correlated up move across several asset classes, in a departure from the longer-term status quo. We look to the Consumer Price Index (CPI) and the US dollar for evidence that this could be inflation driven.
Since March, both the Federal Reserve Bank and Congress have taken “unprecedented” policy measures to provide liquidity, stabilize the market, and bolster the economy. While there are a number of potential side effects of these stimulative actions, one that causes concern for many investors is inflation. As discussed several weeks ago, evidence for inflation stems from a general increase in prices and a fall in the purchasing power of money. The first piece of the equation can be measured using the Consumer Price Index (CPI), which provides a measure of the average change over time in prices paid by urban consumers for a market basket of consumer goods and services. According to the Bureau of Labor Statistics (as of 7/14), the consumer price index for all urban consumers rose 0.6% in June, while core inflation (which excludes food and energy prices) rose 0.2%. On a year-over-year basis, core inflation rose 1.2% (bls.gov). Although an increase, the reading remains well-below the beginning of the year as well as target inflation levels.
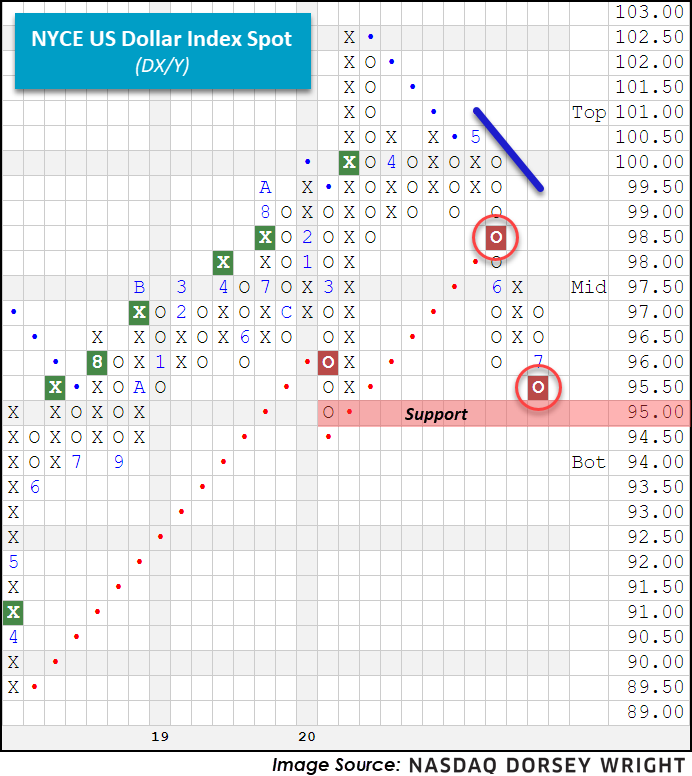
For the second piece of the equation, we turn to the US Dollar DX/Y and look for signs of weakness. Looking at the chart below we find DX/Y on two consecutive sell signals, most recently completing a bearish catapult. In addition, weekly and monthly momentum recently flipped to negative, each suggesting the potential for additional downside movement as we generally see these readings stay in one direction for seven to eight periods. The next level of support for DX/Y resides at 95.
Investors who are looking to take advantage of a weakening US dollar (should the trend continue) may wish to consider the Invesco DB US Dollar Index Bearish Fund UDN, a product designed to benefit from a weakening domestic currency. UDN currently sports a favorable 3.80 fund score and has a sharply positive score direction of 3.65, while also recently reentering a positive trend on its $0.10 chart. Furthermore, contrary to DX/Y, UDN recently experienced a flip to positive weekly and monthly momentum, suggesting the potential for additional upside. Note that UDN is currently in overbought territory with a weekly Overbought/Oversold (OBOS) reading of 72% while DX/Y is in oversold territory with a weekly OBOS reading of -75% (through 7/21).
In aggregate, there is evidence of rising inflation (or at least a market expectation for it), however, it is difficult to draw concrete conclusions given the multiple variables at play affecting the US Dollar. To keep track of further technical developments for DX/Y or the Consumer Price Index CONSUMERPRICE, make sure to use the blue “Set Alert” button at the top of chart pages.