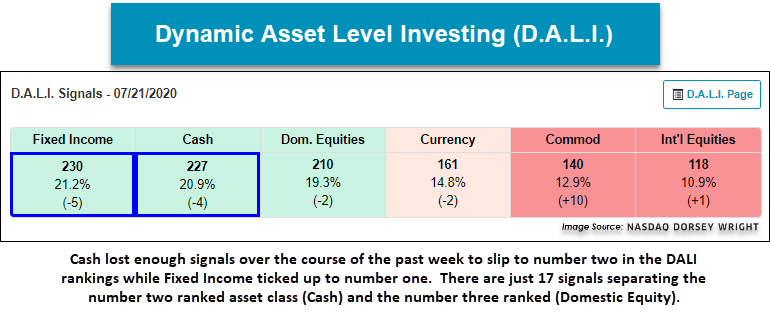
We highlight notable changes in DALI asset class rankings as Fixed Income moves to number one while Cash dips back to number two
The most notable change in the DALI asset class rankings was the move up to number one by Fixed Income while Cash dipped back to number two. Cash lost enough signals over the course of the past week to slip to number two in the DALI rankings while Fixed Income ticked up to number one. There are just 17 signals separating the number two ranked asset class (Cash) and the number three ranked (Domestic Equity). It is also interesting to note that the Commodities asset class has picked up about 15 new buy signals over the course of the past couple days, suggesting that a large part of the signals Fixed Income and Cash lost were lost to Commodities. With that said, Commodities still sit in the number five position with just 140 signals today, but as Gold, Silver, and even Crude have seen notable rallies of late the Commodities asset class will be one to watch over the coming days and weeks.

The Domestic Equities asset class is certainly within striking distance of moving back into one of the top two spots, so this will be something to monitor especially for those following DALI based asset allocation strategies like a 3 Legged Stool or Tactical Tilt. Note a move back into one of the top two asset classes would be cause for portfolio adjustments to increase equities which fell out of the top two spots in mid March, and despite the rally the market has seen, Domestic Equities have not been able to move back up. One of the things that has been extremely difficult in this market has been the speed and velocity of which this market corrected and subsequently recovered, as well as the narrowness of the leadership. To put the speed of this pullback into perspective it took the market just 22 days to fall 20% from the February 19th peak. That was the fastest correction of 20% the we have ever seen (excluding the 1930’s). In 2008 it took nine months for the market to correct 20% off the October 2007 high (October 2007 to July 2008). In 2002, it took 6 months to hit 20% down (January 2002 to July 2002).
This correction also came off a rather strong move higher in equities off the December 2018 low. The S&P 500 was up 44% from 12/24/18 to 2/19/20, also during the run FV was up 45% and PDP was up 55%. That explosive move higher, while great for the 2019 calendar year, left a number of relative strength charts up on stems; therefore, in order to generate sell signals they needed to fall more than 20%. Unlike 2018, which was a benefit to the portfolios, this time around it was not. This brings us to the “why haven’t we gone back in?” Well for very similar, yet completely opposite reasons. As quick as the move down was off the Feb peak, the rally back as been equally as explosive to the upside leaving relative strength charts, in some cases, far away from buy signals upon the initial reversals up. The best case scenario would have been to get some back and forth action off the bottom to setup buy signals from much lower levels; however, that didn’t happen for many charts. This “V shaped” recovery the market has experienced is a very difficult environment for relative strength or trend following of any kind, and is not the common bottoming process for the market. In the 2002 and 2008/09 bottom you got quite a bit of back and forth, as those bottoms were more of a process then an event like this year.
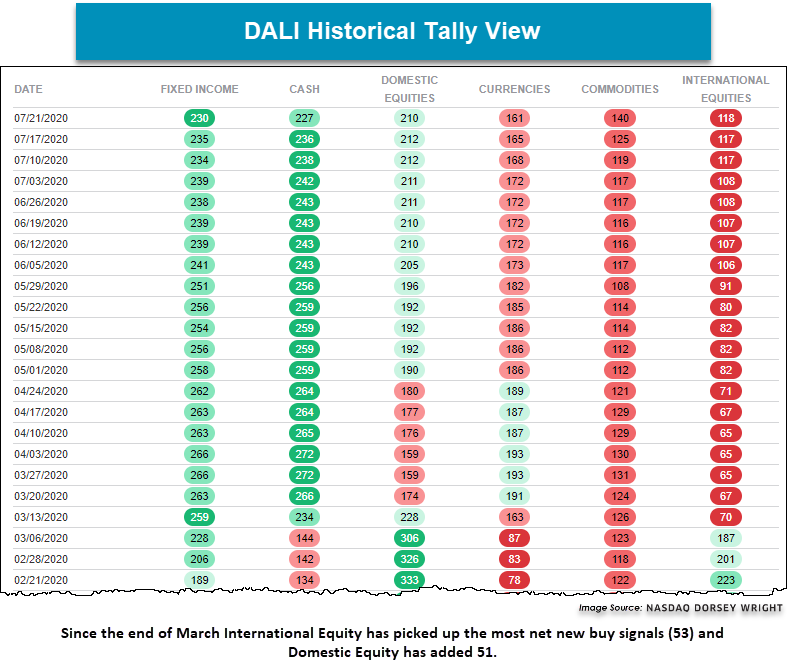
Only time will tell how this ultimately unfolds. There certainly are a fair number of risks out there in the market. But as it stands Domestic Equities are separated by the number two ranked asset class by just 17 signals. Interestingly, Domestic Equities have added the second most buy signals (51) since the end of March. Only International Equities have added more (53), so we will continue to monitor the relative strength charts, watch for potential changes, and adjust portfolios accordingly when and if the time comes.

