
Most Requested Symbols

Silver, Crude Oil, and Gold have all seen increased demand and rising prices.
Today's featured stock is Navistar International Corporation (NAV)
BIP, CC, DNKN, ELY, FIS, HZO, IPHI, LAD, MBUU & NEM
Call: Best Buy (BBY), Put: Tyson Foods (TSN), Covered Write: L Brands (L)
Market Update Webinar Replay: Missed Monday's webcast? Click the link(s) below for a recap:
Mid -Year Market Review: Join the Nasdaq Dorsey Wright team on Wednesday, July 29th at 1pm EST as we discuss the volatile market movement through the first six months of the year and what to monitor in the second half of 2020. Click here to register.
Speakers include:
Models Workshop: The Investment Models Workshop is designed specifically for financial professionals looking to incorporate Nasdaq Dorsey Wright's (NDW) turnkey model solutions into their investment practice, as well as those who would just like to learn more. This three-hour virtual course will not only give you the chance to engage with experts from NDW, but will also expose you to new strategies, investment frameworks, and best practices for utilizing the NDW Research Platform to help you manage your business with more confidence, efficiency, and greater scale. Investments & Wealth Institute® has accepted the Nasdaq Dorsey Wright Investment Models Workshop for 3 hours of CE credit towards the CIMA®, CPWA®, CIMC®, and RMA certifications. The workshop will take place August 6th, Click here for more information.
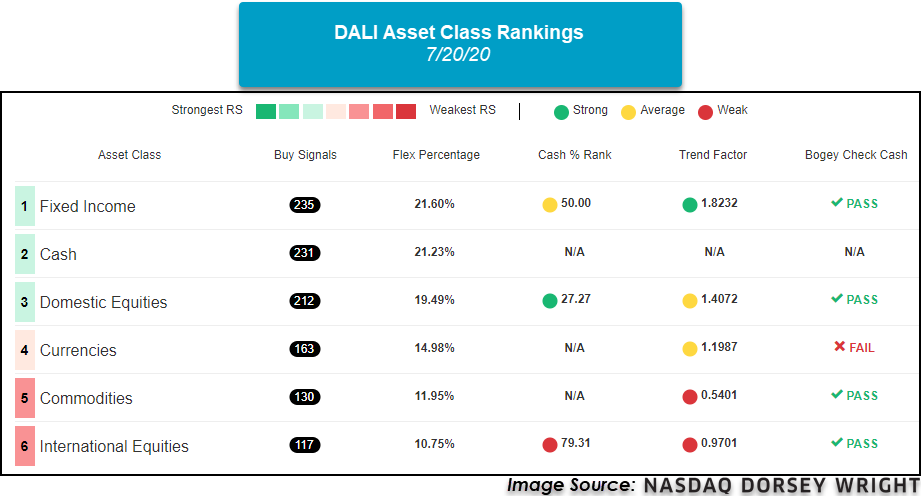
After yesterday’s market action, fixed income moved ahead of cash in our DALI rankings. Fixed income now possesses 235 buy signals compared to cash which has 231 buy signals. As a reminder, there is a buffer of five signals before some DALI strategies change, like the 3-Legged Stool strategy. Looking closer at fixed income in DALI, US preferreds & convertibles are the top sub-asset class which can be attributed to the recent run-up in equities since the COVID-19 sell-off. For those wishing to be updated on asset class changes within DALI moving forward, be sure to set alerts. You can do this on the DALI overview page by clicking on the “Set Alerts” button found in the top right of the page. From there, toggle on the “Alert for a change in the Asset Class Rank” option to receive an email when a change occurs.

(Source: etf.com)
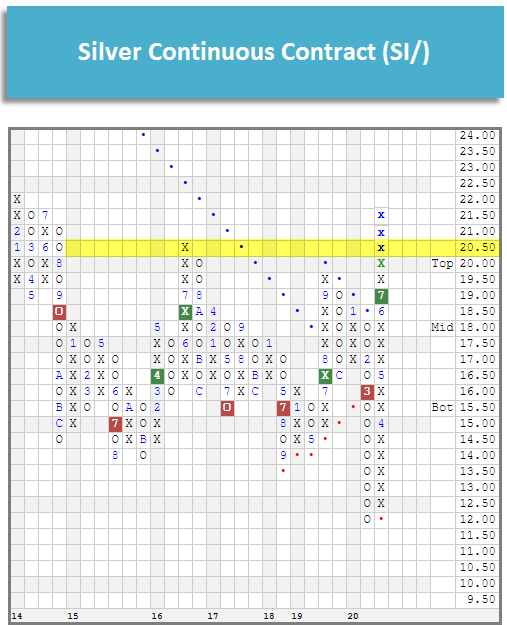
There were a couple of notable breakouts amongst commodities on Tuesday, furthering the recent uptrend for several assets in the space. There are multiple possible factors that could be contributing to this trend – low treasury yields making other stores of wealth more attractive, concerns about heightened inflation resulting from monetary and fiscal stimulus, or desire for diversification. Whatever the cause, the result has been increased demand and rising prices.
Silver
Silver SI/ reached a new multi-year high on Tuesday when it eclipsed its 2016 peak and advanced to $21.50, a level last reached in 2014. SI/ bottomed at $12 on March 24th before rallying sharply. Since that point (through 7/20), silver has gained 42.35% and returned to a positive trend in trading earlier this month. Recent flips to positive weekly and monthly momentum are additional positive signs for silver. ETFs offer us a way to can direct exposure to silver via the iShares Silver Trust SLV or indirectly via the Global X Silver Miners ETF SIL, which holds the stocks of companies engaged in silver mining.
The improvement from silver has also been displayed across funds that track the commodity, such as the iShares Silver Trust SLV. This fund is meant to provide a cost-effective way to invest in physical silver through exposure to the daily price movement in silver bullion (source: ishares.com). SLV has rallied significantly since reaching its lowest level in over a decade this past March at $11, climbing to break through its bearish resistance line while giving two consecutive buy signals, most recently occurring at $17.25 just last week. The fund has continued to move higher over the past week, culminating with an intraday gain in excess of 5% on Tuesday that takes the default chart to a new multi-year high of $19.25, its highest level since early-2014. This strength has also been displayed in the 5.61 fund score posting of SLV, which bests the average precious metals fund of 4.65 and is paired with a positive score direction of 3.59. Weekly and monthly momentum recently flipped positive, suggesting the potential for further upside from here. Those looking to add exposure towards SLV may look to wait for a pullback or normalization of the trading band, as the recent price improvement has left the fund in heavily overbought territory. Initial support is offered on the default chart at $16.

Another way to play the silver commodity is through investment in a fund of silver miners, such as the Global X Silver Miners ETF SIL. This fund has seen similar action to SLV in its descent from a February high of $33.50 to a multi-year low of $16 in March. Since that time, however, SIL has shown drastic improvement, rising to recently give three consecutive buy signals since mid-June before reaching $43 on Monday. This has led the fund to a remarkable year-to-date return of over 30% through July 20th, surpassing the 13.6% return of SI/ over the same timeframe. In a similar fashion to the silver commodity, SIL continued to move higher in trading Tuesday, notching an intraday gain of over 3.50% to print a new multi-year chart high of $45.50. The near-perfect 5.91 recent fund score posting of SIL (through 7/20) speaks to the technical strength of the fund, which is furthered by an intensely positive score direction of 5.41. Weekly momentum also recently flipped positive for SIL, indicating the potential for further price appreciation from here. While the weight of the evidence for SIL is positive, the fund has moved into heavily overbought territory so those looking to add exposure would be best served to wait for a pullback/normalization of the trading band. Initial support can be found at $38 with further support offered at $34.50, $33, and $32.
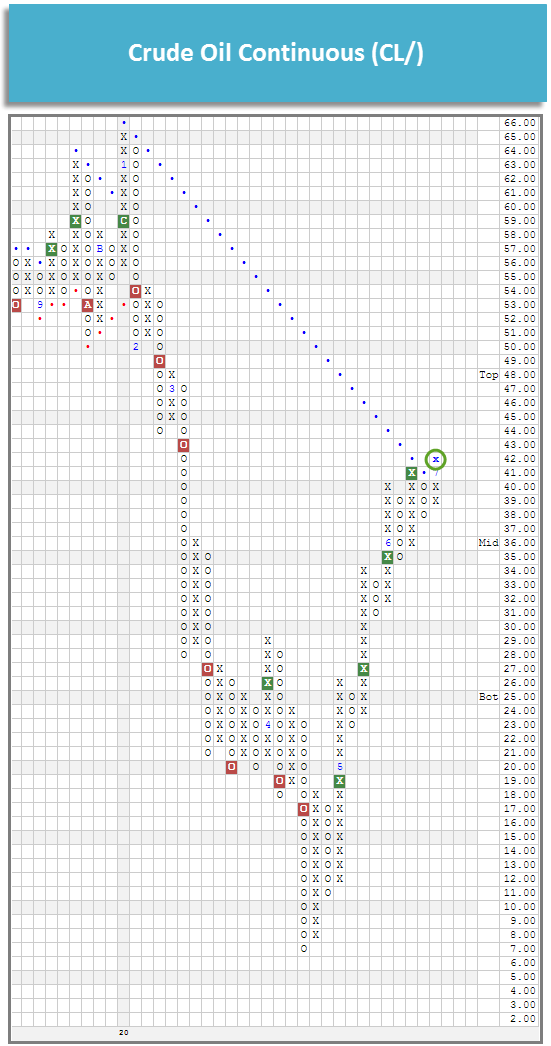
Crude Oil
Crude oil CL/ reached $42 in Tuesday’s trading, returning it to a positive overall trend for the first time since January. Saying that 2020 has been a volatile year for oil would be an understatement as it reached an all-time low and the front-month WTI crude contract actually fell below $0. With Tuesday’s action, CL/ has now given five consecutive buy signals since bottoming in April.
While the United States Oil Fund USO remains in a negative overall trend and has an unfavorable 1.70 fund score, it does have a positive 1.67 fund score direction, speaking to its improvement over the recent term. Since the bottom in April, the fund has gone from $17 to $30 on its default chart and given three consecutive buy signals in the process, most recently completing a triple top break at $29.50 in last week’s trading. USO has most recently found support at $27, with further support afforded at $25.50 and $24.50.
USO’s target portfolio can be seen below. As you can see the target portfolio currently does not have any exposure to the front-month WTI crude oil contract (August). This is an important factor to be aware of as it means that the fund’s performance may not match the performance of the front-month contract, which is most often cited when discussing the price of oil. It is also worth noting that crude currently remains in contango, meaning it has a negative roll yield, as can be seen on the CLCONTANGO chart. Having a negative roll yield or being in contango means that the price of futures contracts is higher than the (expected) spot price and the contracts “roll down” the curve toward the spot price, resulting in a negative “yield.” This is not to say that the overall return will be negative as the price return is usually a much larger factor.

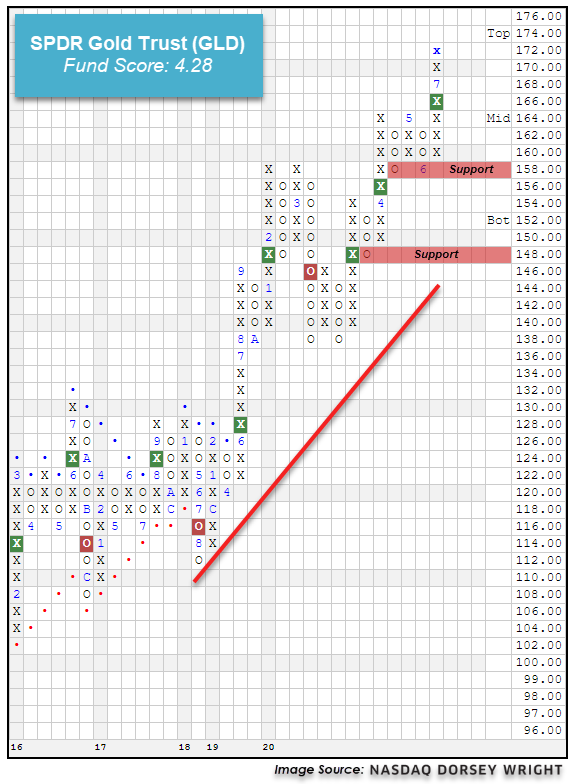
Gold
Earlier this month, gold GC/ breached the $1,800 level for the first time since 2011. In Tuesday’s trading, gold moved higher, reaching $1,840, now within striking distance of its all-time high of $1,920. Year-to-date (through 7/20) gold is up just under 20%. Similar to silver, investors can gain direct exposure to gold via the SPDR Gold Trust GLD or through the VanEck Vectors Gold Miners ETF GDX, which is composed of gold mining stocks.
Similar to silver, the continued strength from Gold Continuous has been felt across various fund representatives, such as the SPDR Gold Trust GLD. This fund seeks to track the performance of the price of gold bullion through investment in physical assets of the commodity (source: ssga.com). GLD has demonstrated notable improvement since its near-term bottom of $138 in March, rising to give three consecutive buy signals before advancing Tuesday to $172, its highest level since 2012. GLD has maintained its positive trend since June of 2019 and the fund carries a favorable 4.28 recent fund score posting. Weekly momentum also recently flipped positive, suggesting the potential for higher prices. Exposure may be considered at current levels, or on a pullback as GLD may be entering overbought territory. Initial support can be found at $158 with further support offered at $148. The bullish support line is also currently found at $144.
Gold miners have also shown notable upside participation, as shown through the VanEck Vectors Gold Miners ETF GDX. This fund continued higher off its multi-year low of $16.25 seen in March to most recently reach $41.50 in intraday trading Tuesday, marking a peak-to-trough gain of over 157%! GDX also carries a 4.76 fund score, which bests the average precious metals fund (4.65), and a strongly positive 4.06 score direction, indicative of its impressive ascent. Weekly momentum also recently flipped positive, suggesting the potential for additional price improvement. The technical picture is sound, however, those considering adding exposure should note that GDX has entered overbought territory. Initial support can be found at $37, with further support offered at $31.50.

State Street Line-Up: Three Changes
As a refresher, the State Street Sector Model monitors the relative strength relationships between each of the sector and industry ETFs in the model universe versus the S&P 500 Index... (Read more)
iShares Feature: Strength in Convertible Bonds ICVT
There are no changes to any of the iShares models this week. Convertible bonds have reached the top of the Asset Class Group Scores (ACGS) fixed-income rankings with an average group score of 4.88, the highest level it has ever reached; the group now ranks sixth out of all 135 groups in the ACGS system... (Read more)
Fund Spotlight: KraneShares MSCI One Belt One Road Index ETF OBOR
Broad Chinese equities have continued to demonstrate strength over the past week, leading to many areas outside the Chinese borders to benefit from this push higher. One such fund that seeks to capitalize on improvement from the Chinese economy without a specific focus on Chinese equities is the KraneShares MSCI One Belt One Road Index... (Read more)
Average Level
37.92
| AGG | iShares US Core Bond ETF |
| USO | United States Oil Fund |
| DIA | SPDR Dow Jones Industrial Average ETF |
| DVY | iShares Dow Jones Select Dividend Index ETF |
| DX/Y | NYCE U.S.Dollar Index Spot |
| EFA | iShares MSCI EAFE ETF |
| FXE | Invesco CurrencyShares Euro Trust |
| GLD | SPDR Gold Trust |
| GSG | iShares S&P GSCI Commodity-Indexed Trust |
| HYG | iShares iBoxx $ High Yield Corporate Bond ETF |
| ICF | iShares Cohen & Steers Realty ETF |
| IEF | iShares Barclays 7-10 Yr. Tres. Bond ETF |
| LQD | iShares iBoxx $ Investment Grade Corp. Bond ETF |
| IJH | iShares S&P 400 MidCap Index Fund |
| ONEQ | Fidelity Nasdaq Composite Index Track |
| QQQ | Invesco QQQ Trust |
| RSP | Invesco S&P 500 Equal Weight ETF |
| IWM | iShares Russell 2000 Index ETF |
| SHY | iShares Barclays 1-3 Year Tres. Bond ETF |
| IJR | iShares S&P 600 SmallCap Index Fund |
| SPY | SPDR S&P 500 Index ETF Trust |
| TLT | iShares Barclays 20+ Year Treasury Bond ETF |
| GCC | WisdomTree Continuous Commodity Index Fund |
| VOOG | Vanguard S&P 500 Growth ETF |
| VOOV | Vanguard S&P 500 Value ETF |
| EEM | iShares MSCI Emerging Markets ETF |
| XLG | Invesco S&P 500 Top 50 ETF |

| Symbol | Company | Sector | Current Price | Action Price | Target | Stop | Notes |
|---|---|---|---|---|---|---|---|
| BBY | Best Buy Co., Inc. | Retailing | $88.38 | 82 - 90 | 97 | 72 | 4 for 5'er, favored RETA sector, bullish catapult, 2.6% yield, pot. covered write |
| SIMO | Silicon Motion Technology Corporation (Taiwan) ADR | Semiconductors | $44.26 | upper 40s - lower 50s | 75 | 40 | 3 for 5'er, favored SEMI sector, multi consec buy signals,good support 3.4% yield Earnings 7/29 |
| BIG | Big Lots, Inc. | Retailing | $38.87 | hi 30s - low 40s | 66 | 32 | 3 for 5'er, #3 of 82 names in favored RETA sector matrix, pullback from multi-year high, 3%, pot. covered write |
| ABC | AmerisourceBergen Corporation | Drugs | $102.19 | mid 90s to low 100s | 122 | 81 | 4 for 5'er, favored DRUG sector, big base breakout, pullback from multi-year high, 1.7% yield. Earnings 8/5 |
| PYPL | Paypal Holdings Inc | Business Products | $178.82 | high 160s - low 180s | 200 | 138 | 4 for 5'er, top 10% of favored BUSI sector matrix, multi consec buy signals, pullback from ATH, pot. cov write, Earn. 7/29 |
| MBUU | Malibu Boats Inc. | Leisure | $53.12 | low $50s to low $60s | $71 | $44 | 5 for 5'er, LT peer RS buy signal, pos mon mom, fav DWALEIS Spread Triple Top Buy Signal |
| CHGG | Chegg Inc | Business Products | $76.94 | low-to-mid 70s | 101 | 62 | 5 for 5'er, top 10% of favored BUSI sector matrix, pullback from ATH, pos wkly mom flip, pot. cov write, Earn. 8/3 |
| MNST | Monster Beverage Corp. | Food Beverages/Soap | $73.87 | 70s | 87 | 62 | 5 for 5'er, top 20% of FOOD sector matrix, bullish triangle, pos wkly mom flip, Earn. 8/5 |
| NAV | Navistar International Corporation | Autos and Parts | $30.84 | high $20s to low $30s | $42 | $25 | 4 for 5'er, top 25% of DWAAUTO, consec buy signals, |
| Symbol | Company | Sector | Current Price | Action Price | Target | Stop | Notes |
|---|---|---|---|---|---|---|---|
| TAP | Molson Coors Company | Food Beverages/Soap | $35.00 | mid 30s | $22 | $41 | 0 for 5'er, consec sell signals, spread triple bottom, LT market RS sell signal, bottom of DWAFOOD Earnings 7/30 |
| Comment |
|---|
| CIEN CIENA Corporation R ($54.89) - Telephone - Raise stop to $45, which would violate multiple levels of support on the default chart. |
NAV Navistar International Corporation R ($30.89) - Autos and Parts - NAV is a solid 4 for 5’er that ranks within the top quartile of the favored autos and parts sector RS matrix. Additionally, NAV has given a total of eight consecutive buy signals since March, confirming that demand is in control of the stock. NAV also has experienced two weeks of positive weekly momentum, suggesting the potential for higher prices. Overall, demand is in control and the technical weight of the evidence is positive. Okay to initiate new long positions in the upper $20s to low $30s. We will use $25 as our initial stop loss, which would mark the first sell signal on the chart. We will use a modified bullish price objective of $42 as our near-term price target.
| 19 | 20 | ||||||||||||||||||||||||||||||||||||||||||||||||||||
| 44.00 | X | • | • | 44.00 | |||||||||||||||||||||||||||||||||||||||||||||||||
| 43.00 | X | X | O | X | • | 43.00 | |||||||||||||||||||||||||||||||||||||||||||||||
| 42.00 | X | O | 7 | O | X | O | • | 42.00 | |||||||||||||||||||||||||||||||||||||||||||||
| 41.00 | 6 | O | X | 8 | X | O | • | 41.00 | |||||||||||||||||||||||||||||||||||||||||||||
| 40.00 | X | O | X | 9 | X | O | • | 40.00 | |||||||||||||||||||||||||||||||||||||||||||||
| 39.00 | X | O | O | X | O | • | 3 | • | 39.00 | ||||||||||||||||||||||||||||||||||||||||||||
| 38.00 | X | O | X | A | • | X | O | 2 | • | 38.00 | |||||||||||||||||||||||||||||||||||||||||||
| 37.00 | X | O | X | O | X | • | X | O | X | O | • | 37.00 | |||||||||||||||||||||||||||||||||||||||||
| 36.00 | X | • | O | O | X | O | • | X | O | • | X | O | • | 36.00 | |||||||||||||||||||||||||||||||||||||||
| 35.00 | X | • | O | X | O | X | • | X | O | X | X | • | • | X | 3 | • | 35.00 | ||||||||||||||||||||||||||||||||||||
| 34.00 | • | O | O | B | O | X | O | 4 | O | X | 6 | O | • | X | • | X | O | • | Top | 34.00 | |||||||||||||||||||||||||||||||||
| 33.00 | O | X | O | C | 2 | O | X | O | X | O | X | O | • | B | O | X | O | • | 33.00 | ||||||||||||||||||||||||||||||||||
| 32.00 | O | X | O | X | O | X | O | X | 5 | X | O | X | 7 | X | O | X | O | • | 32.00 | ||||||||||||||||||||||||||||||||||
| 31.00 | O | X | O | X | O | X | O | O | X | O | O | X | X | O | X | O | • | X | 31.00 | ||||||||||||||||||||||||||||||||||
| 30.00 | O | O | X | O | X | O | X | • | 8 | X | O | X | C | X | O | • | X | 30.00 | |||||||||||||||||||||||||||||||||||
| 29.00 | O | O | X | O | • | O | X | O | X | O | X | O | • | X | 7 | 29.00 | |||||||||||||||||||||||||||||||||||||
| 28.00 | O | X | X | • | O | X | O | X | 1 | X | O | • | X | O | X | 28.00 | |||||||||||||||||||||||||||||||||||||
| 27.00 | O | X | O | 1 | • | O | X | A | X | O | X | O | • | X | X | O | X | Mid | 27.00 | ||||||||||||||||||||||||||||||||||
| 26.00 | O | X | O | X | • | O | X | O | O | X | O | • | X | O | X | O | 26.00 | ||||||||||||||||||||||||||||||||||||
| 25.00 | O | X | O | X | • | O | 9 | O | X | O | • | X | X | O | X | 25.00 | |||||||||||||||||||||||||||||||||||||
| 24.00 | O | O | • | O | X | • | O | • | O | • | X | O | X | 6 | 24.00 | ||||||||||||||||||||||||||||||||||||||
| 23.00 | • | O | X | • | • | O | • | X | O | X | • | 23.00 | |||||||||||||||||||||||||||||||||||||||||
| 22.00 | O | • | O | • | X | 5 | • | 22.00 | |||||||||||||||||||||||||||||||||||||||||||||
| 21.00 | • | O | X | X | • | 21.00 | |||||||||||||||||||||||||||||||||||||||||||||||
| 20.00 | O | X | X | O | X | X | X | • | 20.00 | ||||||||||||||||||||||||||||||||||||||||||||
| 19.50 | O | X | O | X | O | X | X | O | X | X | O | X | • | 19.50 | |||||||||||||||||||||||||||||||||||||||
| 19.00 | O | X | X | O | X | O | X | O | X | O | X | O | X | O | X | • | Bot | 19.00 | |||||||||||||||||||||||||||||||||||
| 18.50 | O | X | O | X | O | X | O | X | O | X | O | X | O | X | O | • | 18.50 | ||||||||||||||||||||||||||||||||||||
| 18.00 | O | X | O | X | O | X | O | X | O | X | O | O | • | • | 18.00 | ||||||||||||||||||||||||||||||||||||||
| 17.50 | O | X | O | X | O | X | O | X | O | • | • | 17.50 | |||||||||||||||||||||||||||||||||||||||||
| 17.00 | O | X | O | X | O | X | O | X | X | • | 17.00 | ||||||||||||||||||||||||||||||||||||||||||
| 16.50 | O | O | X | O | X | O | X | O | X | • | 16.50 | ||||||||||||||||||||||||||||||||||||||||||
| 16.00 | O | O | X | 4 | X | O | X | • | 16.00 | ||||||||||||||||||||||||||||||||||||||||||||
| 15.50 | O | O | O | • | 15.50 | ||||||||||||||||||||||||||||||||||||||||||||||||
| 19 | 20 |
| BIP Brookfield Infrastructure Partners L.P. ($43.85) - Utilities/Electricity - BIP broke a double top at $44 on Tuesday, marking the sixth consecutive buy signal on the chart. BIP is a perfect 5 for 5’er that has maintained a market RS buy signal since November 2010. In addition, weekly momentum has been positive for two weeks, suggesting the potential for higher prices. From here, initial support sits at $39. Earnings are expected 8/5. |
| CC The Chemours Company ($16.73) - Chemicals - CC completed a bullish triangle pattern on Tuesday with a double top breakout at $17. This stock is a 3 for 5’er that has given four consecutive buy signals, confirming that demand is in control. Monthly momentum has been positive for two months and CC expects earnings on 7/30. From here, initial support sits at $14.50. Note CC offers a yield of 6.23%. |
| DNKN Dunkin Brands Group Inc ($68.31) - Restaurants - DNKN returned to a buy signal on Tuesday with a double top buy signal at $68. This stock is a 4 for 5’er that has maintained a market RS buy signal since September 2018. Weekly and monthly momentum just flipped positive, suggesting the potential for higher prices. The weight of the evidence is positive. From here, initial support sits at $64. Note earnings are expected 7/30. |
| ELY Callaway Golf Company ($18.70) - Leisure - Shares of ELY advanced on Tuesday to break a spread triple top at $18.50, resulting in a sixth consecutive buy signal. The 4 for 5'er ranks in the top quartile of the favored leisure stock sector matrix and reentered a positive trend in May of this year, demonstrating relative and absolute strength, respectively. In addition, ELY recently experienced a flip to positive monthly momentum, suggesting the potential for additional upside. Demand is in control. The next level of resistance resides at $19.50 while initial support is offered at $16.50. Note earnings are expected on August 6th. |
| FIS Fidelity National Information Services, ($143.69) - Finance - FIS advanced on Tuesday to break a triple top at $144, returning the stock to a buy signal. The 4 for 5'er recently reentered a positive trend in April and demonstrates positive long-term relative strength versus the market, remaining on an RS buy signal since February of 2014. FIS also recently experienced a flip to positive weekly momentum, suggesting the potential for additional upside. The weight of the evidence is positive here and the stock is actionable at current levels. The next level of resistance resides at $150 while initial support is offered at $130. Note earnings are expected on August 4th. |
| HZO Marinemax ($26.08) - Leisure - HZO broke a double top at $26 and is now testing a high watermark last seen in November 2018. This stock is a 5 for 5’er that ranks 4th out of 48 stocks in the favored leisure sector. Monthly momentum has been positive for three months, suggesting the potential for higher prices. Demand is in control as the chart has now given four consecutive buy signals. From here, support sits at $22. Earnings are expected 7/23. |
| IPHI Inphi Corp ($124.49) - Semiconductors - Shares of IPHI advanced on Tuesday, completing a bullish triangle with a break at $128 to give a second consecutive buy signal. The 5 for 5'er ranks in the top third of the favored semiconductors stock sector matrix and demonstrates positive long-term relative strength versus the market, remaining an an RS buy signal for over one year now. In addition, IPHI reentered a positive trend in April and recently experienced a flip to positive weekly momentum, suggesting the potential for additional upside. Demand is in control. The next level of resistance resides at $132 while initial support is offered at $120. Note earnings are expected on July 30th. |
| LAD Lithia Motors Inc-Cl A ($175.93) - Autos and Parts - LAD broke a double top $178 on Tuesday and is now trading at a new all-time high. This stock has now given a total of seven consecutive buy signals, confirming that demand is in control. LAD is a perfect 5 for 5’er that ranks 3rd out of 51 names in the favored autos and parts sector RS Matrix. Also, monthly momentum just flipped positive, suggesting the potential for higher prices. From here, initial support sits at $168. |
| MBUU Malibu Boats Inc. ($57.57) - Leisure - MBUU broke a spread triple top at $57 and is now just two points away from matching its all-time high from September 2018 at $59. This stock is a 5 for 5’er that has given two consecutive buy signals. Monthly momentum has been positive for three months and MBUU is trading in a positive trend. The weight of the evidence is positive. From here, initial support sits at $50. |
| NEM Newmont Corp ($64.66) - Precious Metals - NEM broke a double top at $65, the second consecutive buy signal on the chart. This stock is a 3 for 5’er that is trading in a positive trend. Additionally, NEM has maintained a long-term market RS buy signal since February 2016 and has experienced three weeks of positive weekly momentum. From here, initial support sits at $60. Note NEM offers a yield of 1.56%. |
| Name | Option Symbol | Action | Stop Loss |
|---|---|---|---|
| Best Buy Co., Inc. - $90.28 | BBY2016J85 | Buy the October 85.00 calls at 10.15 | 84.00 |
| Name | Option | Action |
|---|---|---|
| Home Depot, Inc. ( HD) | Sep. 250.00 Calls | Raise the option stop loss to 16.65 (CP: 18.65) |
| Monster Beverage Corp. ( MNST) | Sep. 65.00 Calls | Raise the option stop loss to 8.50 (CP: 10.50) |
| Lowe's Companies, Inc. ( LOW) | Sep. 130.00 Calls | Raise the option stop loss to 15.40 (CP: 17.40) |
| Lowe's Companies, Inc. ( LOW) | Oct. 130.00 Calls | Raise the option stop loss to 16.50 (CP: 18.50) |
| Monster Beverage Corp. ( MNST) | Dec. 70.00 Calls | Raise the option stop loss to 6.70 (CP: 8.70) |
| Name | Option Symbol | Action | Stop Loss |
|---|---|---|---|
| Tyson Foods, Inc. - $60.58 | TSN2016V65 | Buy the October 65.00 puts at 7.35 | 66.00 |
| Name | Option | Action |
|---|---|---|
| Western Digital Corporation (WDC) | Oct. 50.00 Puts | Stopped at 8.00 (CP: 7.85) |
| Ross Stores, Inc. (ROST) | Nov. 90.00 Puts | Stopped at 88.00 (CP: 86.79) |
| Name | Option Sym. | Call to Sell | Call Price | Investment for 500 Shares | Annual Called Rtn. | Annual Static Rtn. | Downside Protection |
|---|---|---|---|---|---|---|---|
| L Brands Inc. $18.28 | LB2020K20 | Nov. 20.00 | 2.82 | $8,108.20 | 66.33% | 48.03% | 13.83% |
| Name | Action |
|---|---|
| Micron Technology, Inc. (MU) - 51.21 | Sell the October 50.00 Calls. |
| Bank of America (BAC) - 23.58 | Sell the November 25.00 Calls. |
| Applied Materials, Inc. (AMAT) - 63.73 | Sell the October 65.00 Calls. |
| Chegg Inc (CHGG) - 76.94 | Sell the October 75.00 Calls. |
| Big Lots, Inc. (BIG) - 38.87 | Sell the October 42.50 Calls. |
| Best Buy Co., Inc. (BBY) - 88.38 | Sell the September 90.00 Calls. |
| Wendy's Company (WEN) - 22.28 | Sell the October 23.00 Calls. |
| Fifth Third Bancorp (FITB) - 18.45 | Sell the November 19.00 Calls. |
| Chegg Inc (CHGG) - 76.94 | Sell the October 75.00 Calls. |
| Wendy's Company (WEN) - 22.28 | Sell the November 23.00 Calls. |
| Name | Covered Write |
|---|---|
| eBay Inc. ( EBAY - 58.47 ) | September 60.00 covered write. |
Daily Equity & Market Analysis
Loading, Please Wait...
