State Street Focus Fund
Published: July 15, 2020
This content is for informational purposes only. This should not be construed as solicitation. The general public should consult their financial advisor for additional information related to investment decisions.
Today there are three changes to the State Street Sector Model [SSTREET]: Sell XLE, Sell KRE, Sell, KBE

 State Street Sector ETF Model SSTREET: Three Changes

  1. SELL - XLE - Energy Select Sector SPDR Fund
  2. SELL - KBE - SPDR S&P Bank ETF
  3. SELL - KRE - SPDR S&P Regional Banking ETF

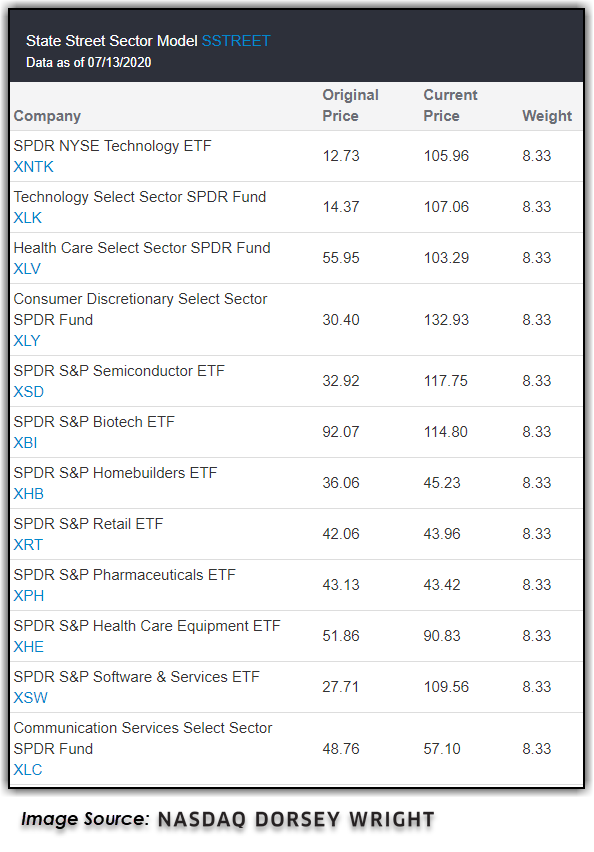
As a refresher, the State Street Sector Model monitors the relative strength relationships between each of the sector and industry ETFs in the model universe versus the S&P 500 Index SPX on a 6.5% scale. ETFs that are showing positive relative strength versus SPX (measured by a column of X's) are included in the model and get removed when that relationship reverses into O's. Over the past week of trading, the respective RS charts comparing the Energy Select Sector SPDR Fund XLE, the SPDR S&P Bank ETF KBE, and the SPDR S&P Regional Banking ETF KRE versus the S&P 500 Index reversed down into O's, warranting all three funds' removal from the SSTREET model holdings. This model remains fully invested through sector-based ETFs within the broader State Street family of ETFs and gets evaluated every week. The number of holdings can vary based on sector leadership within changing markets, and with the removal of XLE, KRE, and KBE, equally-weights 12 positions at 8.33% each. Year-to-date, the SSTREET model is up 0.89%, outperforming the S&P 500's return of -1.03% (through 7/14).


Back to report

DISCLOSURE

**Unless otherwise stated, the performance numbers herein are based on price returns and do not include dividends or all transaction costs. Past performance is not indicative of future results. Potential for profits is accompanied by possibility of loss. StateStreet Global Advisors (SsgA) has arranged with Dorsey Wright to provide this specialized ETF page on SsgA sponsored products. The Point & Figure analysis, models and resulting rankings, including any information, data or commentary included herein (the “ETF Data”), are created and provided solely by Dorsey, Wright & Associates. Such ETF Data should not be considered an offer to purchase or sell, or a solicitation of an offer to buy or purchase any security. ETF Data and other materials appearing on this website are believed to be obtained from reliable sources, but neither SsgA nor Dorsey Wright can guarantee and are not responsible for their accuracy, timeliness, completeness, or suitability for use. The examples presented do not take into consideration commissions, tax implications, or other transactions costs. Neither Dorsey, Wright nor SsgA through this ETF page provide investment, legal or tax advice or recommendations regarding any security, fund or market. As the investment professional making the final decision with respect to allocations, including any related suitability, fiduciary or other legal obligation, please remember to adhere to all applicable laws, regulations, and rules including NASD Rules 2090 and 2111. You alone will bear the sole responsibility of evaluating the merits and risks associated with the use of ETF Data before making any decisions based on the ETF Data. You agree not to hold SsgA or Dorsey, Wright liable for any possible claim for damages arising from any decision you make based on the ETF Data. The percentage of the portfolio devoted to any ETF is at the sole discretion of the financial advisor or the customer, and not Dorsey, Wright & Associates or SsgA. If you are not familiar with the Point & Figure methodology, we suggest you read “Point & Figure Charting, 4th Edition” by Thomas J. Dorsey and visit the PnF University at www.dorseywright.com. If you are not familiar with the SsgA products, or Exchange Traded Funds (ETFs), we suggest you visit www.ssgafunds.com.