
Most Requested Symbols

We review the performance trends for the broad domestic ETF universe for Q2 2020.
We review the best and worst-performing ETFs within international equities during the second quarter of 2020
Today's featured stock is Hologic Incorporated (HOLX).
AMGN, APPF, AYX, MDGL, NOW, TWLO, SCS, CROX, TTD, & RARE
Call: Microchip Technology (MCHP), Put: Waters (WAT), Covered Write: Activision Blizzard (ATVI)
Market Update Webinar Replay - Missed Monday's webcast? Click the link below for a recap:
Market Fact: Since 1987, the 1st of July has produced positive returns for the S&P 500 Index SPX approximately 85% of the time (including today's positive return). This is the best rate of success relative to all 11 other months.
Q2 2020 Performance Update: With the end of Tuesday’s trading session, we closed out Q2 2020. As we do each quarter, we wanted to take this opportunity to summarize the performance of various asset classes using ETF proxies.
The second quarter of 2020 diverged sharply from the prior quarter, with all broad asset classes except currencies advancing. Fixed income remains, far and away, the broad asset class leader on the year after notching additional gains on the quarter. However, equities grabbed headlines over the past three months as both domestic and international asset class fund constituents contributed strong double-digit gains on average. In fact, the S&P 500 Index and in consequence, the SPDR S&P 500 ETF Trust SPY, posted its best quarterly gain since 1998. Despite the recent turnaround across risk assets including equities and to a lesser extent, commodities, all three asset classes remain in the red on the year.

The returns above are price returns and do not include dividends or all potential transaction costs. Past performance is not indicative of future results. Potential for profits is accompanied by possibility of loss. MNYMKT is internally maintained and calculated by Dorsey Wright and represents the performance of the 13 week T-bill. DWA6040 is internally maintained and calculated by Dorsey Wright and represents a 60/40 split between SPX and BND, rebalanced daily.

Each week the analysts at DWA review and comment on all major asset classes in the global markets. Shown below is the summary or snapshot of the primary technical indicators we follow for multiple areas. Should there be changes mid-week we will certainly bring these to your attention via the report.
| Universe | BP Col & Level (actual) | BP Rev Level | PT Col & Level (actual) | PT Rev Level | HiLo Col & Level (actual) | HiLo Rev Level | 10 Week Col & Level (actual) | 10 Week Rev Level | 30 Week Col & Level (actual) | 30 Week Rev Level |
|---|---|---|---|---|---|---|---|---|---|---|
| ALL |
|
56% |
|
40% |
|
84% |
|
62% |
|
34% |
| NYSE |
|
58% |
|
50% |
|
90% |
|
62% |
|
30% |
| OTC |
|
56% |
|
38% |
|
84% |
|
62% |
|
40% |
| World |
|
54% |
|
38% |
|
|
|
68% |
|
40% |
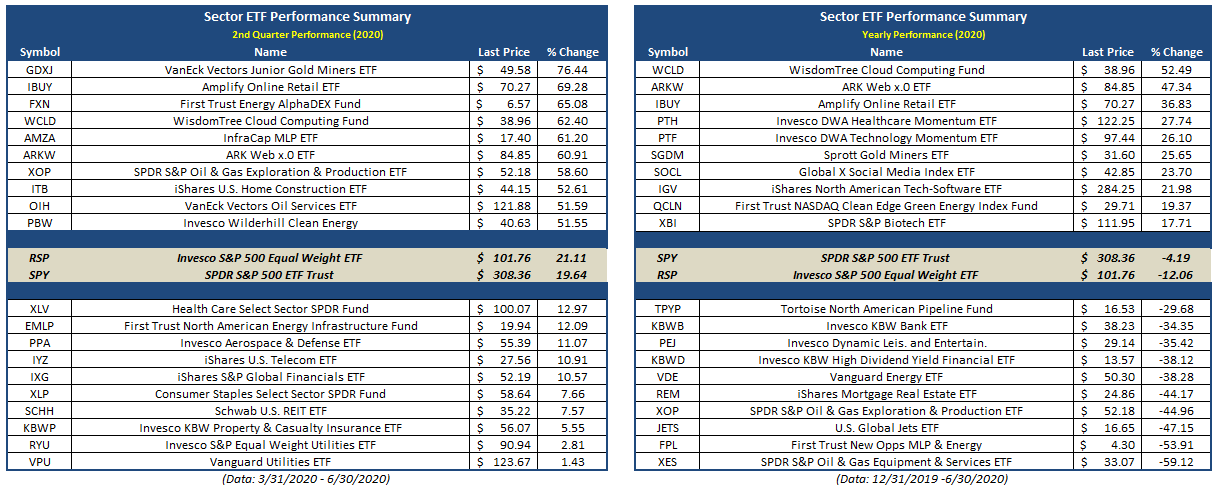
With the second quarter coming to a close earlier this week today we will review some of the best and worst performing ETFs last quarter as well as over the previous six months. Starting with Q2 2020 performance, the VanEck Vectors Junior Gold Minors ETF GDXJ takes the prize as the best performing ETF in Q2 (excluding leveraged and inverse) with a return of 76%. Other notable names at the top of the list include a few from ARK like Genomic Revolution ARKG, Innovation ARKK, and Web x.0 ARKW all produced gains in excess of 60% for the quarter. Some of the other themes among the top performing names in the second quarter were energy, technology, and biotech. One the other hand, those ETFs at the bottom of the list were mostly fixed income related ETFs while the United State Oil Fund USO continued it’s volatile ways ultimately posting a return of -16.69% for the second quarter.
On a year-to-date basis, many of the themes we saw in the second quarter performance have been consistent with performance this year, overall. The ARK Genomic Revolution ETF ARKG is the best performer on the year with a return of 55.61% followed by a number of other thematic growth ETFs like the aforementioned ARK products, cloud computing, internet and software. Interestingly, China Internet KWEB also made an appearance in the top ten along with a couple long-term US Treasury ETFs. Not too surprisingly, USO is the worst performing ETF on the year drop more than 72% thru the end of June while the US Global JETS ETF JETS is down more than 47%.

Unless otherwise stated (or denoted by “.TR”), performance returns for equities, ETFs, indexes do not reflect dividends and are based on the last sale for the date requested. Returns do not reflect all potential transaction costs. Past performance is not indicative of future results. Potential for profits is accompanied by possibility of loss.
From a sector perspective Junior Gold Miners GDXJ was at the top on the list followed by Online Retail IBUY, First Trust Energy FXN, Cloud Computing WCLD, MLPs AMZA, and ARK Web x.0 ARKW all of which were up more than 60% in the second quarter. Utilities and insurance ETFs were among the laggards in the second quarter as the Vanguard Utilities ETF VPU was only up 1.43% while the S&P 500 ETF SPY was up nearly 20%.
Thematic technology ETFs remain a top of the list of best performers for the year as well as Healthcare Momentum PXH and Technology Momentum PTF which are up 28% and 26% respectively. On the other hand, it’s not too surprising to see a number of energy-related ETFs within the bottom performers as well as the JETS ETF and Leisure/Entertainment PEJ.
Unless otherwise stated (or denoted by “.TR”), performance returns for equities, ETFs, indexes do not reflect dividends and are based on the last sale for the date requested. Returns do not reflect all potential transaction costs. Past performance is not indicative of future results. Potential for profits is accompanied by possibility of loss.

| Symbol | Name | Price | Yield | PnF Trend | RS Signal | RS Col. | Fund Score | 200 Day MA | Weekly Mom |
|---|---|---|---|---|---|---|---|---|---|
| DIA | SPDR Dow Jones Industrial Average ETF Trust | 257.87 | 2.32 | Positive | X | 3.03 | 262.82 | -1W | |
| EEM | iShares MSCI Emerging Markets ETF | 39.99 | 2.23 | Positive | Sell | O | 2.13 | 40.52 | +12W |
| EFA | iShares MSCI EAFE ETF | 60.87 | 2.68 | Positive | Sell | O | 1.19 | 63.09 | +12W |
| FM | iShares MSCI Frontier 100 ETF | 24.20 | 3.28 | Negative | Sell | O | 0.41 | 26.59 | +12W |
| IJH | iShares S&P MidCap 400 Index Fund | 177.82 | 1.81 | Positive | Buy | O | 2.19 | 184.03 | -1W |
| IJR | iShares S&P SmallCap 600 Index Fund | 68.29 | 1.73 | Positive | Buy | O | 1.87 | 73.07 | +12W |
| QQQ | Invesco QQQ Trust | 247.60 | 0.67 | Positive | Buy | X | 5.87 | 210.77 | -2W |
| RSP | Invesco S&P 500 Equal Weight ETF | 101.76 | 2.11 | Positive | Buy | X | 3.38 | 104.84 | -1W |
| SPY | SPDR S&P 500 ETF Trust | 308.36 | 1.86 | Positive | O | 3.80 | 301.71 | -1W | |
| XLG | Invesco S&P 500 Top 50 ETF | 237.90 | 1.53 | Positive | O | 5.55 | 223.14 | -2W |
As we continue our customary Q2 2020 update, today, we will delve into ETF performance trends from last quarter within the broad domestic equity category. We used the Security Screener to whittle down this list to about half of the constituents within the group to achieve diverse representation while avoiding any significant overlap between similar funds. We also excluded leveraged and inverse funds and used a $100 million AUM along with a volume filter to make sure that we covered the most widely traded ETFs. See the commentary below the table.

SECTOR BULLISH PERCENT CHANGES
| Reversed to X | Reversed to O |
|---|---|
| 1 (BPPREC | 58), |
10 (BPBUIL | 58), (BPDRUG | 50), (BPFINA | 50), (BPFORE | 46), (BPHEAL | 42), (BPINET | 60), (BPMEDI | 54), (BPMETA | 50), (BPSOFT | 64), (BPTELE | 48), |
| To Xs | To Os |
|---|---|
| None | Biomedics/Genetics ( 0.17 to 52 ) |
Average Level
49.47
| Sector |
|---|
| None |
| Sector |
|---|
| None |
| Sector |
|---|
| Autos & Parts (54%) - Bear Alert |
| Building (58%) - Bear Confirmed |
| Business Products (56%) - Bear Alert |
| Drugs (50%) - Bull Correction |
| Electronics (54%) - Bear Alert |
| Finance (50%) - Bull Correction |
| Household Goods (64%) - Bear Alert |
| Internet (60%) - Bull Correction |
| Machinery and Tools (54%) - Bear Alert |
| Media (54%) - Bull Correction |
| Metals Non Ferrous (50%) - Bull Correction |
| Protection Safety Eq (56%) - Bear Alert |
| Real Estate (54%) - Bear Alert |
| Retailing (52%) - Bull Correction |
| Semiconductors (70%) - Bull Confirmed |
| Software (64%) - Bear Alert |
| Transports / Non Air (50%) - Bull Correction |
| Wall Street (66%) - Bear Alert |
SECTOR INDICATOR CHART CHANGES
PT is the percentage of stocks within a sector that are trading above their bullish support lines. RSX is the percentage of stocks within a sector whose relative strength charts are in a column of Xs. RSP is the percentage of stocks within a sector whose relative strength charts are on a buy signal. The strongest sectors, i.e. market leaders, will have most of these indicators positive and moving higher in a column of Xs.
|
There were mostly falling sector PT charts this week, with 7 falling and 1 rising. The following sector chart rose: Precious Metals [^PTPREC]. The following sector charts fell: Aerospace Airline [^PTAERO]-Rev. , Banks [^PTBANK]-Rev. , Forest Prods/Paper [^PTFORE]-Rev. , Gaming [^PTGAME]-Rev. , Gas Utilities [^PTGUTI], Restaurants [^PTREST]-Rev. , Textiles/Apparel [^PTTEXT]-Rev. . There were 6 that reversed to O. |
|
| ^PT Charts Reversing Up - | ^PT Charts Reversing Down - |
|
|
|
| ^PT Charts Moving Higher - | ^PT Charts Moving Lower - |
|
|
|
There were mostly falling sector RSX charts this week, with 13 falling and 7 rising. The following sector charts rose: Biomedics/Genetics [^RSXBIOM], Building [^RSXBUIL], Computers [^RSXCOMP], Drugs [^RSXDRUG], Internet [^RSXINET], Precious Metals [^RSXPREC], Software [^RSXSOFT]-Rev. . The following sector charts fell: Aerospace Airline [^RSXAERO], Chemicals [^RSXCHEM]-Rev. , Forest Prods/Paper [^RSXFORE], Gaming [^RSXGAME]-Rev. , Gas Utilities [^RSXGUTI], Leisure [^RSXLEIS], Media [^RSXMEDI]-Rev. , Metals Non Ferrous [^RSXMETA], Oil [^RSXOIL], Oil Service [^RSXOILS], Real Estate [^RSXREAL], Restaurants [^RSXREST], Textiles/Apparel [^RSXTEXT]. There were 0 that moved to buy signals and 3 that moved to sell signals. The following were buy signals: . The following were sell signals: Gaming [^RSXGAME],Gas Utilities [^RSXGUTI],Metals Non Ferrous [^RSXMETA]. |
|
| ^RSX Charts Reversing Up - | ^RSX Charts Reversing Down - |
|
|
| ^RSX Charts Moving Higher - | ^RSX Charts Moving Lower - |
|
|
|
There were only rising sector RSP charts this week, with 8 rising and none moving lower. The following sector charts rose: Building [^RSPBUIL], Electronics [^RSPELEC], Household Goods [^RSPHOUS], Metals Non Ferrous [^RSPMETA], Steel/Iron [^RSPSTEE], Textiles/Apparel [^RSPTEXT], Wall Street [^RSPWALL], Waste Management [^RSPWAST]. No charts reversed in column. |
|
| ^RSP Charts Reversing Up - | ^RSP Charts Reversing Down - |
|
|
|
| ^RSP Charts Moving Higher - | ^RSP Charts Moving Lower - |
|
|
|
FAVORED SECTOR STATUS CHANGES
A sector is considered to be Favored if it has 3 or 4 of the sector indicators (Relative Strength, RSX, RSP, & PT) positive, Average if it has 2 of the 4 indicators positive, & Unfavored if it has 0 or 1 of the indicators positive. The table below contains those sectors that have experienced a Favored Sector Status change over the past week. It is best to focus on sectors that are about 50% or lower on their Bullish Percent charts & are in Xs. Note: If a sector moves from Favored to Average, it doesn't necessarily mean that the sector in question has to be sold - it just means you need to evaluate your individual positions with exposure to that sector.
| Changes since 06/24/2020 | Full Report |
|
|
|
|
|||||||||||
|
|
|
|
|
|
|||||||||
|
|
|
|
|
|
|||||||||
|
|
|
|
|
|
|||||||||

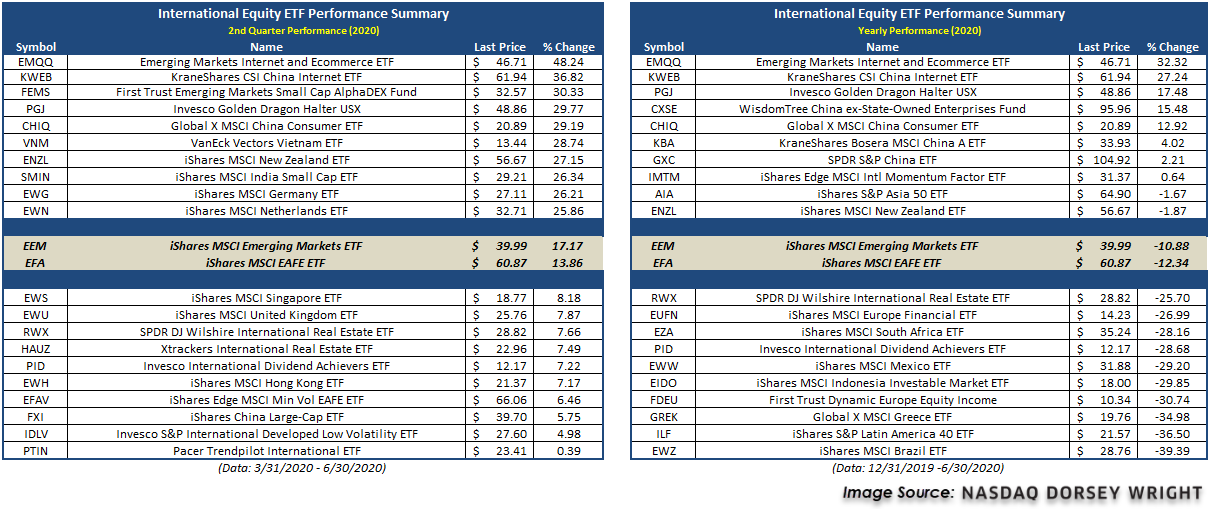
The second quarter of 2020 saw most global equity markets rally significantly after a dreadful first quarter, with international equities showing notable improvement across the board. The broad iShares MSCI Emerging Markets ETF EEM and iShares MSCI EAFE ETF EFA each posted double-digit returns over the past three months, gaining 17.17% and 13.86%, respectively. Furthermore, each international equity fund in our examination was in the black in Q2, a sharp turnaround from the first quarter that saw no international equity representatives post positive returns. China continues to lead the way for most foreign equity markets, with additional participation coming from other countries in Asia. We have highlighted some noteworthy observations from our quarterly performance review below, looking first at the best/worst performers over the past three months, followed by an update on where we sit on a year-to-date basis.
Second Quarter Returns
Year-to-date Returns
As we do each quarter, we review the performance of the fixed income ETF universe. The rankings of best- and worst-performing ETFs is below, followed by commentary.

Remember, these are technical comments only. Just as you must be aware of fundamental data for the stocks we recommend based on technical criteria in the report, so too must you be aware of important data regarding delivery, market moving government releases, and other factors that may influence commodity pricing. We try to limit our technical comments to the most actively traded contracts in advance of delivery, but some contracts trade actively right up to delivery while others taper off well in advance. Be sure you check your dates before trading these contracts. For questions regarding this section or additional coverage of commodities email james.west@dorseywright.com.
Data represented in the table below is through 06/30/2020:
Broad Market Commodities Report
| Symbol | Name | Price | PnF Trend | RS Signal | RS Col. | 200 Day MA | Weekly Mom |
|---|---|---|---|---|---|---|---|
| CL/ | Crude Oil Continuous | 39.39 | Negative | Buy | X | 44.75 | +10W |
| DBLCIX | Deutsche Bank Liquid Commodities Index | 256.79 | Negative | Sell | O | 286.16 | +12W |
| DWACOMMOD | DWA Continuous Commodity Index | 452.20 | Negative | Buy | O | 459.93 | -1W |
| GC/ | Gold Continuous | 1798.80 | Positive | Buy | X | 1594.71 | +1W |
| HG/ | Copper Continuous | 2.71 | Negative | Buy | O | 2.56 | +11W |
| ZG/ | Corn (Electronic Day Session) Continuous | 338.00 | Negative | Buy | O | 359.95 | +9W |
Q2 of 2020 was generally constructive for the broader commodity space, as the WisdomTree Continuous Commodity Index Fund GCC, a general asset class proxy, returned 7.89%. Despite this above-average showing, the fund remains steeply in the red with a year-to-date return of -17.03% as of June 30th. As is the case with all broad asset classes, there were leaders and laggards that told unique stories of strength and weakness within the commodity space. Downstream commodity funds within the oil and gasoline space were among some of the best performing investments during the last quarter, led by the United States Gasoline Fund LP UGA, which returned a whopping 87.25%. Silver commodity funds and gold/silver mining-related ETFs also outperformed the broader asset class during this timeframe, including investments such as the US Global GO Gold & Precious Metal Miners ETF GOAU and the iShares Silver Trust SLV. On the lagging end, agricultural commodities littered the bottom of the quarterly-performance rankings, although the United States Natural Gas Fund LP UNG and the Aberdeen Standard Physical Palladium Shares ETF PALL were the two worst-performing ETFs on the quarter. One interesting observation was the divergence between the United States Oil Fund USO, which shed -16.69% in Q2 and the United States 12 Month Oil Fund USL, which returned 20.13% in the same period. This is a perfect example to reiterate why it is important to know exactly what you own when trading commodities-based investment products, as USO was a front-month heavy product up until the middle of Q2 when it changed its underlying holding structure. USL on the other hand maintains 12-month forward contract exposure, which has had much less volatility in the near-term.

Broadly speaking, foreign currencies benefited from a weakening dollar during Q2 of 2020. The Wisdomtree Bloomberg United States Dollar Bullish USDU fell -2.41% during the timeframe, although the fund remains in the black on the year with a YTD return of 3.48%. On the opposite end of the reserve currency spectrum, the Euro strengthened significantly against the dollar during Q2, as evidenced by the iPath EUR/USD Exchange Rate ETN EROTF returning 30%.

The returns above are price returns and do not include dividends or all potential transaction costs. Past performance is not indicative of future results. Potential for profits is accompanied by possibility of loss.
Average Level
26.58
| AGG | iShares US Core Bond ETF |
| USO | United States Oil Fund |
| DIA | SPDR Dow Jones Industrial Average ETF |
| DVY | iShares Dow Jones Select Dividend Index ETF |
| DX/Y | NYCE U.S.Dollar Index Spot |
| EFA | iShares MSCI EAFE ETF |
| FXE | Invesco CurrencyShares Euro Trust |
| GLD | SPDR Gold Trust |
| GSG | iShares S&P GSCI Commodity-Indexed Trust |
| HYG | iShares iBoxx $ High Yield Corporate Bond ETF |
| ICF | iShares Cohen & Steers Realty ETF |
| IEF | iShares Barclays 7-10 Yr. Tres. Bond ETF |
| LQD | iShares iBoxx $ Investment Grade Corp. Bond ETF |
| IJH | iShares S&P 400 MidCap Index Fund |
| ONEQ | Fidelity Nasdaq Composite Index Track |
| QQQ | Invesco QQQ Trust |
| RSP | Invesco S&P 500 Equal Weight ETF |
| IWM | iShares Russell 2000 Index ETF |
| SHY | iShares Barclays 1-3 Year Tres. Bond ETF |
| IJR | iShares S&P 600 SmallCap Index Fund |
| SPY | SPDR S&P 500 Index ETF Trust |
| TLT | iShares Barclays 20+ Year Treasury Bond ETF |
| GCC | WisdomTree Continuous Commodity Index Fund |
| VOOG | Vanguard S&P 500 Growth ETF |
| VOOV | Vanguard S&P 500 Value ETF |
| EEM | iShares MSCI Emerging Markets ETF |
| XLG | Invesco S&P 500 Top 50 ETF |
Relative strength is a measure of how a stock is performing when compared to something else, in this case the S&P 500 Equal Weighted Index (SPXEWI). Each day the stock's closing price is divided by that of the SPXEWI, the resulting numbers decimal is moved two places and then plotted on a Point & Figure chart. Whenever the relative strength chart shows a double top buy signal (e.g. RS Buy or Positive Relative Strength), it suggests the stock is likely to outperform the market for the foreseeable future. Conversely, whenever the relative strength chart gives a double bottom sell signal (e.g. RS Sell or Negative Relative Strength) it suggests the stock will under-perform the market. Relative strength signals tend to last roughly 18 to 24 months on average. Consequently, changes from buy signals to sell signals (and vice versa) are important to be aware of as they are longer-term implications of a stock's likely performance versus the indices. Using the Point & Figure chart along with the relative strength chart will allow you to better ascertain risk-reward and other trade management tools, but we always want to over-weight our portfolios toward those stocks that are on RS buy signals, giving us the best chance of outperforming the broader market.
In the Optionable Universe, this week we saw 13 relative strength buy signals compared to 19 last week. On the sell side, there were 13 relative strength sell signals compared to 11 last week.
| Symbol | Company | Sector | Price | RS vs Market Signal | RS vs Market Column | RS vs Peer Signal | RS vs Peer Column | Tech Attrib |
|---|---|---|---|---|---|---|---|---|
| ALGN | Align Technology, Inc. | Medical Products | 274.440 | Buy | X | Sell | X | 4 |
| GPX | GP Stratagies Corp | Industrial Goods & Svcs | 8.580 | Buy | X | Sell | X | 3 |
| APT | Alpha Pro Tech Limited | Medical Products | 17.700 | Buy | X | Buy | X | 5 |
| GNMK | Genmark Diagnostics Inc | Medical Products | 14.710 | Buy | X | Buy | X | 5 |
| AXDX | Accelr8 Technology Corp. | Biotechnology | 15.160 | Buy | X | Buy | X | 5 |
| INTL | International Assets Holding Corporation | Financial Services | 55.000 | Buy | X | Sell | X | 4 |
| NMM | Navios Maritime L.P. | Industrial Goods & Svcs | 9.710 | Buy | X | Buy | X | 4 |
| RAD | Rite Aid Corporation | Retail | 17.060 | Buy | X | Sell | X | 4 |
| SGC | Superior Uniform Group, Inc. | Cyclical Goods and Services | 13.400 | Buy | X | Buy | X | 5 |
| TNET | Trinet Group Inc. | Industrial Goods & Svcs | 60.940 | Buy | X | Buy | X | 5 |
| PAYS | Paysign, Inc. | Financial Services | 9.710 | Buy | X | Buy | X | 5 |
| SONO | Sonos, Inc. | Cyclical Goods and Services | 14.630 | Buy | X | Buy | X | 5 |
| RAD.TR | Rite Aid Corporation TR | Retail | 17.060 | Buy | X | Sell | X | 4 |
| Symbol | Company | Sector | Price | RS vs Market Signal | RS vs Market Column | RS vs Peer Signal | RS vs Peer Column | Tech Attrib |
|---|---|---|---|---|---|---|---|---|
| ATLC | Atlanticus Holdings Corp | Financial Services | 10.340 | Sell | O | Sell | O | 0 |
| EXC | Exelon Corporation | Electric Utilities | 36.290 | Sell | O | Sell | O | 1 |
| LNDC | Landec Corporation | Chemicals | 7.960 | Sell | O | Sell | O | 0 |
| PCG | PG&E Corporation | Electric Utilities | 8.870 | Sell | O | Sell | O | 0 |
| THC | Tenet Healthcare Corporation | Healthcare Providers | 18.110 | Sell | O | Buy | O | 1 |
| UIS | Unisys Corp | Technology Services | 10.910 | Sell | O | Sell | O | 1 |
| AMBA | Ambarella, Inc. | Semiconductors | 45.800 | Sell | O | Sell | O | 0 |
| QURE | Uniqure NV | Biotechnology | 45.060 | Sell | O | Sell | O | 0 |
| PVAC | Penn Virginia Corp. | Oil Companies Major | 9.530 | Sell | O | Sell | O | 1 |
| PCG.TR | PG&E Corporation TR | Electric Utilities | 8.870 | Sell | O | Sell | O | 0 |
| NTR | Nutrien Ltd. | Chemicals | 32.100 | Sell | O | Sell | O | 1 |
| THC.TR | Tenet Healthcare Corporation TR | Healthcare Providers | 18.110 | Sell | O | Buy | O | 1 |
| UIS.TR | Unisys Corp TR | Technology Services | 10.910 | Sell | O | Sell | O | 1 |
| Symbol | Company | Sector | Current Price | Action Price | Target | Stop | Notes |
|---|---|---|---|---|---|---|---|
| DRE | Duke Realty Corporation | Real Estate | $35.39 | mid to upper 30s | $48 | $28 | 4 for 5'er, consec buy signals, one box from 3rd buy signal, LT market RS buy, pos weekly mom, 2.64% yield |
| CDAY | Ceridian HCM Holding, Inc. | Software | $79.27 | high 70s to mid/high 80s | $88 | $62 | 5 for 5'er, pullback from AT high, consec buy signals, LT market RS buy signal, top 25% of DWASOFT |
| CNQ | Canadian Natural Resources Ltd. | Oil | $17.43 | 17 - 19 | 30.50 | 15 | 5 for 5'er, top third of favored OIL sector matrix, triple top, 7.1% yield, R-R>3.0 |
| WTRG | Essential Utilities Inc. | Waste Management | $42.24 | low-to-mid 40s | 63 | 37 | 4 for 5'er, favored WAST sector, LT pos. trend, quad top breakout, 2.15% yield, R-R>2.0 |
| HLF | Herbalife Nutrition Ltd. | Food Beverages/Soap | $44.98 | mid to upper 40s | $61 | $37 | 4 for 5'er, top 10% of DWAFOOD, consec buy signals, monthly mom flip |
| BBY | Best Buy Co., Inc. | Retailing | $87.27 | 82 - 90 | 97 | 72 | 4 for 5'er, favored RETA sector, bullish catapult, 2.6% yield, pot. covered write |
| RP | RealPage Inc. | Software | $65.01 | low 60s to mid-70s | 88 | 52 | 5 for 5'er, pullback from AT high, pos mon mom, top half of DWASOFT, LT market RS buy |
| SIMO | Silicon Motion Technology Corporation (Taiwan) ADR | Semiconductors | $48.77 | upper 40s - lower 50s | 75 | 40 | 4 for 5'er, favored SEMI sector, multi consec buy signals,good support 3.4% yield |
| DT | Dynatrace, Inc. | Computers | $40.60 | upper 30s - lower 40s | 51 | 33 | 5 for 5'er, favored COMP sector, quad top breakout, pullback from ATH, pot. covered write |
| HOLX | Hologic Incorporated | Healthcare | $57.00 | 54 - 59 | 106 | 48 | 4 for 5'er, top third of favored HEAL sector matrix, triple top, pos. mon mom flip, one box from peer RS buy |
| Symbol | Company | Sector | Current Price | Action Price | Target | Stop | Notes |
|---|---|---|---|---|---|---|---|
| LVS | Las Vegas Sands Corp. | Gaming | $45.54 | mid to lower 40s | 33 | 54 | 0 for 5'er, last in GAME sector matrix, neg. trend flip, spread triple bottom Earnings 7/22 |
| TAP | Molson Coors Company | Food Beverages/Soap | $34.36 | mid 30s | $22 | $41 | 0 for 5'er, consec sell signals, spread triple bottom, LT market RS sell signal, bottom of DWAFOOD |
| Symbol | Company | Sector | Current Price | Action Price | Target | Stop | Notes |
|---|---|---|---|---|---|---|---|
| SPTN | SpartanNash Co. | Retailing | $21.25 | hi 10s - low 20s | $34 | $16 | OK to add or maintain exposure here. Abide by $16 stop. |
| Comment |
|---|
| AMZN Amazon.com Inc. R ($2,816.38) - Internet - We will now raise our stop to $2496, the second potential sell signal on AMZN's default chart. |
HOLX Hologic Incorporated R ($56.65) - Healthcare - HOLX is a 4 for 5'er that ranks in the top third of the favored healthcare sector matrix. In late June, the stock gave a third consecutive buy signal when it broke a triple top at $55, which carried it to a new all-time high. Meanwhile, a recent flip to positive monthly momentum is a positive sign for the stock's prospects for additional upside. HOLX also currently sits one box away from moving to a peer RS buy signal for the first time since 2008, which would also elevate it to a perfect 5 for 5'er. Long exposure may be added in the $54 - $59 range and we will set our initial stop at $48, which would take out two levels of support on HOLX's default chart. We will use the bullish price objective of $106 as our target price.
| 16 | 17 | 18 | 19 | 20 | |||||||||||||||||||||||||||||||||||||||||||||||||
| 57.00 | X | 57.00 | |||||||||||||||||||||||||||||||||||||||||||||||||||
| 56.00 | • | X | 56.00 | ||||||||||||||||||||||||||||||||||||||||||||||||||
| 55.00 | X | • | X | 55.00 | |||||||||||||||||||||||||||||||||||||||||||||||||
| 54.00 | 1 | O | • | X | 6 | X | 54.00 | ||||||||||||||||||||||||||||||||||||||||||||||
| 53.00 | X | O | • | X | X | X | O | X | O | X | 53.00 | ||||||||||||||||||||||||||||||||||||||||||
| 52.00 | X | C | 2 | X | O | X | O | X | O | X | O | X | 52.00 | ||||||||||||||||||||||||||||||||||||||||
| 51.00 | X | O | 9 | X | O | X | O | X | O | X | O | X | O | X | Mid | 51.00 | |||||||||||||||||||||||||||||||||||||
| 50.00 | 7 | O | X | O | X | O | X | 5 | X | O | O | O | 50.00 | ||||||||||||||||||||||||||||||||||||||||
| 49.00 | X | 8 | X | O | X | O | 3 | X | O | 49.00 | |||||||||||||||||||||||||||||||||||||||||||
| 48.00 | 3 | X | O | A | X | O | X | O | X | 48.00 | |||||||||||||||||||||||||||||||||||||||||||
| 47.00 | • | X | O | 5 | X | B | X | O | X | O | X | 47.00 | |||||||||||||||||||||||||||||||||||||||||
| 46.00 | 5 | 6 | • | • | • | 2 | O | X | O | 6 | O | • | O | • | O | X | 46.00 | ||||||||||||||||||||||||||||||||||||
| 45.00 | X | O | X | O | 1 | • | X | • | X | 4 | X | O | X | • | • | O | X | 45.00 | |||||||||||||||||||||||||||||||||||
| 44.00 | X | O | X | O | X | O | • | X | O | • | X | O | X | O | X | • | O | X | 44.00 | ||||||||||||||||||||||||||||||||||
| 43.00 | 4 | O | 8 | C | O | • | X | X | X | O | • | X | O | O | • | O | X | 43.00 | |||||||||||||||||||||||||||||||||||
| 42.00 | X | 3 | O | X | 2 | • | X | O | X | O | X | C | X | • | O | X | 42.00 | ||||||||||||||||||||||||||||||||||||
| 41.00 | X | O | X | X | X | O | X | O | • | 7 | O | 9 | B | O | X | O | X | X | • | O | X | Bot | 41.00 | ||||||||||||||||||||||||||||||
| 40.00 | 9 | O | B | O | A | C | O | X | O | X | O | X | 5 | 6 | 8 | X | O | X | O | • | O | X | O | X | • | O | X | 40.00 | |||||||||||||||||||||||||
| 39.00 | X | O | X | O | 8 | O | B | O | X | O | B | O | X | O | X | O | X | O | X | O | X | • | O | X | O | X | • | O | X | 39.00 | |||||||||||||||||||||||
| 38.00 | X | O | X | C | X | X | O | X | 2 | O | X | O | X | O | X | O | X | O | • | A | • | O | 1 | • | O | X | 38.00 | ||||||||||||||||||||||||||
| 37.00 | X | O | 1 | 4 | O | X | O | X | 9 | X | O | X | 3 | O | X | • | • | • | O | X | 37.00 | ||||||||||||||||||||||||||||||||
| 36.00 | O | 3 | O | 7 | O | • | A | O | O | • | O | 4 | 36.00 | ||||||||||||||||||||||||||||||||||||||||
| 35.00 | O | X | O | X | • | • | O | X | • | 35.00 | |||||||||||||||||||||||||||||||||||||||||||
| 34.00 | O | X | O | X | • | O | X | • | 34.00 | ||||||||||||||||||||||||||||||||||||||||||||
| 33.00 | O | X | 5 | • | O | X | • | 33.00 | |||||||||||||||||||||||||||||||||||||||||||||
| 32.00 | 2 | • | O | X | • | 32.00 | |||||||||||||||||||||||||||||||||||||||||||||||
| 31.00 | • | O | X | • | 31.00 | ||||||||||||||||||||||||||||||||||||||||||||||||
| 30.00 | • | O | X | • | 30.00 | ||||||||||||||||||||||||||||||||||||||||||||||||
| 29.00 | • | O | X | • | 29.00 | ||||||||||||||||||||||||||||||||||||||||||||||||
| 28.00 | • | O | X | • | 28.00 | ||||||||||||||||||||||||||||||||||||||||||||||||
| 27.00 | • | O | • | 27.00 | |||||||||||||||||||||||||||||||||||||||||||||||||
| 16 | 17 | 18 | 19 | 20 |
| AMGN Amgen Inc. ($249.08) - Biomedics/Genetics - Amgen shares completed a shakeout to return to a buy signal at $248 today, marking a new all-time high in the process. AMGN returned to a positive trend in March of 2020 and has maintained a market RS buy signal since October of 2014. Additionally, weekly momentum has recently fipped positive, suggesting the potential for further gains. Demand is in control and long exposure may be added here. Note that support is offered at $216 and that AMGN carries a yield of 2.71%. Earnings are expected on 7/23. |
| APPF Appfolio Inc ($169.78) - Software - Appfolio shares completed a bullish triangle at $166 today to mark a fourth consecutive buy signal before continuing further to $168. This 5 for 5'er moved to a positive trend in May and has maintained a market RS buy signal since November of 2016. Additionally, APPF ranks 13th of 113 names included in the favored software sector RS matrix. Demand is in control. Okay to add here with support offered at $158 and $156. Note that earnings are expected on 7/27. |
| AYX Alteryx Inc ($175.45) - Software - Alteryx shares completed a bullish triangle at $168 today, marking a fifth consecutive buy signal before advancing further past resistance to a new all-time high of $176. AYX is a strong 5 for 5'er that trades well above its recently established bullish support line and ranks 22nd of 113 names included in the favored software sector RS matrix. Demand is in control and long exposure may be added here or on a pullback, as AYX is approaching overbought levels. Note that support is offered at $158 and $154. Earnings are expected on 7/29. |
| CROX Crocs, Inc. ($35.66) - Textiles/Apparel - Crocs shares broke a double top at $37 to mark a third consecutive buy signal. This 4 for 5'er trades well above its recently established bullish support line and is one box away from moving to a market RS buy signal. Additionally, CROX ranks 2nd of 21 names included in the favored textiles/apparel sector RS matrix. Demand is in control and long exposure may be added here on an individual basis or via the DWA Textiles & Apparel Sector Portfolio, of which CROX is a holding. Support is offered at $30 and earnings are expected on 7/30. |
| MDGL Madrigal Pharmaceuticals Inc. ($112.41) - Healthcare - Madrigal Pharma shares completed a bearish signal reversal at $116 today, returning the stock to a buy signal before it advanced further to $118. This 4 for 5'er trades well above its recently established bullish support line and moved to a market RS buy signal in April of 2020. Additionally, MDGL ranks 10th of 116 names included in the favored healthcare sector RS matrix. Okay to add on the breakout here as the weight of the evidence is positive. Note that support is offered at $97 for this high rRisk (relative volatility) stock. |
| NOW Servicenow Inc ($412.64) - Software - Servicenow shares broke a double top at $408 today, marking a seventh consecutive buy signal and testing an all-time high for the stock. This strong 4 for 5'er trades well above its bullish support line and has maintained a market RS buy signal since September of 2013. Additionally, NOW ranks in the top third of the favored software sector RS matrix. Demand is in control and long exposure may be added here. Note that initial support is offered at $388 and that earnings are expected on 7/22. |
| RARE Ultragenyx Pharmaceutical Inc. ($84.24) - Biomedics/Genetics - Ultragenyx shares broke a double top at $79 and continued higher to $84 during today's intraday action. This 4 for 5'er has been in a positive trend since April and has maintained positive monthly momentum for the past five months. RARE has been on an RS buy signal since April and is currently in the top quartile of its DWA sector matrix. From here, initial support lies at $73. |
| SCS Steelcase, Inc. ($10.87) - Business Products - Steelcase shares returned to a sell signal with a double bottom break at $11 today. This 1 for 5'er moved to a negative trend in February and has been on a market RS sell signal since December of 2015. Supply is in control and long exposure should be avoided. Short sellers should note that SCS has a yield of 2.32%. |
| TTD The Trade Desk Inc ($426.56) - Internet - Trade Desk shares broke a triple top at $424 and has continued its upward move to $432 to reach a new all-time high with today's intraday action. TTD is now on its fourth consecutive buy signal and has been in a positive trend since April. This 5 for 5'er has been on an RS buy signal versus the market since early 2017 and is currently ranked 7th of 52 names included in the internet sector RS matrix. A recent flip to positive monthly momentum suggests the potential for higher prices. Those looking to take a long position may be best served to wait for a pullback as recent price action has put TTD into heavily overbought territory. From here initial support is offered at $392. |
| TWLO Twilio Inc ($226.65) - Internet - Twilio shares broke a double top at $224 today, marking a third consecutive buy signal and a new all-time high. This strong 5 for 5'er moved to a positive trend in April and has maintained a market RS buy signal since March of 2018. Additionally, the stock ranks 6th of 52 names included in the favored internet sector RS matrix. Demand is in control and long exposure may be added here individually or via the DWA Internet Sector Portfolio, of which TWLO is a holding. Support is offered at $208 and earnings are expected on 7/29. |
| Name | Option Symbol | Action | Stop Loss |
|---|---|---|---|
| Microchip Technology Incorporated - $104.41 | MCHP2016J95 | Buy the October 95.00 calls at 16.90 | 98.00 |
| Name | Option | Action |
|---|---|---|
| Microsoft Corporation ( MSFT) | Oct. 190.00 Calls | Raise the stock price stop loss to 194.00 (CP: 205.97) |
| Name | Option Symbol | Action | Stop Loss |
|---|---|---|---|
| Waters Corporation - $180.48 | WAT2020W190 | Buy the November 190.00 puts at 25.10 | 196.00 |
| Name | Option | Action |
|---|---|---|
| Ameren Corporation (AEE) | Sep. 80.00 Puts | Stopped at 10.10 (CP: 7.10) |
| Hyatt Hotels Corp. (H) | Nov. 55.00 Puts | Stopped at 9.50 (CP: 9.40) |
| Name | Option Sym. | Call to Sell | Call Price | Investment for 500 Shares | Annual Called Rtn. | Annual Static Rtn. | Downside Protection |
|---|---|---|---|---|---|---|---|
| Activision Blizzard, Inc. $75.90 | ATVI2020K80 | Nov. 80.00 | 5.95 | $36,480.10 | 22.05% | 18.00% | 6.55% |
| Name | Action |
|---|---|
| Micron Technology, Inc. (MU) - 51.52 | Sell the October 50.00 Calls. |
| Truist Financial Corp (TFC) - 37.55 | Sell the September 40.00 Calls. |
| Bank of America (BAC) - 23.75 | Sell the November 25.00 Calls. |
| D.R. Horton, Inc. (DHI) - 55.45 | Sell the November 60.00 Calls. |
| Morgan Stanley (MS) - 48.30 | Sell the September 50.00 Calls. |
| Chegg Inc (CHGG) - 67.26 | Sell the October 70.00 Calls. |
| Louisiana-Pacific Corporation (LPX) - 25.65 | Sell the November 26.00 Calls. |
| Newmont Corp (NEM) - 61.74 | Sell the September 65.00 Calls. |
| Name | Covered Write |
|---|---|
|
|
|
Daily Equity & Market Analysis
Loading, Please Wait...
