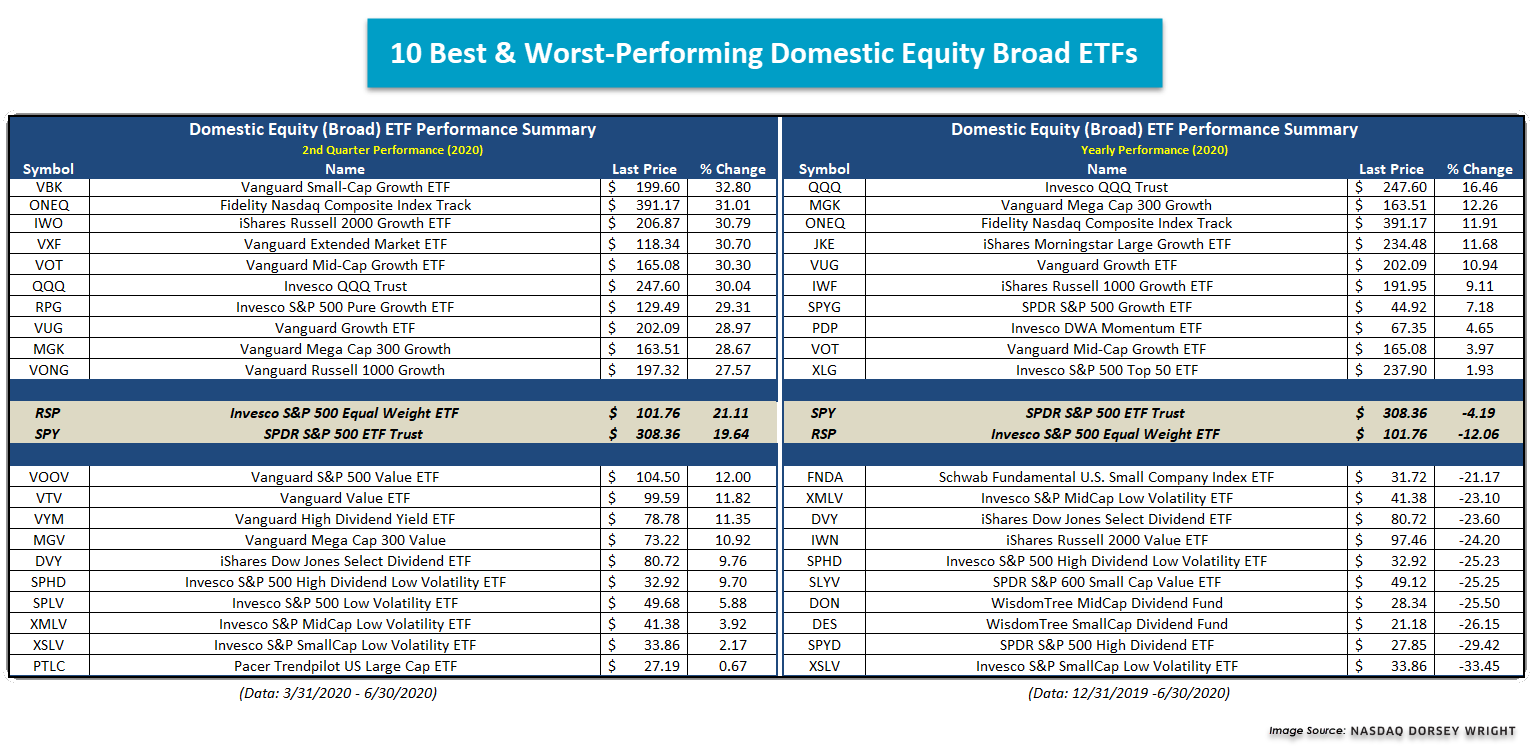
We review the performance trends for the broad domestic ETF universe for Q2 2020.
Portfolio View - Major Market ETFs
| Symbol | Name | Price | Yield | PnF Trend | RS Signal | RS Col. | Fund Score | 200 Day MA | Weekly Mom |
|---|---|---|---|---|---|---|---|---|---|
| DIA | SPDR Dow Jones Industrial Average ETF Trust | 257.87 | 2.32 | Positive | X | 3.03 | 262.82 | -1W | |
| EEM | iShares MSCI Emerging Markets ETF | 39.99 | 2.23 | Positive | Sell | O | 2.13 | 40.52 | +12W |
| EFA | iShares MSCI EAFE ETF | 60.87 | 2.68 | Positive | Sell | O | 1.19 | 63.09 | +12W |
| FM | iShares MSCI Frontier 100 ETF | 24.20 | 3.28 | Negative | Sell | O | 0.41 | 26.59 | +12W |
| IJH | iShares S&P MidCap 400 Index Fund | 177.82 | 1.81 | Positive | Buy | O | 2.19 | 184.03 | -1W |
| IJR | iShares S&P SmallCap 600 Index Fund | 68.29 | 1.73 | Positive | Buy | O | 1.87 | 73.07 | +12W |
| QQQ | Invesco QQQ Trust | 247.60 | 0.67 | Positive | Buy | X | 5.87 | 210.77 | -2W |
| RSP | Invesco S&P 500 Equal Weight ETF | 101.76 | 2.11 | Positive | Buy | X | 3.38 | 104.84 | -1W |
| SPY | SPDR S&P 500 ETF Trust | 308.36 | 1.86 | Positive | O | 3.80 | 301.71 | -1W | |
| XLG | Invesco S&P 500 Top 50 ETF | 237.90 | 1.53 | Positive | O | 5.55 | 223.14 | -2W |
Additional Comments:
As we continue our customary Q2 2020 update, today, we will delve into ETF performance trends from last quarter within the broad domestic equity category. We used the Security Screener to whittle down this list to about half of the constituents within the group to achieve diverse representation while avoiding any significant overlap between similar funds. We also excluded leveraged and inverse funds and used a $100 million AUM along with a volume filter to make sure that we covered the most widely traded ETFs. See the commentary below the table.

- The ten best and worst-performing broad US ETFs all finished the second quarter of 2020 in positive territory. The best performing fund was the Vanguard Small-Cap Growth ETF VBK with an impressive gain of 32.80% while the worst performing was the Pacer Trendpilot US Large-Cap ETF PTLC, up 0.67%.
- Growth funds dominated the top ten performing ETFs from Q2 as small, mid, and large-cap growth were all represented.
- The ten worst performing ETFs in Q2 2020 consisted of low volatility funds, high yield, and value.
- Low volatility was weak across all areas of the US equity market with the Invesco S&P 500 Low Volatility ETF SPLV, Invesco S&P MidCap Low Volatility ETF XMLV, and Invesco S&P SmallCap Low Volatility ETF XSLV making up the fourth, third, and second-worst performing funds, respectively, for Q2 2020.
- The Invesco QQQ Trust QQQ was the sixth-best performing fund over Q2 2020 with a gain of 30.04% and is the best performing fund on a year-to-date basis, up 16.46%.
- While we did not see momentum represented in the best and worst-performing funds for Q2, Invesco DWA Momentum ETF PDP is in the top ten funds on a year-to-date basis with a gain of 4.65%.
- Year-to-date, large and mega-cap growth funds dominate the top ten best performing list.
- The ten worst performing funds so far this year consist of weaker RS areas such as low vol, high dividend, and value representatives from each size classification.
