We provide a Q2 recap for best and worst-performing commodity and currency ETFs.
Remember, these are technical comments only. Just as you must be aware of fundamental data for the stocks we recommend based on technical criteria in the report, so too must you be aware of important data regarding delivery, market moving government releases, and other factors that may influence commodity pricing. We try to limit our technical comments to the most actively traded contracts in advance of delivery, but some contracts trade actively right up to delivery while others taper off well in advance. Be sure you check your dates before trading these contracts. For questions regarding this section or additional coverage of commodities email james.west@dorseywright.com.
Data represented in the table below is through 06/30/2020:
Broad Market Commodities Report
Portfolio View - Commodity Indices
| Symbol | Name | Price | PnF Trend | RS Signal | RS Col. | 200 Day MA | Weekly Mom |
|---|---|---|---|---|---|---|---|
| CL/ | Crude Oil Continuous | 39.39 | Negative | Buy | X | 44.75 | +10W |
| DBLCIX | Deutsche Bank Liquid Commodities Index | 256.79 | Negative | Sell | O | 286.16 | +12W |
| DWACOMMOD | DWA Continuous Commodity Index | 452.20 | Negative | Buy | O | 459.93 | -1W |
| GC/ | Gold Continuous | 1798.80 | Positive | Buy | X | 1594.71 | +1W |
| HG/ | Copper Continuous | 2.71 | Negative | Buy | O | 2.56 | +11W |
| ZG/ | Corn (Electronic Day Session) Continuous | 338.00 | Negative | Buy | O | 359.95 | +9W |
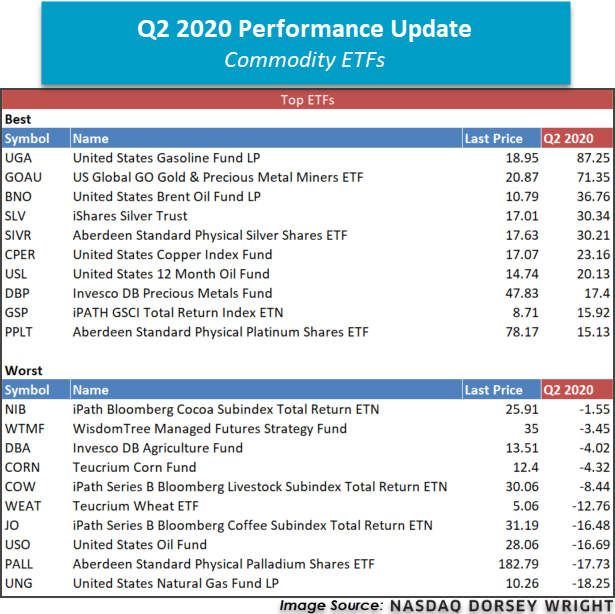
Q2 of 2020 was generally constructive for the broader commodity space, as the WisdomTree Continuous Commodity Index Fund GCC, a general asset class proxy, returned 7.89%. Despite this above-average showing, the fund remains steeply in the red with a year-to-date return of -17.03% as of June 30th. As is the case with all broad asset classes, there were leaders and laggards that told unique stories of strength and weakness within the commodity space. Downstream commodity funds within the oil and gasoline space were among some of the best performing investments during the last quarter, led by the United States Gasoline Fund LP UGA, which returned a whopping 87.25%. Silver commodity funds and gold/silver mining-related ETFs also outperformed the broader asset class during this timeframe, including investments such as the US Global GO Gold & Precious Metal Miners ETF GOAU and the iShares Silver Trust SLV. On the lagging end, agricultural commodities littered the bottom of the quarterly-performance rankings, although the United States Natural Gas Fund LP UNG and the Aberdeen Standard Physical Palladium Shares ETF PALL were the two worst-performing ETFs on the quarter. One interesting observation was the divergence between the United States Oil Fund USO, which shed -16.69% in Q2 and the United States 12 Month Oil Fund USL, which returned 20.13% in the same period. This is a perfect example to reiterate why it is important to know exactly what you own when trading commodities-based investment products, as USO was a front-month heavy product up until the middle of Q2 when it changed its underlying holding structure. USL on the other hand maintains 12-month forward contract exposure, which has had much less volatility in the near-term.
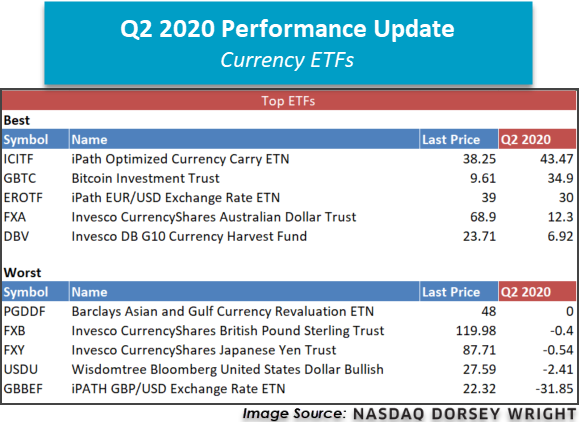
Broadly speaking, foreign currencies benefited from a weakening dollar during Q2 of 2020. The Wisdomtree Bloomberg United States Dollar Bullish USDU fell -2.41% during the timeframe, although the fund remains in the black on the year with a YTD return of 3.48%. On the opposite end of the reserve currency spectrum, the Euro strengthened significantly against the dollar during Q2, as evidenced by the iPath EUR/USD Exchange Rate ETN EROTF returning 30%.

The returns above are price returns and do not include dividends or all potential transaction costs. Past performance is not indicative of future results. Potential for profits is accompanied by possibility of loss.

