Most Requested Symbols


There are no model changes to report this week.
As of January 13, we will no longer be publishing the weekly State Street ETF report. Additionally, the SSTREET, SSTARGETSECTOR, and SSWORLD models will no longer be supported on the NDW Research Platform. We will, however, continue to run and support the State Street Fixed Income Model SSFIXED, which follows the same underlying methodology as the SPDR Dorsey Wright Fixed Income Allocation ETF DWFI. We will alert all users with SSGA model alerts of these changes over the next week.
Over the last two weeks, we have continued our review of the underlying methodologies for the three SSGA models that will no longer be supported so that users may continue to run them on their own going forward using the matrix tool and/or the Custom Modeler Tool. We first discussed the State Street Sector Rotation Model SSTREET, which can be accessed here, and we reviewed the State Street Targeted Sector Rotation Model SSTARGETSECTOR last week, which can be accessed here. Today, we’ll cover the State Street Global Rotation Model SSWORLD.
The SSWORLD model is a global rotation model that is matrix-based, like the SSTARGETSECTOR model we discussed last week. We start with a universe of 10 global ETFs, including the US representative SPY, and compare them to one another using a 3.25% RS matrix. The model owns the strongest three ETFs and will hold them until they fall significantly out of favor, which for this model is defined as a ranking of 7 or below. The model is reviewed on a weekly basis for any changes. Upon a change, the model will sell the weak position and will rotate into the strongest ETF not already held in the model. The holdings will then be rebalanced back to equal-weight at 33.33% each.
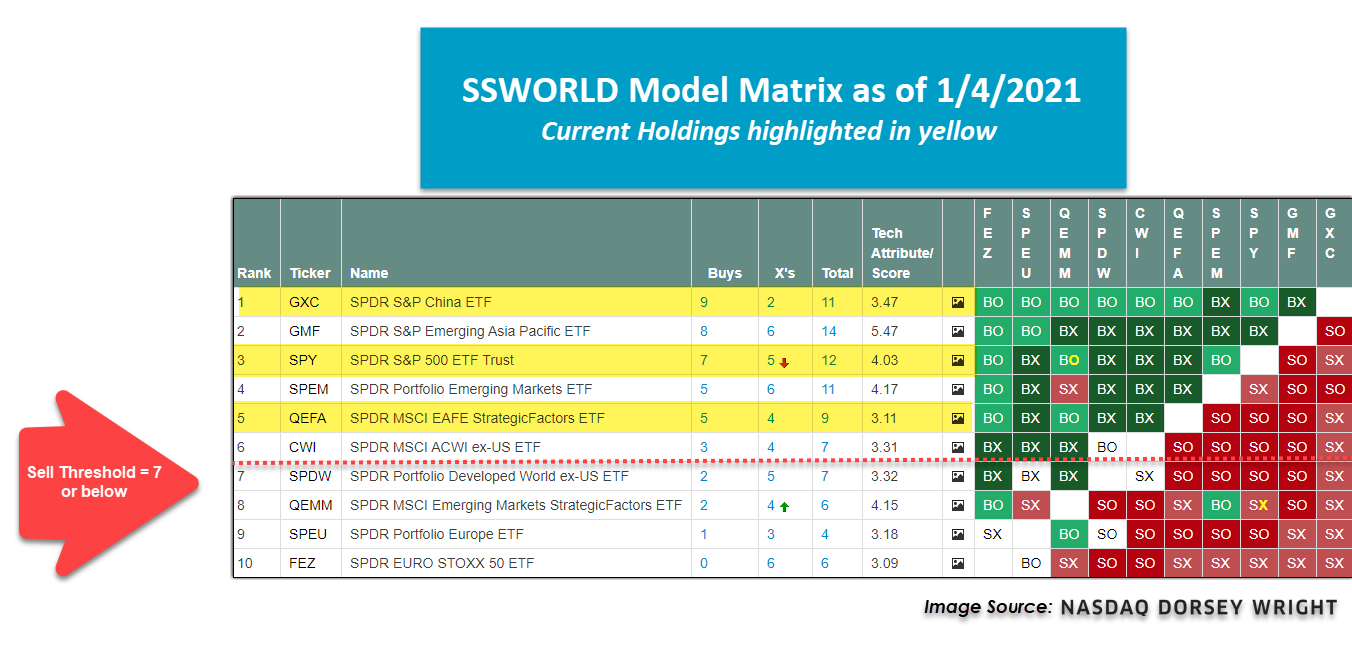
Currently, the SSWORLD model provides exposure to China GXC, the US SPY, and developed markets via a Smart Beta index that blends low volatility, quality and value exposures together in a single strategy QEFA. These global trends have stayed relatively consistent as there has not been a model change since July 2017. If you have any questions on any of these models, please give us a call at 804-320-8511 or email us at dwa@dorseywright.com.
Q4 2020 & 2020 Performance Review
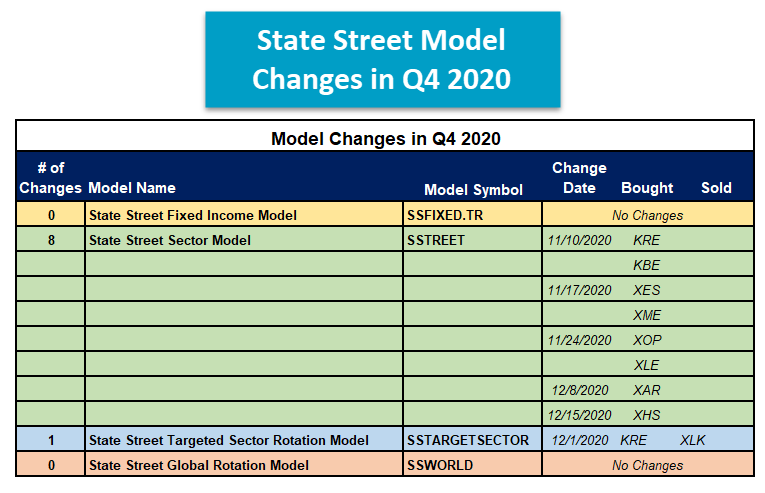
All four State Street Models finished Q4 as well as the year 2020 in positive territory. In Q4, all but the SSWORLD model outperformed the respective model benchmark, while each SSGA model successfully outperformed on a year-to-date basis. When all was said and done, there were eight model changes to report in the State Street Sector Model SSTREET and one change in the State Street Targeted Sector Rotation Model SSTARGETSECTOR model. There were no changes to the State Street Fixed Income SSFIXED.TR or SSWORLD models. Here is a summary of what transpired during the final quarter of 2020.

Like a radar screen, the Weekly Activity Summary gives you a snap shot view of any technical changes to the State Street universe of ETFs. Included in the summary below are both long term technical changes and intermediate term technical changes.
| Symbol | Name | Price | Score | 30 Day Rtn | 90 Day Rtn | YTD Rtn |
|---|---|---|---|---|---|---|
| BIL | SPDR Bloomberg Barclays 1-3 Month T-Bill ETF | 91.510 | 0.3647 | -0.022 | -0.011 | -0.011 |
| SPBO | SPDR Portfolio Corporate Bond ETF | 35.990 | 3.1768 | 0.195 | 2.012 | -0.648 |
| XNTK | SPDR NYSE Technology ETF | 142.915 | 4.8799 | 5.007 | 17.836 | 1.107 |
| SPLB | SPDR Portfolio Long Term Corporate Bond ETF | 32.640 | 3.1160 | -0.183 | 3.258 | -1.390 |
| XLK | Technology Select Sector SPDR Fund | 128.730 | 4.3125 | 2.134 | 9.316 | -0.992 |
| XLP | Consumer Staples Select Sector SPDR Fund | 66.720 | 2.6503 | -1.346 | 2.963 | -1.082 |
| XLY | Consumer Discretionary Select Sector SPDR Fund | 160.610 | 4.1608 | 1.633 | 6.491 | -0.106 |
| XHB | SPDR S&P Homebuilders ETF | 57.000 | 5.1046 | 0.476 | 2.684 | -1.110 |
| SPYG | SPDR S&P 500 Growth ETF | 54.830 | 4.3631 | 1.218 | 8.082 | -0.832 |
| MMTM | SPDR S&P 1500 Momentum Tilt ETF | 160.827 | 3.1371 | 1.750 | 6.935 | -0.779 |
| SYG | SPDR MFS Systematic Growth Equity ETF | 115.104 | 4.2275 | 2.386 | 5.517 | -0.824 |
| ULST | SPDR SSgA Ultra Short Term Bond ETF | 40.430 | 0.8666 | -0.025 | -0.025 | -0.012 |
| XLC | Communication Services Select Sector SPDR Fund | 66.720 | 4.1992 | -0.388 | 12.703 | -1.126 |
| Symbol | Name | Price | Score | 30 Day Rtn | 90 Day Rtn | YTD Rtn |
|---|---|---|---|---|---|---|
| XES | SPDR S&P Oil & Gas Equipment & Services ETF | 48.980 | 3.8876 | 7.224 | 70.722 | 9.233 |
| Symbol | Name | Price | Score | 30 Day Rtn | 90 Day Rtn | YTD Rtn |
|---|---|---|---|---|---|---|
| SPAB | SPDR Portfolio Aggregate Bond ETF | 30.730 | 2.5671 | 0.228 | 0.261 | -0.195 |
| SPTL | SPDR Portfolio Long Term Treasury ETF | 44.760 | 2.1019 | 0.743 | -1.842 | -0.820 |
| SPSB | SPDR Portfolio Short Term Corporate Bond ETF | 31.390 | 2.5201 | 0.064 | 0.128 | -0.032 |
| Symbol | Name | Price | Score | 30 Day Rtn | 90 Day Rtn | YTD Rtn |
|---|---|---|---|---|---|---|
| EBND | SPDR Bloomberg Barclays Emerging Markets Local Bond ETF | 28.160 | 2.9610 | 1.514 | 7.032 | 0.392 |
| HYMB | SPDR Nuveen Bloomberg Barclays High Yield Municipal Bond ETF | 58.960 | 2.7736 | 1.149 | 4.133 | -0.051 |
| XNTK | SPDR NYSE Technology ETF | 142.915 | 4.8799 | 5.007 | 17.836 | 1.107 |
| IBND | SPDR Bloomberg Barclays International Corporate Bond ETF | 38.075 | 3.8358 | 1.588 | 6.325 | 0.462 |
| XLK | Technology Select Sector SPDR Fund | 128.730 | 4.3125 | 2.134 | 9.316 | -0.992 |
| XLV | Health Care Select Sector SPDR Fund | 113.770 | 3.9148 | 1.093 | 6.456 | 0.291 |
| XBI | SPDR S&P Biotech ETF | 140.450 | 5.7402 | 3.120 | 18.453 | -0.234 |
| SPYG | SPDR S&P 500 Growth ETF | 54.830 | 4.3631 | 1.218 | 8.082 | -0.832 |
| XTL | SPDR S&P Telecom ETF | 85.075 | 3.5259 | 4.591 | 21.813 | 0.383 |
| MMTM | SPDR S&P 1500 Momentum Tilt ETF | 160.827 | 3.1371 | 1.750 | 6.935 | -0.779 |
| ZDEU | SPDR Solactive Germany ETF | 64.441 | 2.9942 | 2.239 | 7.276 | 1.748 |
| SYE | SPDR MFS Systematic Core Equity ETF | 96.561 | 3.9443 | 1.334 | 8.468 | -0.596 |
The distribution curve places each ETF on a bell curve according to their respective degrees of overbought or oversold status using a 10-week distribution. ETFs that are statistically oversold will appear on the left-hand side of the bell curve, while those that have become statistically overbought will appear on the right-hand side of the bell curve. Perhaps the most useful attribute of this feature is that it displays the entire universe on the curve at one time with an "average level" to give us a general picture of whether the State Street ETF universe is generally overbought on a near-term basis, or generally oversold. Our best opportunities are to buy strong market ETFs that have regressed back toward mean conditions based on market weakness, or have become oversold based upon extreme market weakness.
Weekly Distribution is a short-term gauge that is most helpful in timing entry and exit points, while the longer-term information of trend and relative strength is a more controlling factor in the decision of whether to buy or sell. The Distribution Curve below displays those ETFs with positive RS in uppercase letters and those ETFs with poor RS versus the market in lowercase letters. As well, those ETFs that are on a Point & Figure Buy signal appear in Green letters, while those on Sell signals can appear in Red letters. Box Color indicates the Sector Status Rating. Green = Favored, Yellow = Average, and Red = Unfavored.
Average Level 55.06
<--100
-100--80
-80--60
-60--40
-40--20
-20-0
0-20
20-40
40-60
60-80
80-100
100->


The DWA Matrix uses a Point & Figure relative strength comparison of each index to one another to identify the strongest and the weakest among the universe used. The ETFs with the most relative strength buy signals (suggesting outperformance) versus the others in the group are listed at the top. These ETFs should be overweighted in the portfolio. Those ETFs with the least amount of relative strength buy signals versus the others in the group are listed at the bottom. These ETFs should be underweighted in the portfolio.
| Ticker | Name | Buys | Xs | Tech Attribute/ Score |
|---|---|---|---|---|
| MDYG | SPDR S&P 400 Mid Cap Growth ETF | 14 | 15 | 5.32 |
| SPYG | SPDR S&P 500 Growth ETF | 12 | 6 | 4.36 |
| SLYG | SPDR S&P 600 Small Cap Growth ETF | 11 | 15 | 4.42 |
| SPLG | SPDR Portfolio S&P 500 ETF | 11 | 8 | 4.08 |
| SPTM | SPDR Portfolio S&P 1500 Composite Stock Market ETF | 11 | 6 | 4.10 |
| SPY | SPDR S&P 500 ETF Trust | 10 | 7 | 4.01 |
| DIA | SPDR Dow Jones Industrial Average ETF Trust | 10 | 5 | 3.76 |
| MDY | SPDR S&P MIDCAP 400 ETF Trust | 8 | 14 | 3.45 |
| SLYV | SPDR S&P 600 Small Cap Value ETF | 8 | 12 | 3.99 |
| SDY | SPDR S&P Dividend ETF | 7 | 2 | 2.76 |
| SPYV | SPDR S&P 500 Value ETF | 7 | 2 | 2.81 |
| SLY | SPDR S&P 600 Small Cap ETF | 6 | 12 | 4.28 |
| MDYV | SPDR S&P 400 Mid Cap Value ETF | 5 | 11 | 3.17 |
| DGT | SPDR DJ Global Titans ETF | 5 | 5 | 3.35 |
| SPMD | SPDR Portfolio S&P 400 Mid Cap ETF | 3 | 12 | 3.32 |
| CWI | SPDR MSCI ACWI ex-US ETF | 3 | 4 | 3.35 |
| GLD | SPDR Gold Trust | 0 | 0 | 2.98 |
Ticker
Name
Buys
Xs
Tech
Attribute/
Score
GMF
SPDR S&P Emerging Asia Pacific ETF
14
11
5.55
SPY
SPDR S&P 500 ETF Trust
13
10
4.01
GXC
SPDR S&P China ETF
12
2
3.69
SPEM
SPDR Portfolio Emerging Markets ETF
11
12
4.27
DIA
SPDR Dow Jones Industrial Average ETF Trust
11
10
3.76
DGT
SPDR DJ Global Titans ETF
10
9
3.35
CWI
SPDR MSCI ACWI ex-US ETF
9
7
3.35
EWX
SPDR S&P Emerging SmallCap
7
13
4.47
SPDW
SPDR Portfolio Developed World ex-US ETF
7
8
3.35
SPEU
SPDR Portfolio Europe ETF
5
7
3.18
FEZ
SPDR EURO STOXX 50 ETF
5
7
3.07
GWX
SPDR S&P International Small Cap ETF
4
13
4.25
GII
The SPDR FTSE/Macquarie Global Infrastructure 100
4
5
2.70
RWO
SPDR DJ Wilshire Global Real Estate
2
2
2.61
RWX
SPDR DJ Wilshire International Real Estate ETF
1
1
1.66
DWX
SPDR S&P International Dividend
0
3
2.38
| Ticker | Name | Buys | Xs | Tech Attribute/ Score |
|---|---|---|---|---|
| XSD | SPDR S&P Semiconductor ETF | 27 | 29 | 5.87 |
| KRE | SPDR S&P Regional Banking ETF | 26 | 23 | 4.00 |
| XHB | SPDR S&P Homebuilders ETF | 26 | 7 | 5.10 |
| XME | SPDR S&P Metals & Mining ETF | 25 | 30 | 4.59 |
| XSW | SPDR S&P Software & Services ETF | 24 | 25 | 5.68 |
| XNTK | SPDR NYSE Technology ETF | 24 | 19 | 4.88 |
| XHS | SPDR S&P Health Care Services ETF | 23 | 23 | 5.72 |
| XBI | SPDR S&P Biotech ETF | 23 | 22 | 5.74 |
| XRT | SPDR S&P Retail ETF | 22 | 26 | 5.76 |
| XES | SPDR S&P Oil & Gas Equipment & Services ETF | 22 | 24 | 3.89 |
| KBE | SPDR S&P Bank ETF | 22 | 22 | 3.87 |
| XLY | Consumer Discretionary Select Sector SPDR Fund | 19 | 10 | 4.16 |
| XLK | Technology Select Sector SPDR Fund | 19 | 9 | 4.31 |
| KCE | SPDR S&P Capital Markets ETF | 18 | 21 | 4.65 |
| XTN | SPDR S&P Transportation ETF | 18 | 17 | 5.10 |
| XHE | SPDR S&P Health Care Equipment ETF | 18 | 17 | 5.54 |
| XOP | SPDR S&P Oil & Gas Exploration & Production ETF | 17 | 18 | 2.90 |
| XLI | Industrial Select Sector SPDR Fund | 16 | 13 | 3.67 |
| XLB | Materials Select Sector SPDR Fund | 15 | 15 | 4.30 |
| XAR | SPDR S&P Aerospace & Defense ETF | 14 | 23 | 4.94 |
| XLC | Communication Services Select Sector SPDR Fund | 13 | 8 | 4.20 |
| XTL | SPDR S&P Telecom ETF | 12 | 18 | 3.53 |
| KIE | SPDR S&P Insurance ETF | 11 | 10 | 2.69 |
| XLV | Health Care Select Sector SPDR Fund | 11 | 6 | 3.91 |
| XLF | Financial Select Sector SPDR Fund | 8 | 16 | 2.95 |
| XPH | SPDR S&P Pharmaceuticals ETF | 8 | 14 | 3.23 |
| RWR | SPDR Dow Jones REIT ETF | 4 | 4 | 2.38 |
| GLD | SPDR Gold Trust | 3 | 8 | 2.98 |
| XLP | Consumer Staples Select Sector SPDR Fund | 3 | 4 | 2.65 |
| RWO | SPDR DJ Wilshire Global Real Estate | 3 | 4 | 2.61 |
| XLU | Utilities Select Sector SPDR Fund | 2 | 1 | 2.41 |
| XLE | Energy Select Sector SPDR Fund | 0 | 9 | 3.82 |
| Ticker | Name | Buys | Xs | Tech Attribute/ Score |
|---|---|---|---|---|
| CWB | SPDR Bloomberg Barclays Convertible Bond ETF | 20 | 20 | 4.76 |
| IBND | SPDR Bloomberg Barclays International Corporate Bond ETF | 18 | 19 | 3.84 |
| WIP | SPDR FTSE International Government Inflation-Protected Bond ETF | 16 | 18 | 3.31 |
| EBND | SPDR Bloomberg Barclays Emerging Markets Local Bond ETF | 16 | 15 | 2.96 |
| JNK | SPDR Bloomberg Barclays High Yield Bond ETF | 16 | 13 | 2.68 |
| PSK | SPDR Wells Fargo Preferred Stock ETF | 15 | 11 | 2.24 |
| BWX | SPDR Bloomberg Barclays International Treasury Bond ETF | 14 | 16 | 3.69 |
| SPLB | SPDR Portfolio Long Term Corporate Bond ETF | 14 | 13 | 3.12 |
| SRLN | SPDR Blackstone GSO Senior Loan ETF | 11 | 13 | 2.76 |
| SPTI | SPDR Portfolio Intermediate Term Treasury | 11 | 2 | 2.43 |
| SPIP | SPDR Portfolio TIPS ETF | 9 | 9 | 2.86 |
| TFI | SPDR Nuveen Bloomberg Barclays Municipal Bond ETF | 9 | 8 | 2.86 |
| SPAB | SPDR Portfolio Aggregate Bond ETF | 8 | 4 | 2.57 |
| SPMB | SPDR Portfolio Mortgage Backed Bond ETF | 8 | 3 | 1.72 |
| SPIB | SPDR Portfolio Intermediate Term Corporate Bond ETF | 7 | 9 | 2.88 |
| BWZ | SPDR Bloomberg Barclays Short Term International Treasury Bond ETF | 6 | 16 | 3.44 |
| FLRN | SPDR Bloomberg Barclays Investment Grade Floating Rate ETF | 6 | 7 | 1.49 |
| SHM | SPDR Nuveen Bloomberg Barclays Short Term Municipal Bond ETF | 5 | 6 | 2.24 |
| SPSB | SPDR Portfolio Short Term Corporate Bond ETF | 3 | 5 | 2.52 |
| BIL | SPDR Bloomberg Barclays 1-3 Month T-Bill ETF | 2 | 1 | 0.36 |
| SPTL | SPDR Portfolio Long Term Treasury ETF | 2 | 0 | 2.10 |
The State Street ETF Model Portfolios are designed to identify major leadership themes within a market, doing so through the use of Point and Figure relative strength tools. Each of the State Street Models are evaluated weekly and guided by a rules-based investment methodology. The construction of the State Street Sector ETF Portfolio is done through an analysis of the each State Street Sector ETF relative strength chart versus the S&P 500, while the Global Sector Rotation model employs a relative strength matrix ranking of the model's inventory. In either case, those with strong relative strength make the cut and are eligible to be included in the portfolio, while those that aren't, will sit upon the sideline. For more information on the portfolio construction and back testing please see the information files on the Models Page. To enter a portfolio amount and see shares to be purchased as well as modify the portfolio to your specifications, click here. (Note: All State Street ETF Models are updated Wednesday mornings by 9:30 am EST)
| ETF Name | Symbol | DWA Suggested Weighting | Yield | Date Added |
|---|---|---|---|---|
| SPDR NYSE Technology ETF | XNTK | 5.000% | 0.2957 | 03/11/2009 |
| SPDR S&P Bank ETF | KBE | 5.000% | 2.4438 | 11/10/2020 |
| SPDR S&P Regional Banking ETF | KRE | 5.000% | 2.7776 | 11/10/2020 |
| Energy Select Sector SPDR Fund | XLE | 5.000% | 5.6203 | 11/24/2020 |
| Technology Select Sector SPDR Fund | XLK | 5.000% | 0.9189 | 02/25/2009 |
| Health Care Select Sector SPDR Fund | XLV | 5.000% | 1.4884 | 01/28/2014 |
| Consumer Discretionary Select Sector SPDR Fund | XLY | 5.000% | 0.8216 | 02/24/2010 |
| SPDR S&P Semiconductor ETF | XSD | 5.000% | 0.2561 | 02/25/2014 |
| SPDR S&P Biotech ETF | XBI | 5.000% | 0.2001 | 04/21/2020 |
| SPDR S&P Homebuilders ETF | XHB | 5.000% | 0.7321 | 05/12/2020 |
| SPDR S&P Metals & Mining ETF | XME | 5.000% | 0.9884 | 11/17/2020 |
| SPDR S&P Oil & Gas Equipment & Services ETF | XES | 5.000% | 1.3303 | 11/17/2020 |
| SPDR S&P Oil & Gas Exploration & Production ETF | XOP | 5.000% | 2.3402 | 11/24/2020 |
| SPDR S&P Retail ETF | XRT | 5.000% | 1.0100 | 06/02/2020 |
| SPDR S&P Pharmaceuticals ETF | XPH | 5.000% | 0.4700 | 05/12/2020 |
| SPDR S&P Health Care Equipment ETF | XHE | 5.000% | 0.0000 | 09/20/2016 |
| SPDR S&P Aerospace & Defense ETF | XAR | 5.000% | 0.6264 | 12/08/2020 |
| SPDR S&P Health Care Services ETF | XHS | 5.000% | 0.2302 | 12/15/2020 |
| SPDR S&P Software & Services ETF | XSW | 5.000% | 0.2601 | 10/25/2011 |
| Communication Services Select Sector SPDR Fund | XLC | 5.000% | 0.6748 | 10/02/2018 |
* - Model Inception:1/17/2007
| ETF Name | Symbol | DWA Suggested Weighting | Yield | Date Added |
|---|---|---|---|---|
| SPDR S&P China ETF | GXC | 33.333% | 1.0353 | 07/18/2017 |
| SPDR S&P 500 ETF Trust | SPY | 33.333% | 1.5330 | 09/27/2011 |
| SPDR MSCI EAFE StrategicFactors ETF | QEFA | 33.333% | 1.8181 | 06/28/2016 |
* - Model Inception:10/28/2008
State Street Targeted Sector Rotation Model SSTARGETSECTOR
ETF Name
Symbol
DWA Suggested Weighting
Yield
Date Added
SPDR NYSE Technology ETF
XNTK
20.000%
0.2957
10/25/2016
SPDR S&P Regional Banking ETF
KRE
20.000%
2.7776
12/01/2020
SPDR S&P Semiconductor ETF
XSD
20.000%
0.2561
09/15/2020
SPDR S&P Homebuilders ETF
XHB
20.000%
0.7321
07/07/2020
SPDR S&P Software & Services ETF
XSW
20.000%
0.2601
07/31/2018
* - Model Inception: 07/28/2010
State Street Fixed Income Model SSFIXED
ETF Name
Symbol
DWA Suggested Weighting
Yield
Date Added
SPDR Bloomberg Barclays Convertible Bond ETF
CWB
25.000%
2.3441
05/19/2020
SPDR Portfolio Long Term Corporate Bond ETF
SPLB
25.000%
3.0155
04/14/2020
SPDR Wells Fargo Preferred Stock ETF
PSK
25.000%
5.0872
04/14/2020
SPDR Bloomberg Barclays International Corporate Bond ETF
IBND
25.000%
0.4512
09/01/2020
* - Model Inception: 04/27/2011
State Street (Wed.)
Loading, Please Wait...
