
As of January 13, we will no longer be publishing the weekly State Street ETF report. With that in mind, over the next few weeks, we will be reviewing the methodologies underlying each of the four SSGA strategies so that you can continue running them on your own going forward if you wish. Today, we’ll start with the State Street Sector Rotation Model (SSTREET).
As of January 13, we will no longer be publishing the weekly State Street ETF report. With that in mind, over the next few weeks, we will be reviewing the methodologies underlying each of the four SSGA strategies so that you can continue running them on your own going forward if you wish. Today, we’ll start with the State Street Sector Rotation Model SSTREET.
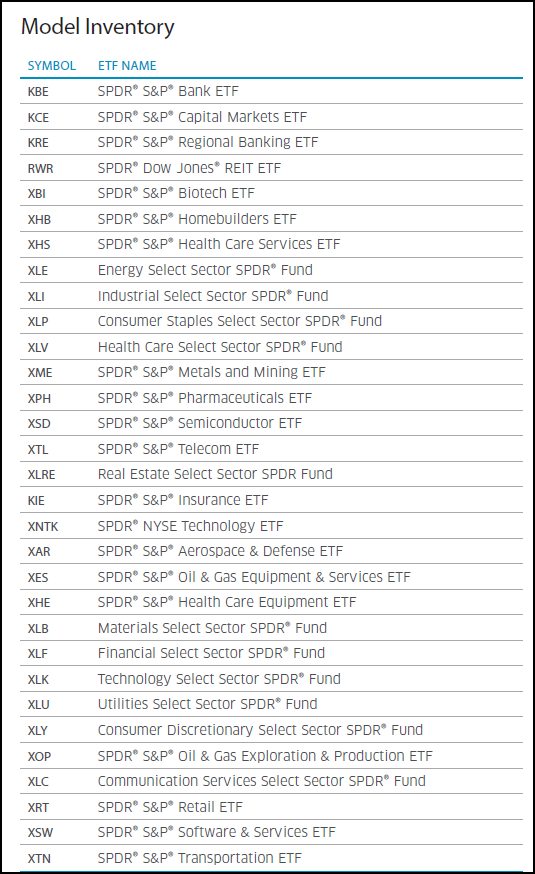
The SSTREET model uses an “RS versus benchmark” methodology, which simply means we look at each of the members within the investable universe (of which there are 31) versus a benchmark (in this case the S&P 500 Index SPX) in order to determine which are bought into the model and which remain on the sidelines. When a fund’s RS chart versus against SPX (on a 6.5% scale) to a column of X’s, denoting positive Relative Strength for that ETF, it is included in the portfolio. The ETFs are then only removed when there is a reversal into O's versus the benchmark, telling us that it has deteriorated sufficiently relative to the broad market. The inventory for the model is shown below. Currently, 20 (out of 31) ETFs in the inventory are in the model.
- Model is evaluated on a weekly basis
- Remains 100% invested
- # of holdings will vary based on sector leadership. There are 31 sector ETFs in the investable universe.
- Each week, we compare all 31 ETFs versus SPX on a 6.5% scale. All sectors with their RS charts in Xs are held in the model while all sectors with RS charts in Os remain on the sidelines.
- When there is a model change, the holdings are rebalanced back to equal weight.
- As of 12/22, there are 20 holdings weighted at 5% each.
- Year-to-date, SSTREET is up 26.77% versus SPX’s gain of 14.13%.
