Most Requested Symbols

Investors have a longstanding love-hate relationship with the month of October. Some of the more notorious market meltdowns have occurred, or at least escalated, in October. Still, the SP 500 (SPX) has had more double-digit gains in October than it has double-digit losses since 1950.
The curve has an average reading of -68.42.
Today's featured stock is Regions Financial Corporation (RF).
Comments include: ABC, APA, AVY. CLR, COP, CTRA, CVX, DAL, DAR, DELL, DVN, EQT, EVA, FANG, JPM, MOG.A, MOS, NOV, OKE, OXY, ROST, RPM, TRGP, UAL, ULTA, and WSM.
Call: McDonald's Corporation (MCD): Put: Microchip Technology Inc (MCHP); Covered Write: Regions Financial Corp (RF).
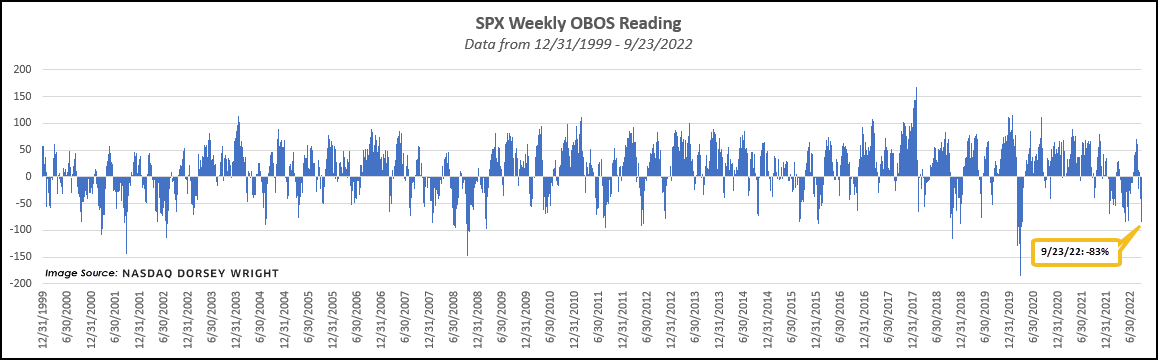
Declines across broad domestic equity indices continued Friday, with the S&P 500 Index SPX posting an intraday loss of -1.72% to bring it to a -4.65% return over the past week. Sharper declines earlier in the day led the 20-point chart of SPX to violate support previously seen at 3740 before falling to 3680 intraday. The chart now sits just a few boxes shy of the 3640 low seen in June and has given two consecutive sell signals over the past week. The sharp decline this week has also led to a weekly OBOS reading of -83% Friday, which marks one of the lowest end-of-week oversold readings for SPX since 2020. SPX has seen a reading of -83% on two prior instances this year, occurring on 5/20 and 6/17. The oversold nature of the index does suggest a heightened potential for a near-term rally, but it will remain to be seen if such a rally can be sustained.
The most recent drop for SPX led to its third 10% correction so far this year, which is tied for the most in any year dating back through 1950. To qualify in this count, the SPX needs to see a 10% decline followed by a 10% rally off that relative bottom. Other years that saw three separate 10% moves include 2008 and 1987. The first such occurrence this year came at the end of February, with that low coming on March 8. The S&P 500 then saw an 11% rally over the next three weeks, before again declining at the beginning of April. That movement saw a 20% drop ending at a bottom of 3666 on June 16, only to have the index turn around and climb 17% by August 16. The index has now seen a decline of about 14% from that date through movement Friday.
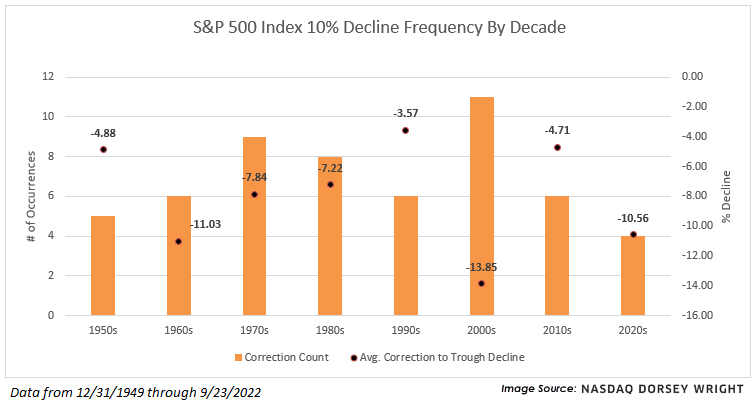
We have now seen four separate 10% corrections in the 2020s including the drop in early 2020. That compares to six such instances throughout all the 2010s. The 2000s saw significantly more corrections, at a count of eleven. Since the beginning of 1950, the S&P 500 has averaged between just under seven corrections in each decade, with those instances seeing an average correction-to-trough decline of -7.96%. Some decades, like the 1960s and 2000s, have seen double-digit correction-to-trough averages.
On the other hand, the 1990s and 2010s saw average further declines of -3.57% and -4.71%, respectively. We are currently at a 4.65% move lower from the 10% drop seen on 9/16. If we were to see a decline in line with the -7.96% average further decline since 1950 would place the index near 3580, or just beneath the bottom of the current trading band.


Do you want to take your analysis and portfolio management to the next level? Do you need to evolve your business strategies to address the ever-changing market? If so, join us from November 2nd through November 4th for the Nasdaq Dorsey Wright Fall Symposium in Richmond, VA!
The Symposium is designed specifically for financial professionals who already utilize Point & Figure and Relative Strength methodologies in their practice, as well as those who would like to learn more. Attendees have the option to add an introductory half-day session prior to the main event, designed to provide a firm understanding of the methodologies discussed over the following two days. The main seminar will start on Thursday morning, and feature a combination of lectures, small group sessions, case study work, website tutorials, and Q&A time. There will also be ample opportunities to network with other advisors. The full event will expose you to new ideas, frameworks, and tools that can help you manage your business more effectively. You will have a chance to engage with the analyst team from Nasdaq Dorsey Wright as well as seasoned peers in the business. The Symposium is pending approval for CE credit toward the CFP®, CIMA®, CPWA®, and RMA certifications.
Agenda for Optional Wednesday Sessions
Dates
Wednesday, November 2nd, 2022 – Introductory Sessions
Thursday, November 3rd and Friday, November 4th, 2022 – Advanced Sessions
Fee
Early Bird Discount of $200/person will be applied to registrations made on or before September 30th, 2022!
$1,200 per person (Advanced Sessions)
$1,400 per person (Introductory & Advanced Sessions)
*Payment will be processed upon sign-up and is inclusive of breakfast and lunch both days, the cocktail reception and dinner Thursday evening, and all training materials. Fees are non-refundable and non-transferable.
Location
The Historic Jefferson Hotel in downtown Richmond, VA
About the Jefferson Hotel: Since 1895, The Jefferson Hotel has been recognized by discerning travelers as Richmond's grandest hotel and one of the finest in America. Known for its genuinely friendly service, luxurious guestrooms, breathtaking architecture, and elegant décor, The Jefferson Hotel is reminiscent of a more gracious era. Guests of The Jefferson enjoy a variety of amenities and services, unmatched by any other luxury Richmond hotel. Visit - https://www.jeffersonhotel.com/
Travel
Everyone is responsible for their own travel arrangements and hotel reservations. A group discount is available at the Jefferson Hotel when reserved on or before October 3rd, 2022 (information provided upon registration and receipt; limited quantities available).
Last Friday, we looked at historical returns for the back half of September. Keeping with the theme and given that October is now just one week away, we wanted to discuss the tendency for investors to either love or hate the month of October.
Investors have a longstanding love-hate relationship with the month of October. Some of the more notorious market meltdowns have occurred, or at least escalated, in October; including 1978 (-9%), 1987 (-22%), and 2008 (-17%). And several of the largest one-day market declines, including Black Monday (1987) and Black Tuesday (1929), happened in October. Still, the S&P 500 (SPX) has had more double-digit gains in October than it has had double-digit losses since 1950. In fact, October is often referred to as the "bear killer," as its end ushers in the beginning of the seasonally strong six months of the year.
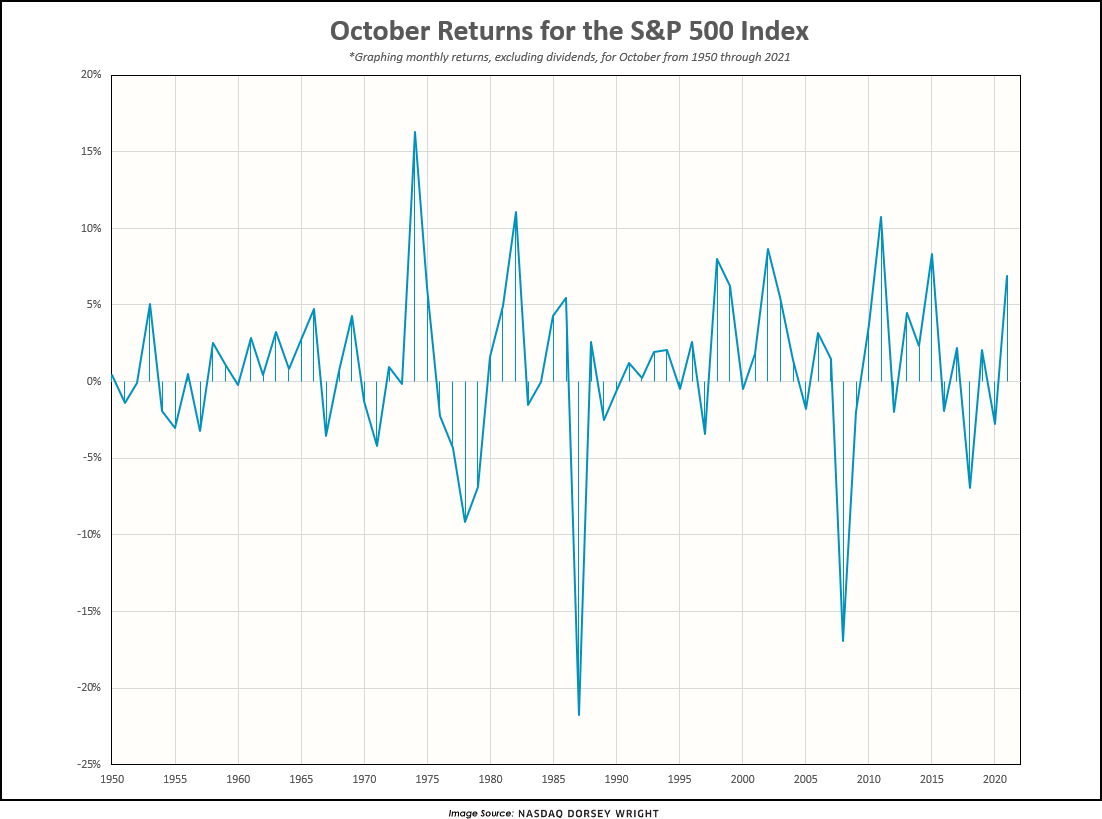
October offered some of the more meaningful buying opportunities of the post-GFC long-term bull market including 2011 and, more recently, in 2015 when the S&P 500 rallied over 8% during the month. Furthermore, the S&P was up nearly 7% last year. However, the worst October since 2008 came just four years ago in 2018 as SPX fell nearly 7%, in keeping with October’s love-hate reputation. Historically speaking, October has been positive more often than not, as the S&P 500 has logged gains in 60% of the Octobers between 1950 and 2021. The average return for the month during this time frame is +0.85%.
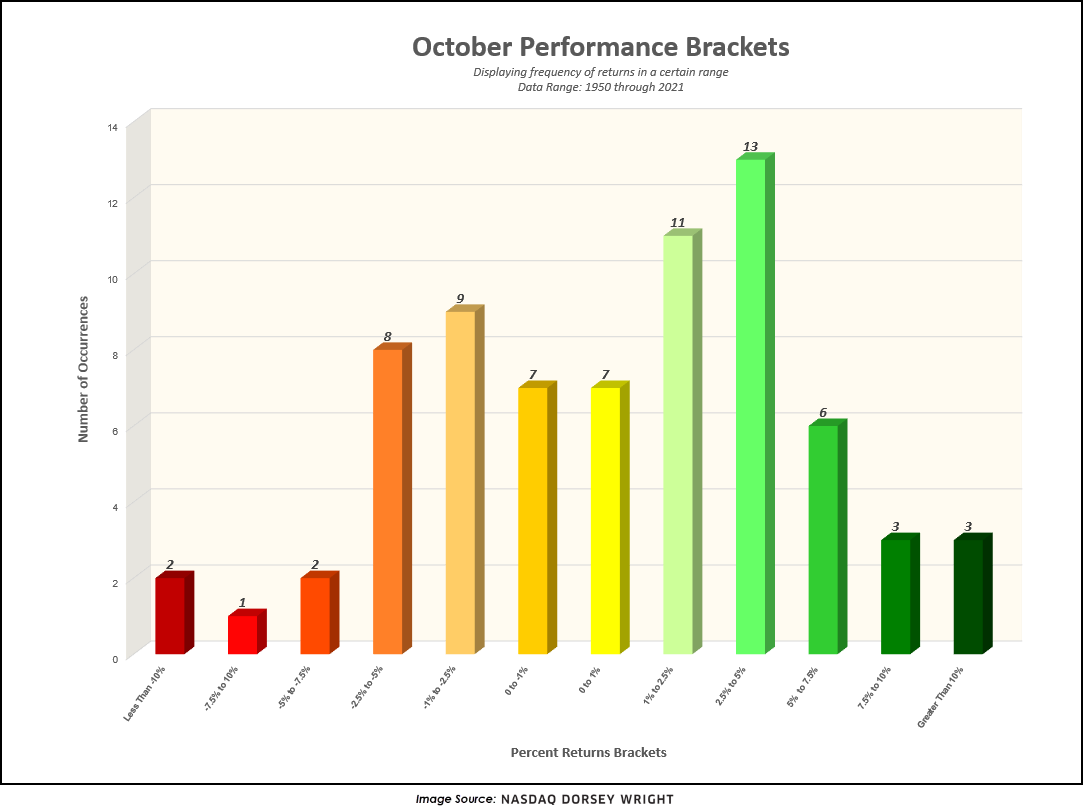
The histogram below is another visual that helps us wrap our hands around October's past behavior. It categorizes each October's return into a performance bracket, allowing us not only to see that there have been more up Octobers than down Octobers, but also the degree to which they have been up or down. If we look at the extremes, notice that only five Octobers since 1950 (including 2018) have experienced a decline in excess of -5%. The most common experience in October has been a gain in the range of 2.5% - 5%.
At the time of this writing, the S&P 500 is down over -5% for the month of September which makes the cut for the top 10 worst Septembers since data beginning in 1957. Following the 10 worst September returns, October was positive 60% of the time. When October was positive we saw an average gain of nearly 8%, and when October was negative we saw an average loss of about -5%. As mentioned before, October of 2008 posted a spectacular loss of -17% yet October of 1974 saw a gain of 16%. So, following a rough September, it would not be unusual to see volatility spill over into October.
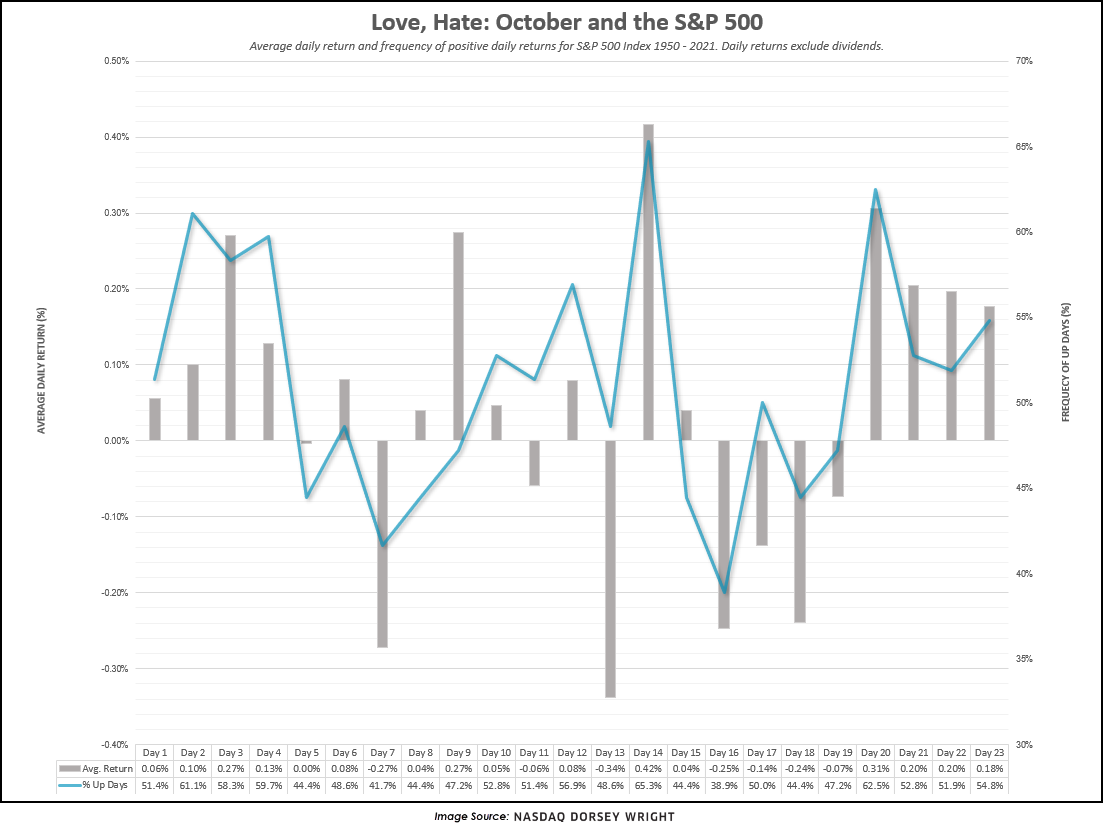
Finally, the graphic below illustrates the average daily returns of the S&P 500 Index in October going back to 1950, as well as the frequency of positive daily returns for each trading day. Historically, the month has both started and ended well, with the last four trading days of the month producing gains more times than not. The days in between have tended to produce a very different experience, with more substantial moves in both directions. However, 2022 has been a year unlike any other (by seemingly countless measurements), so there is a real possibility of deviating from historical norms.

| Symbol | Name | Price | Yield | PnF Trend | RS Signal | RS Col. | Fund Score | 200 Day MA | Weekly Mom |
|---|---|---|---|---|---|---|---|---|---|
| DIA | SPDR Dow Jones Industrial Average ETF Trust | 300.52 | 1.94 | Positive | Sell | O | 2.20 | 334.16 | -4W |
| EEM | iShares MSCI Emerging Markets ETF | 36.89 | 2.76 | Negative | Sell | O | 0.39 | 43.46 | -3W |
| EFA | iShares MSCI EAFE ETF | 58.63 | 4.88 | Negative | Sell | O | 0.43 | 69.58 | -4W |
| FM | iShares MSCI Frontier and Select EM ETF | 26.00 | 3.01 | Positive | Sell | O | 2.10 | 30.71 | -2W |
| IJH | iShares S&P MidCap 400 Index Fund | 228.92 | 1.47 | Negative | Sell | X | 3.01 | 254.70 | -4W |
| IJR | iShares S&P SmallCap 600 Index Fund | 90.81 | 1.76 | Negative | Sell | O | 1.88 | 102.86 | -4W |
| QQQ | Invesco QQQ Trust | 280.07 | 0.62 | Negative | Sell | O | 1.62 | 330.18 | -4W |
| RSP | Invesco S&P 500 Equal Weight ETF | 132.71 | 1.68 | Negative | O | 3.96 | 149.33 | -4W | |
| SPY | SPDR S&P 500 ETF Trust | 374.22 | 1.52 | Negative | Sell | O | 1.86 | 423.36 | -4W |
| XLG | Invesco S&P 500 Top 50 ETF | 283.08 | 1.17 | Positive | Sell | O | 1.84 | 324.41 | -4W |
The SPDR Dow Jones Industrial Average ETF Trust DIA printed a sell signal with this week’s action at $295, which brings it back into a negative trend on its default trend chart. The fund has a current score of 2.20 with a negative score direction of .92. The fund scores below the average US score of 2.61. Support is offered at $265 from October 2020.
The iShares MSCI Emerging Markets ETF EEM gave its ninth consecutive sell signal last week and is at a current price of $36. The fund has a very weak score at 0.39 with a -1.42 score direction and remains in a negative trend. EEM is also beneath the average non-US score of 1.37. The overall technical picture for EEM remains negative. Support is seen at $35.50 on the default chart.
The iShares MSCI EAFE ETF EFA sits in a column of O’s this week at a current price of $57. The fund has a weak score of 0.43 which is below the average non-US equity fund of 1.37 and is paired with a -1.37 score direction. The fund remains in a negative trend and on a third consecutive sell signal. Support is offered at $51 on the default chart.
The iShares MSCI Frontier and Select EM ETF FM reversed down last week and sits at a current price of $25.50. The fund has a weak fund score of 2.10 and is paired with a -1.40 score direction. The technical picture is negative, following other international equity funds lower. The fund is seen at support on the default chart at $23.00
The iShares S&P MidCap 400 Index Fund IJH remains in a column of O’s this week, falling to a price of $225. IJH has a current fund score of 3.01, which is above the average US score of 2.61. Support can be found at $220 on the default chart.
The iShares S&P SmallCap 600 Index Fund IJR reversed down into a column of O’s last week giving a sell signal and is at a current price of $88. IJR now sits with an unacceptable fund score of 1.88 and is paired with a -1.21 score direction. Initial support is offered at $85, which was last seen in 2020.
The Invesco QQQ Trust QQQ continued lower this week after giving a sell signal last week and is at a current price of $275. With last week’s movement, the fund violated its bullish support line. The recent 1.62 fund score is lower than the average US fund (2.61), and the fund holds a negative 2.44 score direction. Initial support is offered at $270.
The Invesco S&P 500 Equal Weight ETF RSP reversed down last week, giving a sell signal. This week saw RSP fall back into a negative trend. The fund is at a current price of $130 and does now hold a negative 1.22 score direction, paired with a fund score of 3.96. This beats the average S&P 500 Index fund score of 2.61 and remains the highest score of funds in this report. Support is seen at current levels, $130.
The SPDR S&P 500 ETF Trust SPY reversed down into O’s with last week's action and sits at a price of $365. Last week’s action saw SPY flip back into a negative trend. SPY has a 1.86 score posting and a now negative score direction of -1.22. Initial support is offered at current levels, $365.
The Invesco S&P 500 Top 50 ETF XLG remains in a column of O’s this week and currently sits at a price of $280. XLG has a 1.84 fund score and a negative score direction of -2.42. Like the other large-cap domestic equity funds, this mega-cap representative saw its technical picture weaken over the past several weeks, and while the return to a buy signal in August is a positive sign, further confirmation is needed before signaling a return to a more positive technical picture. Initial support is offered at $280 and further support at $250 from October 2020.
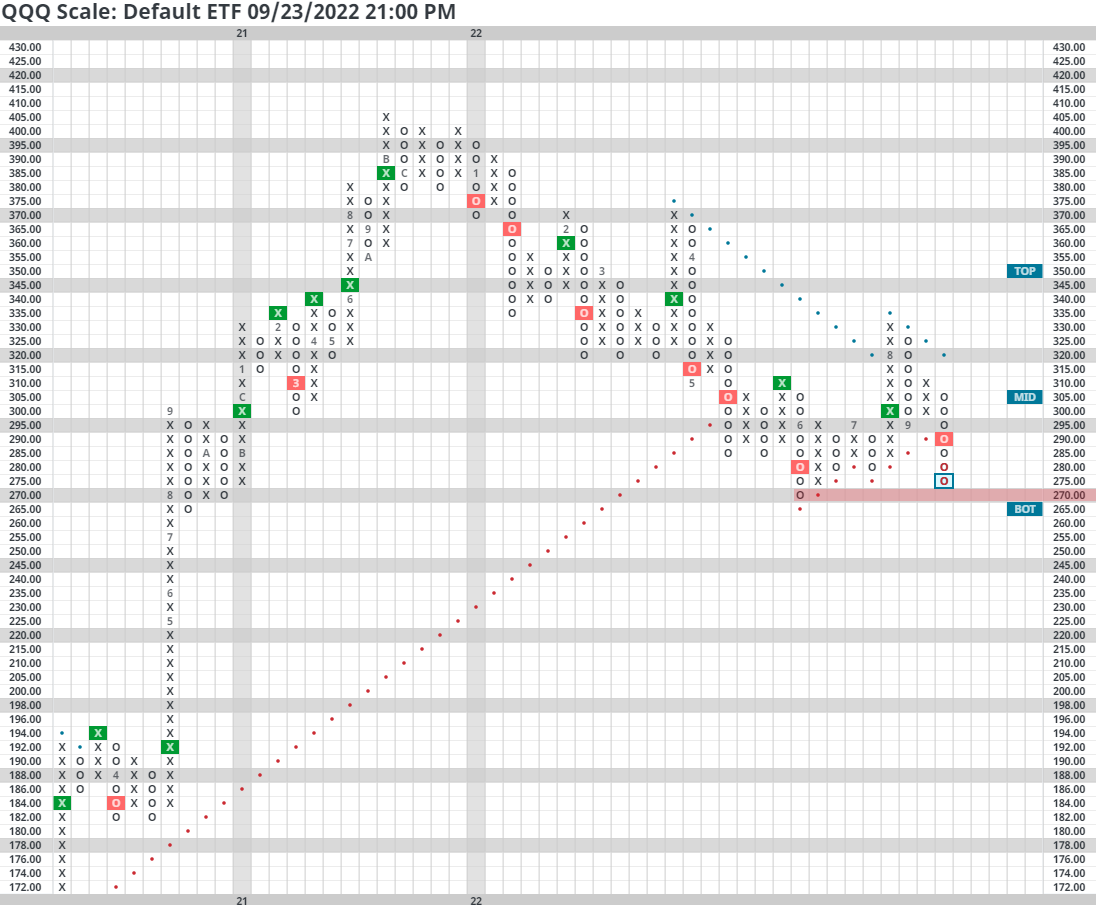
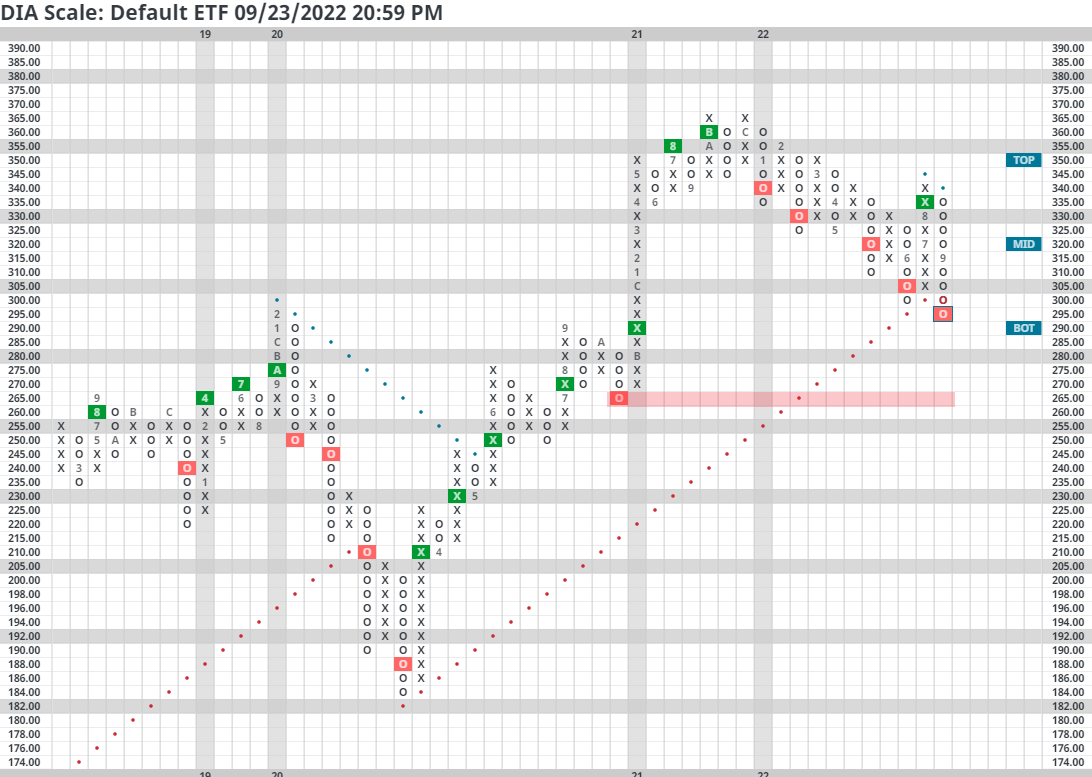
Looking at broad market representatives SPY, QQQ, and DIA, all three default point and figure trend charts are near or below key levels of 2022 support. This week's action has caused many of our major market ETF's to fall back into negative trends and test 2022 lows.
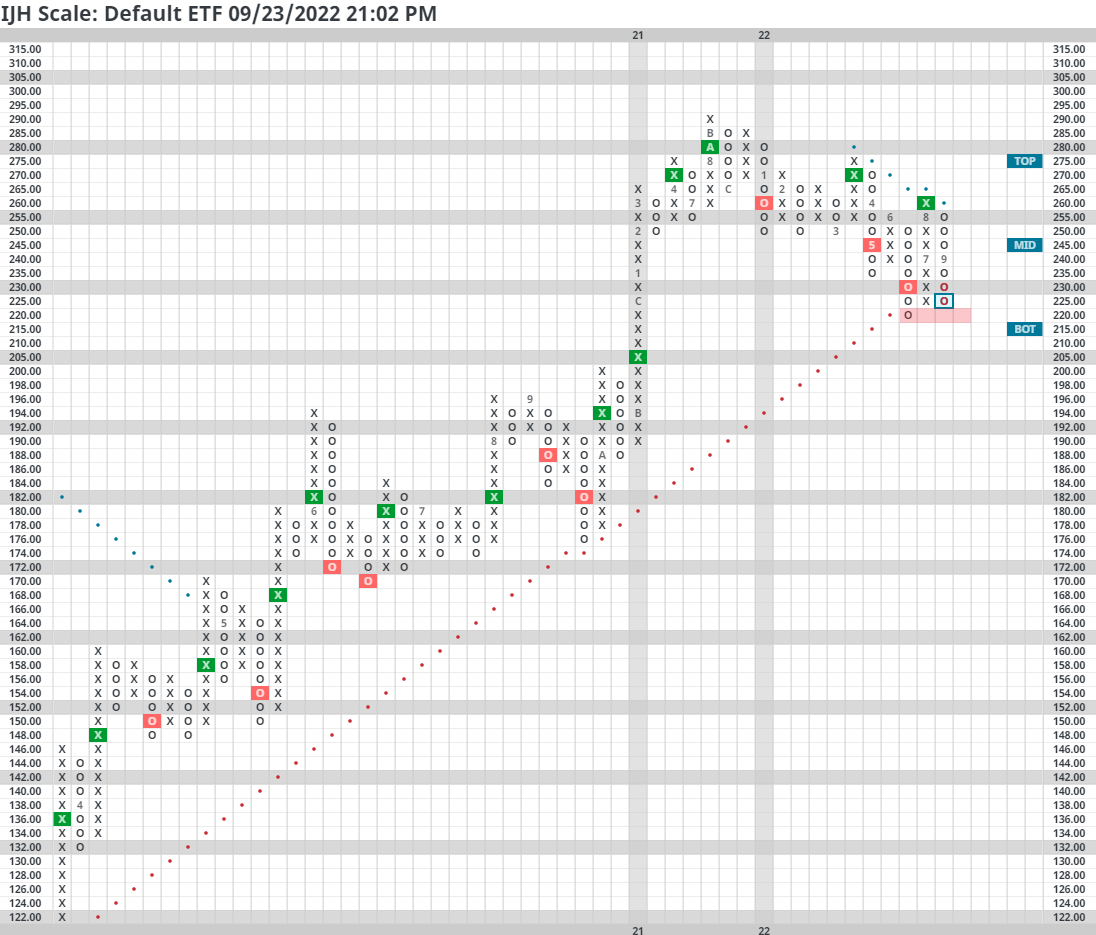
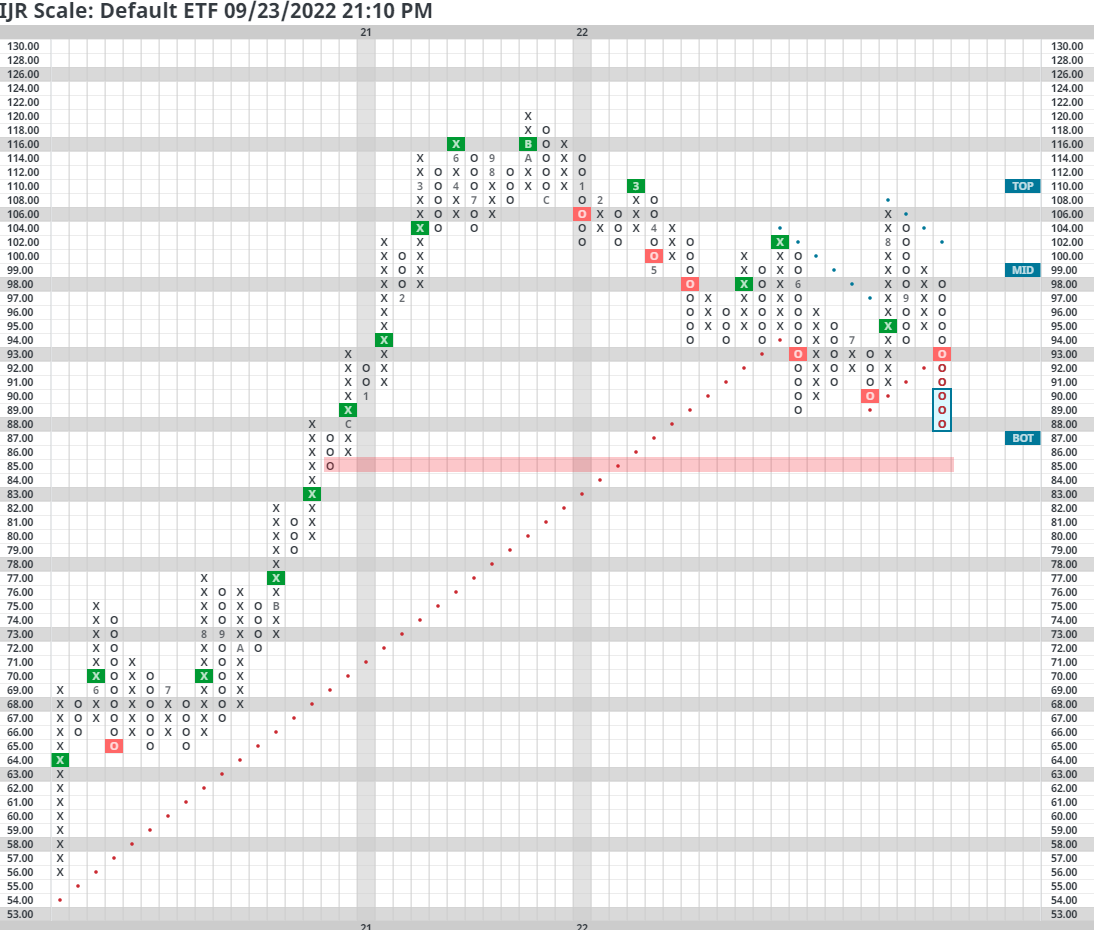
The story remains largely the same with small and mid-cap representatives IJR and IJH, which find themselves at or beneath 2022 lows.
Average Level
-68.42
| AGG | iShares US Core Bond ETF |
| USO | United States Oil Fund |
| DIA | SPDR Dow Jones Industrial Average ETF |
| DVY | iShares Dow Jones Select Dividend Index ETF |
| DX/Y | NYCE U.S.Dollar Index Spot |
| EFA | iShares MSCI EAFE ETF |
| FXE | Invesco CurrencyShares Euro Trust |
| GLD | SPDR Gold Trust |
| GSG | iShares S&P GSCI Commodity-Indexed Trust |
| HYG | iShares iBoxx $ High Yield Corporate Bond ETF |
| ICF | iShares Cohen & Steers Realty ETF |
| IEF | iShares Barclays 7-10 Yr. Tres. Bond ETF |
| LQD | iShares iBoxx $ Investment Grade Corp. Bond ETF |
| IJH | iShares S&P 400 MidCap Index Fund |
| ONEQ | Fidelity Nasdaq Composite Index Track |
| QQQ | Invesco QQQ Trust |
| RSP | Invesco S&P 500 Equal Weight ETF |
| IWM | iShares Russell 2000 Index ETF |
| SHY | iShares Barclays 1-3 Year Tres. Bond ETF |
| IJR | iShares S&P 600 SmallCap Index Fund |
| SPY | SPDR S&P 500 Index ETF Trust |
| TLT | iShares Barclays 20+ Year Treasury Bond ETF |
| GCC | WisdomTree Continuous Commodity Index Fund |
| VOOG | Vanguard S&P 500 Growth ETF |
| VOOV | Vanguard S&P 500 Value ETF |
| EEM | iShares MSCI Emerging Markets ETF |
| XLG | Invesco S&P 500 Top 50 ETF |

| Symbol | Company | Sector | Current Price | Action Price | Target | Stop | Notes |
|---|---|---|---|---|---|---|---|
| GPK | Graphic Packaging Intl. | Forest Prods/Paper | $20.80 | 21 - 23 | 26 | 18 | 5 for 5'er, #2 of 15 in favored FORE sector matrix, LT pos mkt RS, triple top, 1.3% yield |
| KDNY | Chinook Therapeutics Inc. | Biomedics/Genetics | $19.66 | 17-20 | 22 | 15 | 5 TA rating, top decile BIOM sect., cons. buy signals, pos. monthly mom. |
| ABBV | AbbVie Inc. | Drugs | $143.01 | low 150s - low 160s | 192 | 134 | 5 for 5'er, top 20% of DRUG sector matrix, 3.7% yield |
| UNH | UnitedHealth Group Incorporated | Healthcare | $517.46 | 510s - 530s | 632 | 432 | 5 for 5'er, top 25% of HEAL sector matrix, LT pos mkt RS, 1.3% yield |
| CI | CIGNA Corporation | Insurance | $282.90 | 260s - low 280s | 356 | 224 | 4 for 5'er, #3 of 67 in INSU sector matrix, new ATH, 1.6% yield |
| TMUS | T-Mobile US Inc. | Telephone | $135.05 | mid 130s - mid 140s | 172 | 120 | 5 for 5'er, #5 of 3 in TELE sector matrix. LT pos mkt RS, triple top breakout |
| MCD | McDonald's Corporation | Restaurants | $247.94 | hi 240s - mid 260s | 324 | 220 | 4 for 5'er, top third of favored REST sector matrix, LT pos mkt RS, bullish triangle, 2.15% yield |
| NOC | Northrop Grumman Systems Corporation | Aerospace Airline | $496.46 | 470s to 510s | 616 | 396 | 4 TA rating, top decile of AERO sect., spread triple top breakout, pos. wkly mom. |
| SBCF | Seacoast Banking Corporation of Florida | Banks | $31.85 | mid 30s | 47 | 29 | 5 for 5'er, 15 of 122 in favored BANK sector matrix, bearish signal reversal,1.9% yield |
| PEP | PepsiCo, Inc. | Food Beverages/Soap | $168.60 | 170s - low 180s | 230 | 152 | 4 for 5'er, top quartile of favored FOOD sector matrix, spread quintuple top, pos mon mom flip, R-R>2.0, 2.6% yield |
| CUBE | CubeSmart | Real Estate | $41.12 | low-high 40s | 72 | 38 | 4 TA rating, top half RETA sect. matrix, buy-on-pullback, 3.55% yield, R-R > 2.5. |
| TPR | Tapestry Inc. | Textiles/Apparel | $30.95 | lo-mid 30s | 46 | 26 | 5 TA rating, cons. buys, LT RS buy, buy-on-pullback, 3.44% yield. |
| SLGN | Silgan HLDG Inc | Household Goods | $43.30 | mid-to-hi 40s | 64 | 38 | 4 for 5'er, top quintile of HOUSE sector matrix, bearish signal reversal, R-R>2.5, 1.4% yield |
| HSY | The Hershey Company | Food Beverages/Soap | $225.52 | 220s - 230s | 292 | 190 | 4 for 5'er, top 10% of favored FOOD sector matrix, shakeout/triple top breakout, good R-R, 1.85% yield |
| EVH | Evolent Health | Software | $35.85 | hi 30s - low 40s | 45 | 32 | 5 for 5'er, 17 of 141 in SOFT sector matrix, LT pos trend & mkt RS, bullish catapult |
| TCOM | Trip.com Group Ltd. | Leisure | $25.60 | mid-hi 20s | 37.50 | 20 | 4 TA rating, top quintile of LEIS sector, consec. buy signals, buy-on-pullback. |
| WCN | Waste Connections, Inc. | Waste Management | $141.06 | low-to-mid $140s | 206 | 118 | 5 for 5'er, #4 of 18 in WAST sector matrix, triple top breakout, R-R>2.0 |
| ADP | Automatic Data Processing, Inc. | Business Products | $230.47 | lo 220s - hi 240s | 368 | 192 | 5 TA rating, tp third BUSI sector, LT pos. trend, buy-on-pullback, R-R > 3. |
| RF | Regions Financial Corporation | Banks | $21.31 | low 20s | 32.50 | 17.50 | 4 for 5'er, top quartile of favored BANK sector matrix, one box from RS buy signal, R-R>3.0, 3.6% yield |
| Symbol | Company | Sector | Current Price | Action Price | Target | Stop | Notes |
|---|
| Symbol | Company | Sector | Current Price | Action Price | Target | Stop | Notes |
|---|---|---|---|---|---|---|---|
| ABC | AmerisourceBergen Corporation | Drugs | $140.01 | mid 140s - mid 150s | 172 | 126 | ABC has fallen to a sell signal. OK to hold here. Maintain $126 stop. |
| GD | General Dynamics Corporation | Aerospace Airline | $228.09 | mid 220s -low 240s | 320 | 204 | GD has fallen to a sell signal. OK to hold here. Maintain $204 stop. |
| ALB | Albemarle Corp | Chemicals | $272.15 | hi 280s - low 300s | 424 | 248 | ALB has fallen to a sell signal OK to hold here. Maintain $248 stop. |
| Comment | |||||||
|---|---|---|---|---|---|---|---|
|
|
|||||||
RF Regions Financial Corporation R ($20.88) - Banks - RF is a 4 for 5'er that ranks 21st out of 122 names in the favored banks sector matrix. RF sits one box away from giving a market RS buy signal, which would elevate to 1 5 for 5'er. On its default chart, RF gave two consecutive sell signals between April and June before finding support at $18.50 for the second time before rallying to a buy signal in August. Long exposure may be added in the low $20s and we will set our initial stop at $17.50, the potential trend line violation on RF's default chart. We will use the bullish price objective, $32.50, as our target price, giving a reward-to-risk ratio north of 3.0. RF also carries a 3.6% yield.
| 17 | 18 | 19 | 20 | 21 | 22 | ||||||||||||||||||||||||||||||||||||||||||||||||
| 25.00 | X | 2 | 25.00 | ||||||||||||||||||||||||||||||||||||||||||||||||||
| 24.00 | X | 1 | O | X | O | Top | 24.00 | ||||||||||||||||||||||||||||||||||||||||||||||
| 23.00 | 5 | X | O | X | O | X | O | X | 23.00 | ||||||||||||||||||||||||||||||||||||||||||||
| 22.00 | X | X | O | A | O | X | O | O | X | 8 | 22.00 | ||||||||||||||||||||||||||||||||||||||||||
| 21.00 | • | X | O | X | O | X | X | C | 4 | X | O | X | Mid | 21.00 | |||||||||||||||||||||||||||||||||||||||
| 20.00 | X | • | • | • | X | O | X | 6 | 8 | O | X | O | X | O | 7 | 20.00 | |||||||||||||||||||||||||||||||||||||
| 19.50 | X | X | O | 5 | • | X | • | X | 4 | O | X | O | X | 5 | 6 | X | 19.50 | ||||||||||||||||||||||||||||||||||||
| 19.00 | X | O | X | O | X | O | 8 | O | • | X | 7 | X | 9 | O | X | 19.00 | |||||||||||||||||||||||||||||||||||||
| 18.50 | X | O | X | 3 | X | O | X | O | • | X | 2 | O | O | 18.50 | |||||||||||||||||||||||||||||||||||||||
| 18.00 | 1 | 2 | O | O | X | A | • | • | X | O | X | Bot | 18.00 | ||||||||||||||||||||||||||||||||||||||||
| 17.50 | X | 7 | O | B | • | C | • | X | O | X | • | 17.50 | |||||||||||||||||||||||||||||||||||||||||
| 17.00 | C | O | X | O | • | B | O | • | X | O | • | 17.00 | |||||||||||||||||||||||||||||||||||||||||
| 16.50 | X | O | X | O | X | • | • | X | X | O | • | 1 | • | 16.50 | |||||||||||||||||||||||||||||||||||||||
| 16.00 | 3 | B | O | X | O | 2 | O | X | • | X | O | X | 1 | • | X | • | 16.00 | ||||||||||||||||||||||||||||||||||||
| 15.50 | X | O | A | O | C | X | O | X | 7 | O | X | O | X | O | • | X | • | 15.50 | |||||||||||||||||||||||||||||||||||
| 15.00 | 2 | O | 8 | X | O | X | 3 | 4 | O | X | O | 9 | A | 2 | • | X | • | 15.00 | |||||||||||||||||||||||||||||||||||
| 14.50 | X | O | 5 | O | X | O | X | O | X | O | X | 8 | X | • | O | • | • | B | • | 14.50 | |||||||||||||||||||||||||||||||||
| 14.00 | C | O | X | O | X | O | 1 | O | X | 5 | • | O | X | • | O | X | • | X | • | 14.00 | |||||||||||||||||||||||||||||||||
| 13.50 | X | 4 | X | 9 | O | X | O | • | • | O | • | O | X | O | X | • | 13.50 | ||||||||||||||||||||||||||||||||||||
| 13.00 | X | O | O | X | • | • | 3 | X | O | X | • | 13.00 | |||||||||||||||||||||||||||||||||||||||||
| 12.50 | X | O | • | O | 6 | O | A | • | 12.50 | ||||||||||||||||||||||||||||||||||||||||||||
| 12.00 | X | • | • | O | X | O | X | • | 12.00 | ||||||||||||||||||||||||||||||||||||||||||||
| 11.50 | X | • | O | X | O | 8 | • | 11.50 | |||||||||||||||||||||||||||||||||||||||||||||
| 11.00 | B | • | O | X | X | X | O | X | • | 11.00 | |||||||||||||||||||||||||||||||||||||||||||
| 10.50 | A | • | O | X | O | X | O | X | 7 | X | • | 10.50 | |||||||||||||||||||||||||||||||||||||||||
| 10.00 | 6 | X | • | O | X | X | O | X | O | X | O | • | 10.00 | ||||||||||||||||||||||||||||||||||||||||
| 9.50 | X | O | 8 | • | O | X | O | X | O | X | 5 | X | • | 9.50 | |||||||||||||||||||||||||||||||||||||||
| 9.00 | 4 | O | X | • | O | X | O | X | O | O | X | • | 9.00 | ||||||||||||||||||||||||||||||||||||||||
| 8.50 | 3 | O | X | • | O | X | 4 | X | O | • | 8.50 | ||||||||||||||||||||||||||||||||||||||||||
| 8.00 | X | O | • | O | X | O | • | 8.00 | |||||||||||||||||||||||||||||||||||||||||||||
| 7.50 | X | • | O | X | 7.50 | ||||||||||||||||||||||||||||||||||||||||||||||||
| 7.00 | • | O | 7.00 | ||||||||||||||||||||||||||||||||||||||||||||||||||
| 17 | 18 | 19 | 20 | 21 | 22 |
| ABC AmerisourceBergen Corporation ($136.77) - Drugs - ABC shares moved lower today to break a spread triple bottom at $136 to mark its first sell signal. This 3 for 5'er moved to a negative trend today but has been on an RS buy signal versus the market since March 2020. ABC shares are trading in slightly oversold territory with a weekly overbought/oversold reading of -32%. From here, support is offered at $136. |
| APA Apache Corporation ($32.87) - Oil - APA fell to a sell signal on Friday when it broke a double bottom at $36. The weight of the evidence for APA remains positive as it is a 3 for 5'er. However, the stock is trading in a negative trend and ranks in the bottom half of the oil sector matrix. From here, the next level of support sits at $31. |
| AVY Avery Dennison Corporation ($165.62) - Business Products - AVY continued lower along the broad on Friday violating its trend line when it hit $168. The move will drop AVY to a 4 for 5'er. From here, the next level of support sits at $160. |
| CLR Continental Resources Inc. ($64.05) - Oil - CLR fell to a sell signal and violated its trend line on Friday when it broke a double bottom at $66. The stock continued lower taking out two additional levels of support in the mid $60s. The weight of the evidence remains positive as even with the negative trend change CLR remains a 4 for 5'er. From here, the next level of support sits at $61. |
| COP ConocoPhillips ($100.59) - Oil - COP fell to a sell signal on Friday when it broke a triple bottom at $104. The technical picture remains positive as COP is a 5 for 5'er that ranks in the top quintile of the oil sector matrix. From here, support sits at $98. |
| CTRA Coterra Energy Inc. ($26.36) - Oil - CTRA fell to a sell signal on Friday when it broke a double bottom at $26. The stock now sits just above support at $25 and its bullish support at $24. CTRA is 3 for 5'er and ranks in the top half of the oil sector matrix. |
| CVX Chevron Corporation ($144.77) - Oil - CVX fell to a sell signal on Friday when it broke a double bottom at $152 and continued lower to violate its bullish support line, a move which will drop to an unfavorable 2 for 5'er. From here, the next level of support sits at $134, CVX's July low. |
| DAL Delta Air Lines Inc. ($28.91) - Aerospace Airline - DAL broke a double bottom at $29 to return to a sell signal. The 0 for 5'er is now testing its June lows from this year. Additional support lies at $28 and $25. Continue to avoid. |
| DAR Darling Ingredients Inc. ($67.05) - Food Beverages/Soap - Shares of DAR broke a spread quadruple bottom at $72 on Friday and continued lower to $67. The stock remains a 4 for 5'er at this time but the near-term picture shows significant deterioration. The bullish support line is located at $65, so a fall below such could warrant a reduction of exposure. |
| DELL Dell Technologies Inc Class C ($35.52) - Computers - DELL fell Friday to break a double bottom at $36 before falling to $35 intraday. This 1 for 5'er moved to a negative trend and gave an RS sell signal against the market last month. Avoid long exposure. Initial overhead resistance is seen at $40. |
| DVN Devon Energy Corporation ($57.69) - Oil - DVN was down over 8.5% on Friday printing seven Os on its default chart and violating its trend line, which will drop it to 5 for 5'er. Support now sits at $54. |
| EQT EQT Corporation ($41.26) - Gas Utilities - EQT broke a triple bottom at $44 before falling to $40 and violating the bullish support line. EQT will now become a 4 for 5'er trading in a negative trend. The move also takes out support in the lower $40s that dates back to August. Support now lies at $32, the July chart low. |
| EVA Enviva Inc ($64.24) - Utilities/Electricity - EVA broke a spread triple bottom at $66, violating the bullish support line, as the stock fell to $63. EVA will now drop to a 3 for 5'er trading in a negative trend. Support for the stock now lies at $56, the July lows. |
| FANG Diamondback Energy Inc ($115.20) - Oil - FANG was down nearly 9% on Friday, giving a second consecutive sell signal and violating its trend line, which will drop it to a 3 for 5'er. From here, the next of support on FANG's chart sits at $104, the stock's 2022 low. |
| JPM J.P. Morgan Chase & Co. ($108.35) - Banks - JPM shares moved lower today to break a double bottom at $110 to mark its first sell signal. This 1 for 5'er has been in a negative trend since January and on an RS sell signal versus the market since April. JPM shares are trading in slightly oversold territory with a weekly overbought/oversold reading of -31%. From here, support is offered at $108. |
| MLM Martin Marietta Materials In ($320.05) - Building - MLM gave a third consecutive sell signal and violated its trend line on Friday when it broke a triple bottom at $324, which will drop it to an unfavorable 2 for 5'er. From here, the next level of support sits at $304. |
| MOG.A Moog Inc. ($72.73) - Aerospace Airline - MOG.A broke a triple bottom at $72 for a second sell signal. The stock remains a 3 for 5'er but is now trading at its lowest levels of 2022. Support now lies at $68, the December 2021 low. From there, support also lies in the lower-$60s. |
| MOS Mosaic Company ($48.53) - Chemicals - MOS gave a second consecutive sell signal and violated its trend line on Friday, a move which will drop to a 4 for 5'er. From here, the next level of support sits at $44. |
| NOV NOV Inc. ($15.18) - Oil Service - NOV violated its trend line on Friday when it hit $15. A move which will drop it to a 3 for 5'er. From here, the next level of support on NOV's default chart sits at $14. |
| OKE ONEOK, Inc. ($52.76) - Gas Utilities - OKE fell more than 8% on Friday, violating its trend lane and taking out multiple levels of support, including breaking a spread quintuple bottom at $52. With this move OKE has taken out al support it has found this year and will drop to a 3 for 5'er. From here, the next level of support on OXY's chart sits at $49 and dates to August of last year. |
| OXY Occidental Petroleum Corporation ($58.73) - Oil - OXY continued in Os on Friday, violating its trend line when it hit $61. The overall technical picture remains positive as OXY even with the negative trend change OXY is a favorable 4 for 5'er and ranks in the top third of the oil sector matrix. From here, support sits at $57. |
| ROST Ross Stores, Inc. ($84.07) - Retailing - ROST broke a double bottom at $86 before falling to $84, and violating the bullish support line. ROST still drop to a 1 for 5'er trading in a negative trend as the stock now lies at support at $84. Additional support can be found at $80 and $78. |
| RPM RPM, Inc. ($85.53) - Chemicals - RPM violated its trend on Friday when it fell to $85, which will drop the stock to a 3 for 5'er. RPM ranks 14th out of 52 names in the chemicals sector matrix. From here, the next level of support sits at $83. |
| TRGP Targa Resources Corp. ($59.75) - Gas Utilities - TRGP continued lower on Friday, violating its trend line at $65, which will drop to a 3 for 5'er. TRGP took out additional support in the low $60s, reaching as low at $59; from here, the next level of support sits at $56. |
| UAL United Airlines Holdings Inc. ($32.81) - Aerospace Airline - UAL broke a spread quadruple bottom at $33 for a second consecutive sell signal and a violation of the September and June lows. UAL remains a 1 for 5'er and new exposure should be avoided. Support now lies at $31, the March low, and $30, the July 2020 pullback level. |
| ULTA Ulta Beauty, Inc. ($390.60) - Retailing - ULTA broke a double bottom at $400, completing a bullish signal reversal, before falling to $388. The 4 for 5'er now sits one box above the bullish support line at $384. A move to $380 would violate the support line and drop the stock to a 3 for 5'er. Support beyond the BSL lies at $364. |
| WSM Williams-Sonoma, Inc. ($125.63) - Retailing - WSM broke a double bottom at $128 for the third consecutive sell signal. The move also violates the bullish support line and will bring the stock down to a 3 for 5'er. WSM lies at support at $126, while additional support can be found at $108, the June chart low. |
| Name | Option Symbol | Action | Stop Loss |
|---|---|---|---|
| McDonald's Corporation - $245.95 | O: 22L240.00D16 | Buy the December 240.00 calls at 15.35 | 228.00 |
| Name | Option | Action |
|---|---|---|
| Texas Roadhouse, Inc. ( TXRH) | Dec. 85.00 Calls | Stopped at 85.00 (CP: 84.08) |
| Occidental Petroleum Corporation ( OXY) | Dec. 67.50 Calls | Stopped at 62.00 (CP: 58.40) |
| Morgan Stanley ( MS) | Nov. 85.00 Calls | Stopped at 83.00 (CP: 80.63) |
| Chevron Corporation ( CVX) | Jan. 155.00 Calls | Stopped at 146.00 (CP: 144.05) |
| Name | Option Symbol | Action | Stop Loss |
|---|---|---|---|
| Microchip Technology Incorporated - $62.18 | O: 23M62.50D20 | Buy the January 62.50 puts at 6.10 | 68.00 |
| Name | Option | Action |
|---|---|---|
| Walgreens Boots Alliance Inc. (WBA) | Oct. 37.50 Puts | Raise the option stop loss to 3.85 (CP: 4.85) |
| U.S. Bancorp (USB) | Oct. 50.00 Puts | Raise the option stop loss to 6.50 (CP: 8.50) |
| Intel Corporation (INTC) | Oct. 37.50 Puts | Raise the option stop loss to 8.05 (CP: 10.05) |
| Ford Motor Company (F) | Dec. 15.00 Puts | Initiate an option stop loss of 3.00 (CP: 4.00) |
| Hasbro, Inc. (HAS) | Oct. 77.50 Puts | Initiate an option stop loss of 5.60 (CP: 7.60) |
| KeyCorp (KEY) | Oct. 20.00 Puts | Initiate an option stop loss of 2.60 (CP: 3.60) |
| Altria Group Inc. (MO) | Dec. 45.00 Puts | Raise the option stop loss to 3.10 (CP: 4.10) |
| Tyson Foods, Inc. (TSN) | Jan. 80.00 Puts | Raise the option stop loss to 8.80 (CP: 10.80) |
| Celanese Corporation (CE) | Dec. 110.00 Puts | Raise the option stop loss to 18.40 (CP: 20.40) |
| Meta Platform Inc. (META) | Dec. 160.00 Puts | Raise the option stop loss to 23.75 (CP: 25.75) |
| Ball Corporation (BALL) | Jan. 57.50 Puts | Raise the option stop loss to 7.90 (CP: 9.90) |
| General Electric Company (GE) | Dec. 75.00 Puts | Raise the option stop loss to 9.70 (CP: 11.70) |
| Medtronic PLC (MDT) | Dec. 90.00 Puts | Raise the option stop loss to 6.65 (CP: 8.65) |
| Garmin Ltd. (GRMN) | Dec. 90.00 Puts | Initiate an option stop loss of 7.70 (CP: 9.70) |
| Paypal Holdings Inc (PYPL) | Dec. 97.50 Puts | Raise the option stop loss to 13.15 (CP: 15.15) |
| CBRE Group, Inc. (CBRE) | Dec. 75.00 Puts | Initiate an option stop loss of 4.80 (CP: 6.80) |
| The Walt Disney Company (DIS) | Dec. 105.00 Puts | Initiate an option stop loss of 8.15 (CP: 10.15) |
| Royal Caribbean Cruises Ltd. (RCL) | Jan. 45.00 Puts | Initiate an option stop loss of 5.25 (CP: 7.25) |
| Name | Option Sym. | Call to Sell | Call Price | Investment for 500 Shares | Annual Called Rtn. | Annual Static Rtn. | Downside Protection |
|---|---|---|---|---|---|---|---|
| Regions Financial Corporation $21.31 | O: 23A22.00D20 | Jan. 22.00 | 1.10 | $9,999.90 | 27.47% | 13.50% | 4.22% |
| Name | Action |
|---|---|
| Plug Power Inc. (PLUG) - 23.94 | Sell the November 27.50 Calls. |
| Livent Corp. (LTHM) - 31.61 | Sell the January 40.00 Calls. |
| Marathon Oil Corporation (MRO) - 24.59 | Sell the January 26.00 Calls. |
| Mosaic Company (MOS) - 52.52 | Sell the January 60.00 Calls. |
| Occidental Petroleum Corporation (OXY) - 61.88 | Sell the January 65.00 Calls. |
| Name | Covered Write |
|---|---|
| Sunrun Inc ( RUN - 32.50 ) | November 40.00 covered write. |
| Cenovus Energy Inc. ( CVE - 17.08 ) | December 19.00 covered write. |
| Devon Energy Corporation ( DVN - 63.12 ) | January 75.00 covered write. |
Daily Equity & Market Analysis
NDW MORNING UPDATE
Dec 12, 2025
Loading, Please Wait...
