
Portfolio View - Major Market ETFs
| Symbol | Name | Price | Yield | PnF Trend | RS Signal | RS Col. | Fund Score | 200 Day MA | Weekly Mom |
|---|---|---|---|---|---|---|---|---|---|
| DIA | SPDR Dow Jones Industrial Average ETF Trust | 300.52 | 1.94 | Positive | Sell | O | 2.20 | 334.16 | -4W |
| EEM | iShares MSCI Emerging Markets ETF | 36.89 | 2.76 | Negative | Sell | O | 0.39 | 43.46 | -3W |
| EFA | iShares MSCI EAFE ETF | 58.63 | 4.88 | Negative | Sell | O | 0.43 | 69.58 | -4W |
| FM | iShares MSCI Frontier and Select EM ETF | 26.00 | 3.01 | Positive | Sell | O | 2.10 | 30.71 | -2W |
| IJH | iShares S&P MidCap 400 Index Fund | 228.92 | 1.47 | Negative | Sell | X | 3.01 | 254.70 | -4W |
| IJR | iShares S&P SmallCap 600 Index Fund | 90.81 | 1.76 | Negative | Sell | O | 1.88 | 102.86 | -4W |
| QQQ | Invesco QQQ Trust | 280.07 | 0.62 | Negative | Sell | O | 1.62 | 330.18 | -4W |
| RSP | Invesco S&P 500 Equal Weight ETF | 132.71 | 1.68 | Negative | O | 3.96 | 149.33 | -4W | |
| SPY | SPDR S&P 500 ETF Trust | 374.22 | 1.52 | Negative | Sell | O | 1.86 | 423.36 | -4W |
| XLG | Invesco S&P 500 Top 50 ETF | 283.08 | 1.17 | Positive | Sell | O | 1.84 | 324.41 | -4W |
Additional Comments:
The SPDR Dow Jones Industrial Average ETF Trust DIA printed a sell signal with this week’s action at $295, which brings it back into a negative trend on its default trend chart. The fund has a current score of 2.20 with a negative score direction of .92. The fund scores below the average US score of 2.61. Support is offered at $265 from October 2020.
The iShares MSCI Emerging Markets ETF EEM gave its ninth consecutive sell signal last week and is at a current price of $36. The fund has a very weak score at 0.39 with a -1.42 score direction and remains in a negative trend. EEM is also beneath the average non-US score of 1.37. The overall technical picture for EEM remains negative. Support is seen at $35.50 on the default chart.
The iShares MSCI EAFE ETF EFA sits in a column of O’s this week at a current price of $57. The fund has a weak score of 0.43 which is below the average non-US equity fund of 1.37 and is paired with a -1.37 score direction. The fund remains in a negative trend and on a third consecutive sell signal. Support is offered at $51 on the default chart.
The iShares MSCI Frontier and Select EM ETF FM reversed down last week and sits at a current price of $25.50. The fund has a weak fund score of 2.10 and is paired with a -1.40 score direction. The technical picture is negative, following other international equity funds lower. The fund is seen at support on the default chart at $23.00
The iShares S&P MidCap 400 Index Fund IJH remains in a column of O’s this week, falling to a price of $225. IJH has a current fund score of 3.01, which is above the average US score of 2.61. Support can be found at $220 on the default chart.
The iShares S&P SmallCap 600 Index Fund IJR reversed down into a column of O’s last week giving a sell signal and is at a current price of $88. IJR now sits with an unacceptable fund score of 1.88 and is paired with a -1.21 score direction. Initial support is offered at $85, which was last seen in 2020.
The Invesco QQQ Trust QQQ continued lower this week after giving a sell signal last week and is at a current price of $275. With last week’s movement, the fund violated its bullish support line. The recent 1.62 fund score is lower than the average US fund (2.61), and the fund holds a negative 2.44 score direction. Initial support is offered at $270.
The Invesco S&P 500 Equal Weight ETF RSP reversed down last week, giving a sell signal. This week saw RSP fall back into a negative trend. The fund is at a current price of $130 and does now hold a negative 1.22 score direction, paired with a fund score of 3.96. This beats the average S&P 500 Index fund score of 2.61 and remains the highest score of funds in this report. Support is seen at current levels, $130.
The SPDR S&P 500 ETF Trust SPY reversed down into O’s with last week's action and sits at a price of $365. Last week’s action saw SPY flip back into a negative trend. SPY has a 1.86 score posting and a now negative score direction of -1.22. Initial support is offered at current levels, $365.
The Invesco S&P 500 Top 50 ETF XLG remains in a column of O’s this week and currently sits at a price of $280. XLG has a 1.84 fund score and a negative score direction of -2.42. Like the other large-cap domestic equity funds, this mega-cap representative saw its technical picture weaken over the past several weeks, and while the return to a buy signal in August is a positive sign, further confirmation is needed before signaling a return to a more positive technical picture. Initial support is offered at $280 and further support at $250 from October 2020.
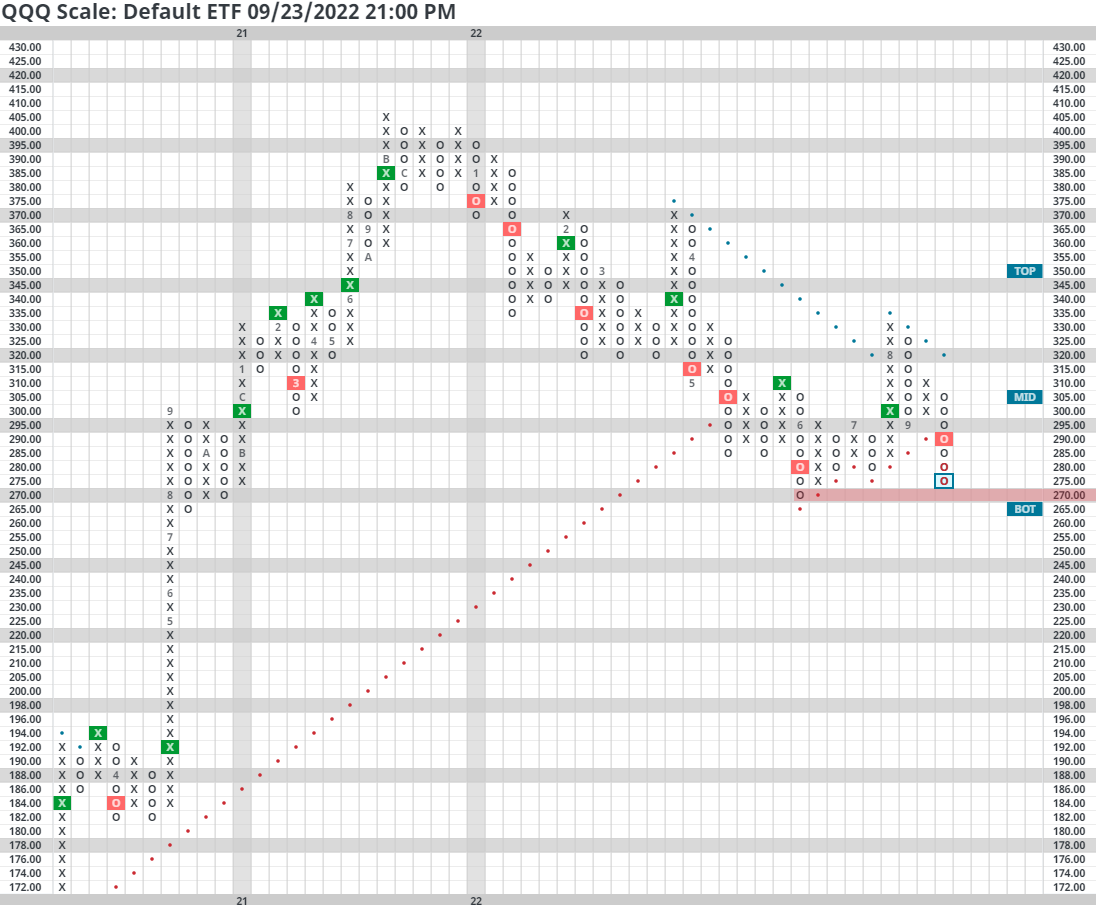
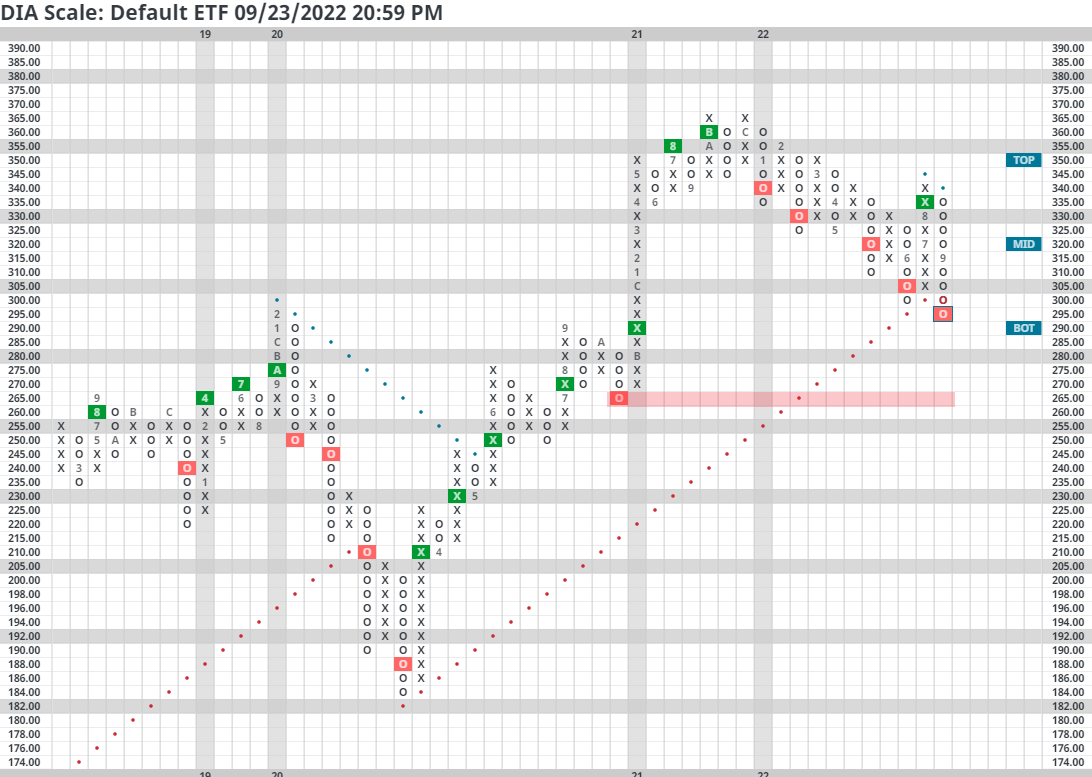
Looking at broad market representatives SPY, QQQ, and DIA, all three default point and figure trend charts are near or below key levels of 2022 support. This week's action has caused many of our major market ETF's to fall back into negative trends and test 2022 lows.
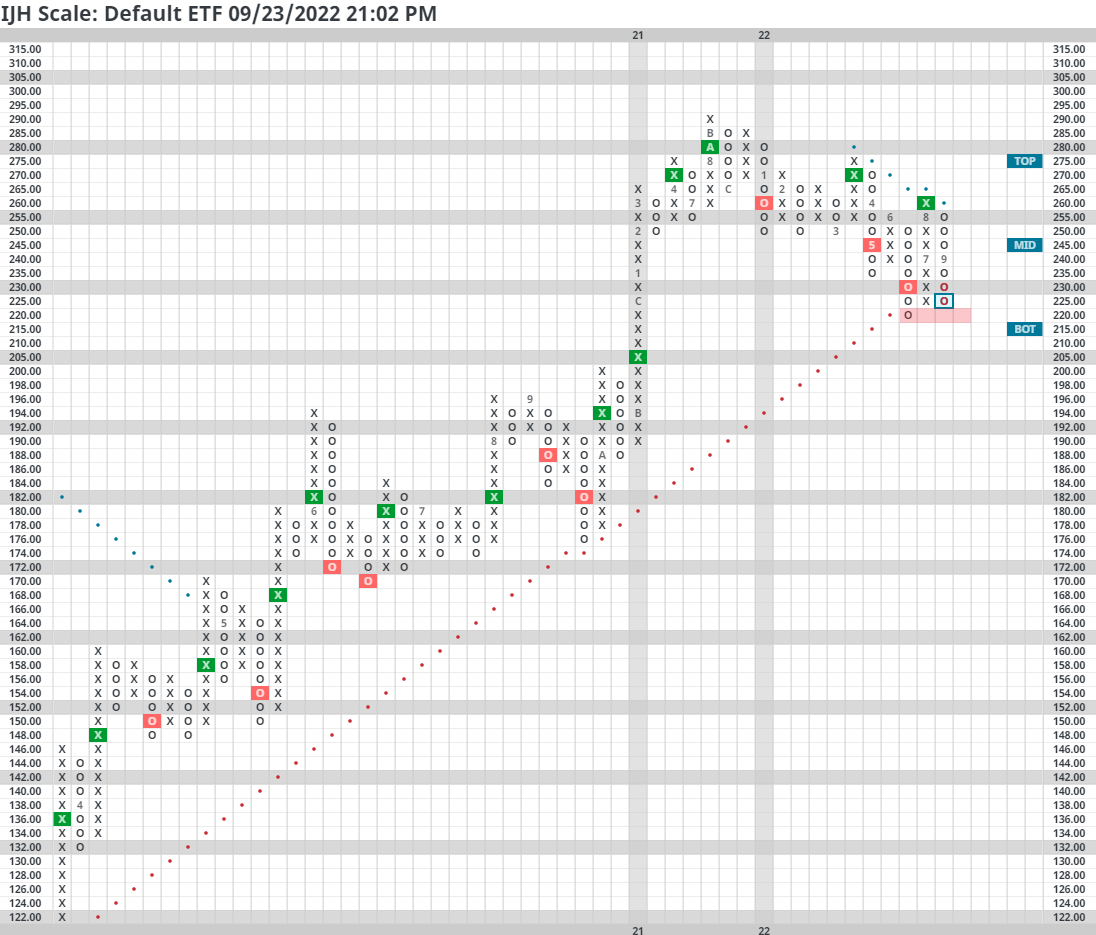
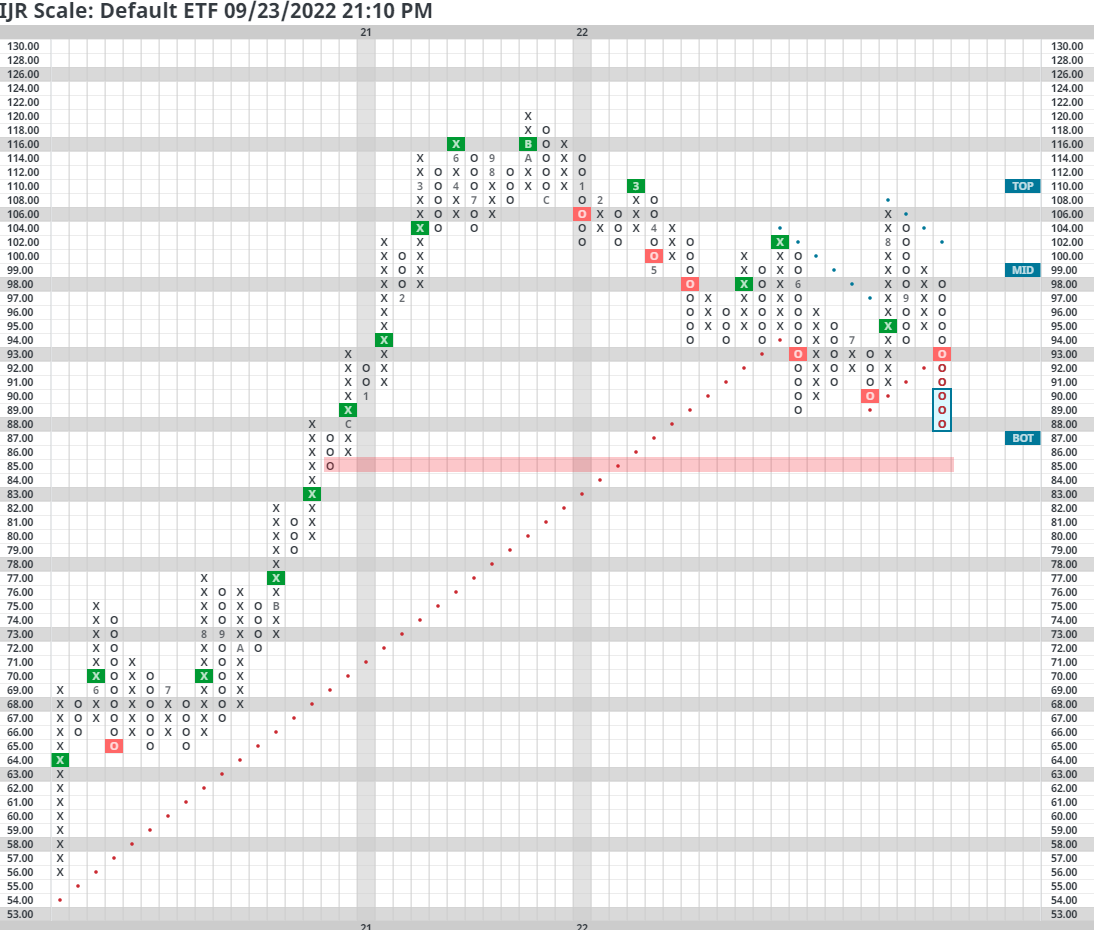
The story remains largely the same with small and mid-cap representatives IJR and IJH, which find themselves at or beneath 2022 lows.
