
Most Requested Symbols

Each year, we produce 12 articles throughout the last few weeks of the year, all revolving around one central concept. In the past, we have used this series to discuss anything from the basics of Point & Figure and Relative Strength to themes to know in the coming year. This year, all 12 articles will revolve around the topic of "Enhancing Your Process With Scalable Customization in 2021."
Today's featured stock is Social Capital Hedosophia Holdings Corp (IPOB).
ALLK, ISRG, BC, HZO, MTOR, ADBE, WDC, SEAS, LPSN, & CXO.
Call: United Parcel Service (UPS); Put: HUYA Inc (HUYA); Covered Write: Synovus Financial (SNV).
We are excited to announce phase three of the Nasdaq Dorsey Wright Model Builder with the launch of Matrix and FSM-based Relative Strength (RS) Testing Service. As part of this launch, we are granting you free access to the service for the remainder of 2020. The tool is designed to help you more easily design, test, implement, and monitor custom models powered by the Nasdaq Dorsey Wright methodology. Please see below for replays of our latest webinar series covering the different aspects of the tool.
11/19/2020: Static Model Builder Demo Replay - Click Here
12/9/2020: Matrix Model Builder Demo Replay - Click here
11/5/2020: FSM Model Builder Demo Replay - Click here
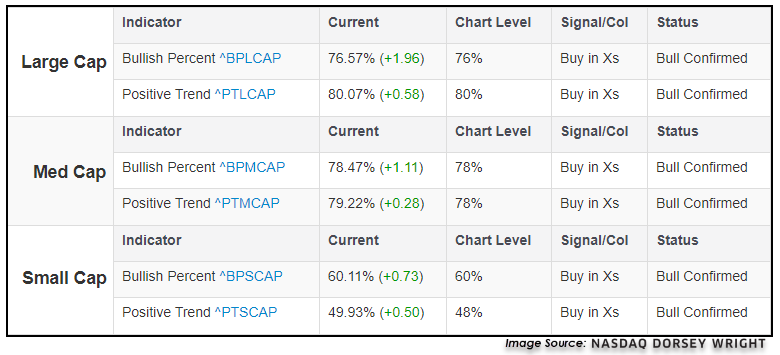
The increasing participation across the domestic equity market can be seen throughout many of the major domestic equity indicators found on the Technical Indicator Reports page, such as the Bullish Percent for NYSE ^BPNYSE and the Positive Trend for NYSE ^PTNYSE, which we referenced in this past Wednesday's Were You Aware. The participation between different size and style classifications can be separated out using the “Styles” selection in the Technical Indicator Reports page in order to dive deeper into different aspects of the domestic equity market. In looking at the three main size breakdowns of large-, mid-, and small-cap names, we see that bullish percent charts for large-caps ^BPLCAP and mid-cap equities ^BPMCAP each show elevated bullish percent levels of 76% and 78%, respectively. The positive trend charts for large-caps ^PTLCAP and mid-caps ^PTMCAP each also reside in high field positions at respective levels of 80% and 78%. The small-cap space still shows lower levels, however, despite the rapid near-term improvement. The Bullish Percent for Small Cap ^BPSCAP sits at 60%, while the Positive Trend for Small Cap sits at 48%.
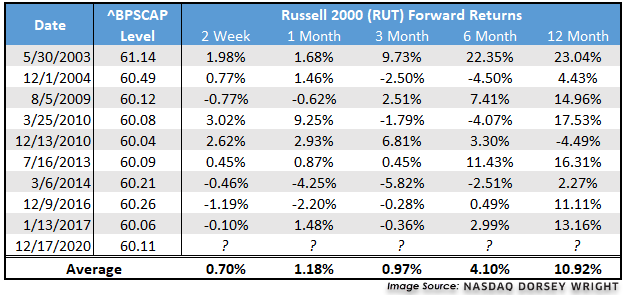
Looking at the history of the BPSCAP chart provides some insight into this assumed lack of follow-through, as we can see it is actually quite rare to have a chart level of 60% or higher. In fact, throughout the full history of the indicator dating back to April 2001, the indicator has never reached 80%, and there have only been 11 timeframes that saw the indicator move above 60% which make up only 11% of the trading days. This most recent instance occurred as a result of market trading Thursday, marking the first time the indicator has been at 60% since December 2016. If we remove the dot-com bubble induced decline in participation seen in 2002, the Russell 2000 has shown positive average forward returns after the indicator reaches 60% over a forward 2-week, 1-month, 3-month, 6-month, and 12-month timeframe. These average returns also generally improve as the timeframe expands, indicating the potential for further improvement for the small-cap equity space. Those looking for further follow-through should also monitor the ^PTSCAP, which has yet to advance above 50%.

Over the last decade, the advisory business has continued to evolve rapidly with the growing trends of lower fees and increased automation. With the influx of low-cost index funds and Robo-advisors offering nearly-free financial planning, investors can now gain beta market exposure at rock-bottom prices without ever setting foot in an advisor's office. The upshot is that it is now more challenging than ever for you as a traditional financial advisor to justify your fee and grow your client base. That said, you must scale your process and sharpen your value proposition as much as possible. To help you do just that, this year's 12 Days of Christmas Series, "Enhancing Your Process With Scalable Customization in 2021," will navigate you through the benefits, use/implementation, and customization of rules-based, Relative Strength-driven guided model portfolios. Additionally, this series will highlight the NDW Model Builder Tool's new features, providing relevant use-cases to help you scale your business in the coming year.
Day 1 - Benefits of Models and a Rules-Based Process
Day 2 - The Relative Strength Process
Day 3 - Model Foundations - The Relative Strength Matrix
Day 4 - Model Foundations – Technical Attributes and the Fund Score Method (FSM)
In continuing with our Relative Strength and Relative Strength matrix tool discussions from earlier in the week, today in Day 5 of our series, we will review the various RS-based methodologies that underlie most of the guided stock and ETF models available on the NDW Research Platform. First, we will review the strategies behind the various stock models offered, followed by a review of those that drive the lineup of ETF models. Note that we will discuss the Fund Score Method (FSM) models on Monday (Day 6) followed by a review of DALI and the DALI-based models on Tuesday (Day 7). It is important to remember that while the various models on the NDW Research Platform vary slightly from strategy to strategy based on different themes, objectives, and starting universes, the same emotionless Relative Strength ranking process underlies each.
Part 1 - Stock Models
When speaking with advisors over the years, we've found that one of the more challenging areas to incorporate a disciplined, systematic approach is managing individual equities. Clients are often attached to their positions, whether it's a brand they love or their grandfather's favorite holding. In some cases, the simple act of selling something more tangible, like a stock, is more challenging than selling an ETF, for example. The lineup of stock models offered on the NDW Research Platform arms subscribers with over 45 guided portfolios for those advisors looking to implement a scalable rules-based process for selecting individual equities. The lineup of NDW stock models can be found on the Models page under the Models & Products menu and spans different sectors, high-yielding stocks, as well as international markets. We even offer a "model of models" through the DWA Sector Stock Model, which we'll discuss below. Many of the stock models can be used to enhance clients' equity exposure and can also be used as companions to an existing mutual fund or ETF equity portfolio. For those managing a tactical core-portfolio with satellite positions, some of the stock models, such as the Sector Stock Model or the Blue Chip Growth Model, can be used as satellite sleeves, while the ESG Top 20 Model could be used to enhance the core.
ESG Top 10 Stock Model ESG10.TR
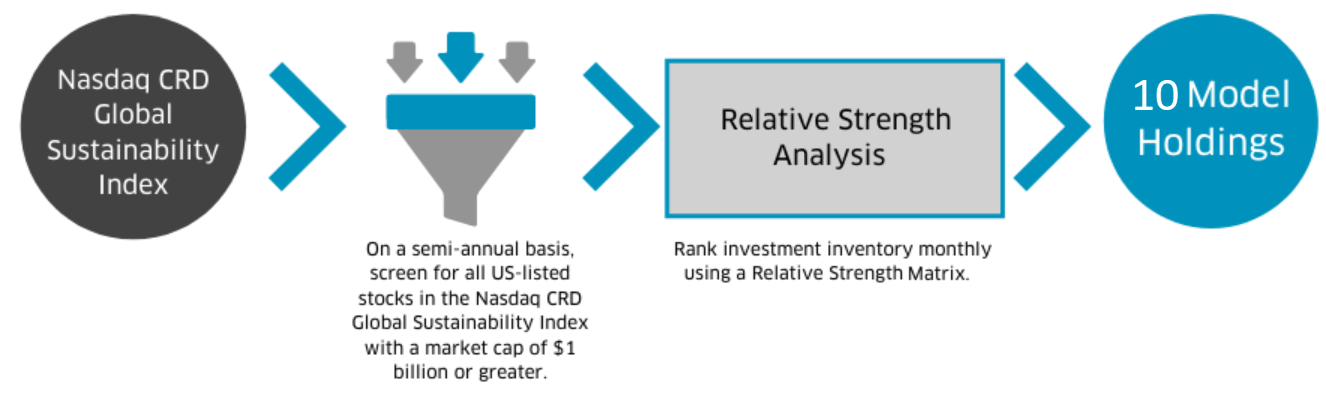
The ESG Top 10 Model is the newest addition to our stock model lineup. For those unfamiliar with the ESG acronym, Investopedia defines ESG as, "environmental, social and governance (ESG) criteria are a set of standards for a company’s operations that socially conscious investors use to screen potential investments. Environmental criteria consider how a company performs as a steward of nature. Social criteria examine how it manages relationships with employees, suppliers, customers, and the communities where it operates. Governance deals with a company’s leadership, executive pay, audits, internal controls, and shareholder rights." Combining an outside factor such as third-party ESG research and screenings with a technical overlay allows us to "play the piano with both hands". Some further points on the underlying process behind the ESG Top 10 Stock Model are listed below, along with a link to further information included in the model’s information file.
ESG Top 10 Stock Model Process:
Blue Chip Growth Stock Model BLUECHIP.TR
The Blue Chip Growth Model (TR) BLUECHIP.TR was designed to be a satellite allocation for those investors seeking individual equity exposure in a systematic manner. This model universe consists of 30 large-cap publicly owned companies trading on the NYSE and Nasdaq. Using total return data, all of the constituents in the inventory are ranked each month using a Relative Strength Matrix to determine inclusion within the model. The top five ranked stocks are held and are only removed if they fall into the bottom half of the ranking upon a future evaluation. If a stock falls sufficiently out of favor versus the other members of the inventory, that stock is sold and replaced with the next top-ranked stock that is not already held within the model. Regardless of a model change, if the allocation of any position falls below 10% or becomes greater than 30% at the time of the monthly evaluation, then the portfolio is rebalanced to equal weight the five constituents at 20% each. If the allocation collars are not breached then the model changes are completed using the replacement method.
Blue Chip Growth Model Process:

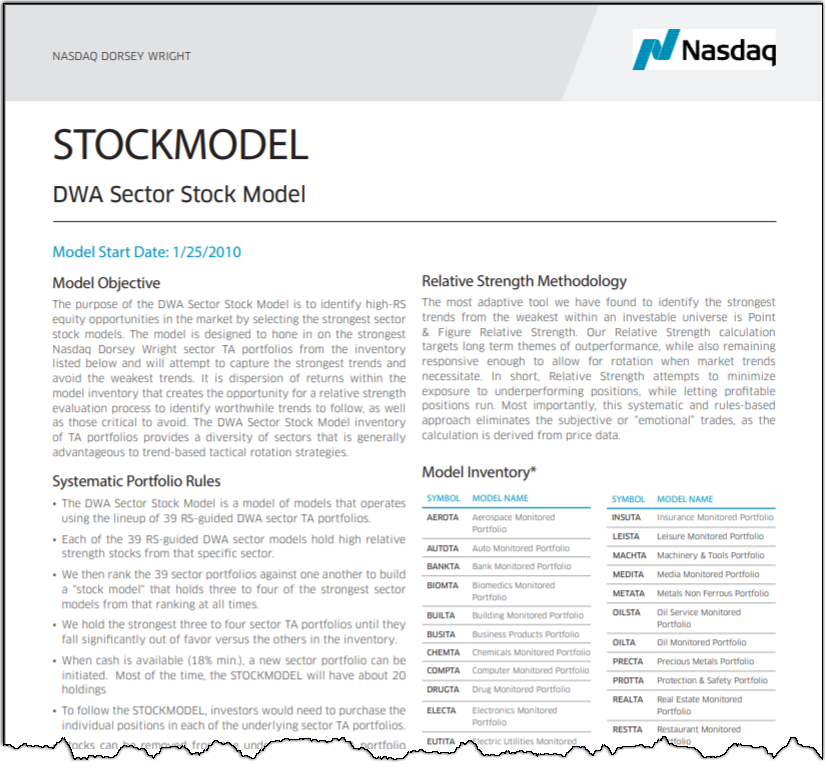
DWA Sector Stock Model STOCKMODEL
The stock final model we will reference today is the DWA Sector Stock Model STOCKMODEL, which we earlier referenced as the “model of models” portfolio you have the opportunity to follow. In addition to the broader stock models like the ones we are highlighting today, we also have individual sector portfolios for 39 of the DWA sectors we track on our platform, with each holding four to five highly ranked stocks from that specific sector at all times. The DWA Sector Stock Model is designed to identify high-RS equity opportunities by selecting the strongest of these stock sector models based upon a matrix ranking of the individual sector portfolios. In essence, this is a model of models that operates out of the lineup of RS-guided DWA stock models in our matrix tools area. We rank the sector portfolios against one another and have structured the DWA Sector Stock Model to seek investment in three to four of the strongest sector models from that ranking at all times. It's important to note that positions can be trimmed. For instance, if a position is up 100%, it is trimmed by 50%. When a position is trimmed, if its weighting is below 15%, the entire position is sold. In addition, when cash is available (18% min.) a new sector portfolio can be initiated. Most of the time, the model will have about 20 holdings, but this would be dependent on how many holdings each of the underlying portfolios has. As an example, the STOCKMODEL currently has exposure to 18 names. For further information on the construction or methodology behind the DWA Sector Stock Model, please see the model’s information file.
Part 2 - ETF Models
Like the stock models offered, we currently provide over 40+ guided ETF models covering domestic equity sectors, size and style boxes, commodities, fixed income, and international equities. The ETF models work much like the stock models do, providing guidance for selecting technically strong securities within a defined group. However, while the stock models are almost universally matrix-based, there are a few additional varieties of ETF models like tally ranking and RS vs benchmark, as well as ETF models with built-in defense mechanisms. While the majority of the stock models are designed to be used as a sleeve within the equity allocation of a portfolio as many of them have only five or 10 holdings, many of our ETF models can be used as the core exposure for a particular asset class. By combining two or three of these models, you can quickly create a custom portfolio solution that utilizes Relative Strength, thereby providing an opportunity for alpha generation with the added benefit of being scalable across multiple client accounts with ease.
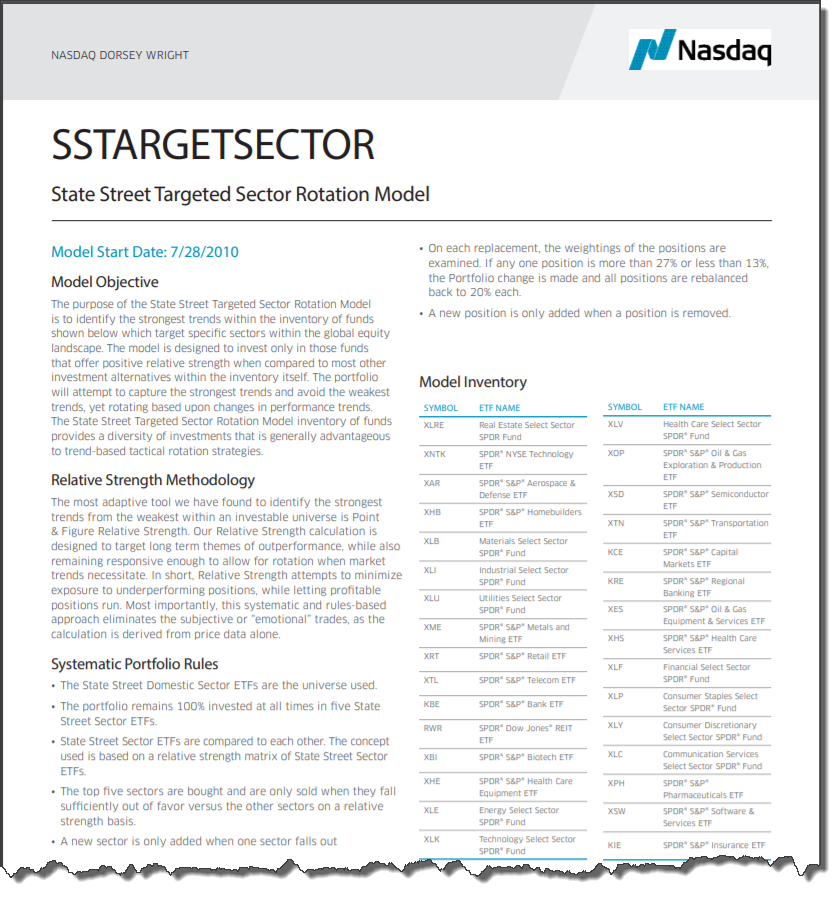
Matrix Method Example - State Street Targeted Sector Rotation ETF Model SSTARGETSECTOR
Similar to the stock models, many of the ETF models utilize a Relative Strength matrix and are designed to own the strongest sectors, countries, or styles from their respective inventories. These models typically remain fully-invested and will continue to allocate to the strongest ETFs until they fall significantly out of favor versus the rest of the universe. If a current holding falls out of favor in the model matrix, upon review, the model will then add the highest-ranked fund that is not currently held in the portfolio. One popular matrix-based ETF model is the State Street Targeted Sector Rotation Model SSTARGETSECTOR. As you'll remember from Day 3's Relative Strength Matrix review, matrix-based means that the model compares and ranks every fund in the inventory to one another using an RS matrix. The inventory is made up of 32 State Street sector and subsector funds, of which the model holds the strongest five funds.
State Street Targeted Sector Rotation Model Process
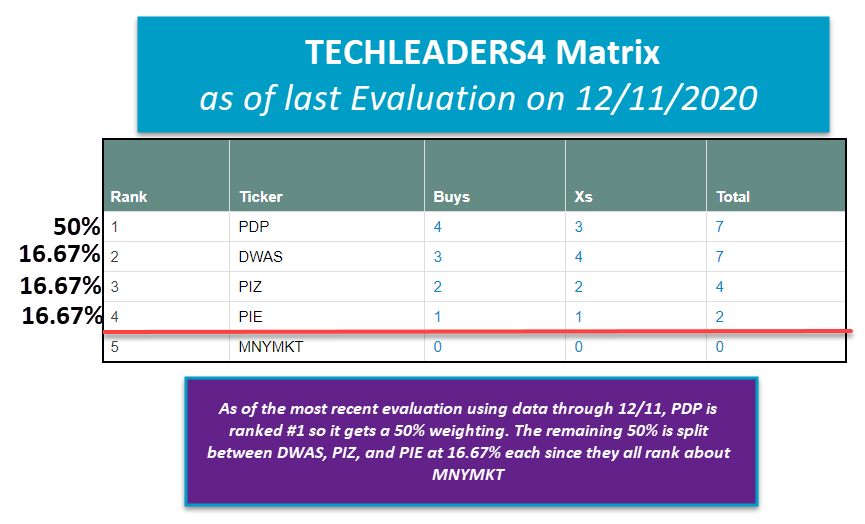
Matrix Method + Defensive Component Example - DWA Global Technical Leaders ETF Portfolio TECHLEADERS4
The DWA Global Technical Leaders Model is designed to gain exposure to the strongest Relative Strength stocks in the US and international markets through the use of four Invesco DWA momentum ETFs: the Invesco DWA Momentum ETF PDP, the DWA SmallCap Momentum ETF DWAS, the Invesco DWA Emerging Markets Momentum ETF PIE, and the Invesco DWA Developed Markets Momentum ETF PIZ. Weights in the ETFs will vary based upon their ranking in the model's Relative Strength matrix. When equities are not in favor, the portfolio can raise varying amounts of cash, up to 100%.
TECHLEADERS4 Process:
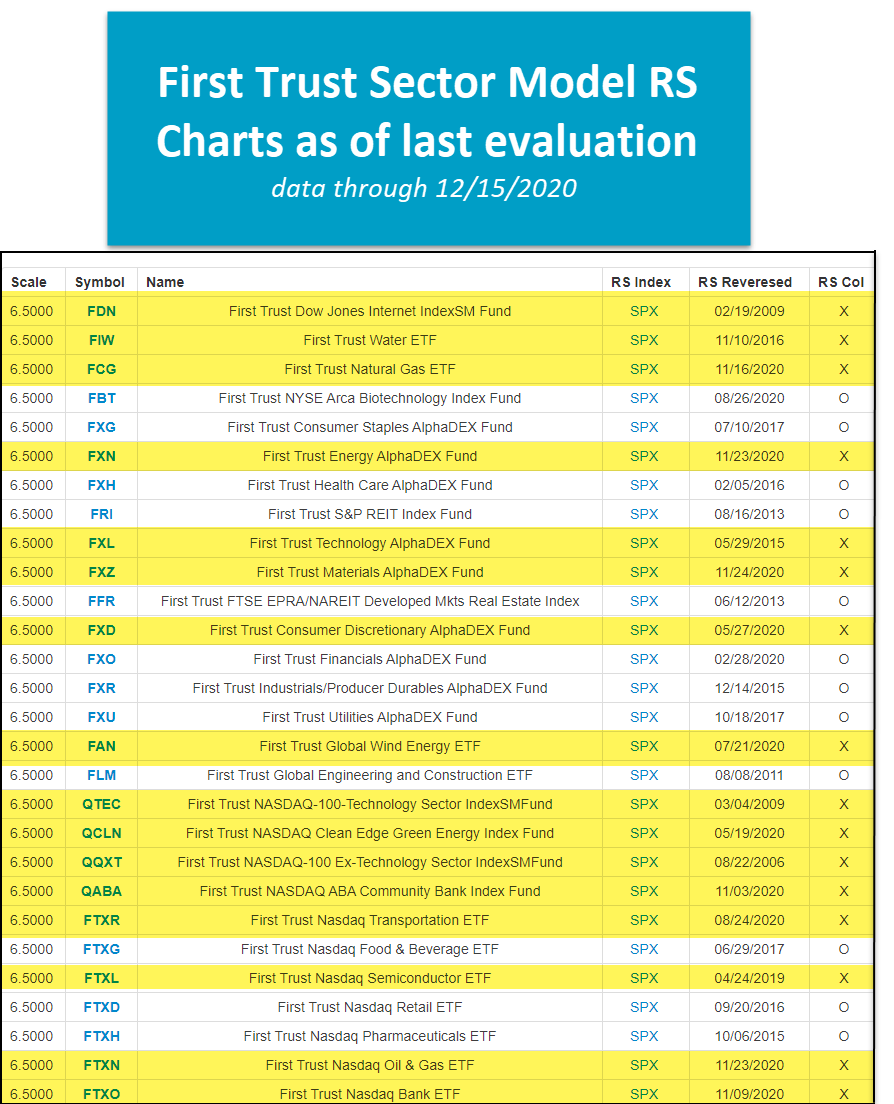
RS vs Benchmark Method Example - First Trust Sector Rotation ETF Model FTRUST
In addition to running matrix-based models, we also run ETF models using an "RS vs Benchmark" methodology. One example is the First Trust Sector Rotation Model FTRUST. This particular model takes a universe of 28 First Trust sector ETFs and, rather than comparing them to one another, compares them to a single benchmark, in this case, the S&P 500 Index SPX on a Relative Strength basis. The FTRUST model holds those funds that are showing positive RS (i.e. those in a column of Xs on their RS chart vs. SPX) and will avoid the funds showing weakness (i.e. those in a column of Os on their RS chart. One important difference between an RS vs benchmark model such as FTRUST and most matrix-based models is that because FTRUST holds all of the ETFs in the model inventory with positive RS against the benchmark, the number of holdings in the model portfolio can fluctuate. This can be advantageous because if only a few strong areas of the market, an RS vs benchmark model isn't forced to hold a weaker area because it has a fixed number of holdings, however, the flipside is that the model has the potential to become highly concentrated.
First Trust Sector Rotation Model Process:
RS vs Benchmark + Defensive Component Example - Value/Growth Portfolio RPVRPG
The Value/Growth Portfolio is designed to gain exposure to US large-cap equities via the Invesco S&P 500 Pure Value ETF RPV or the Invesco S&P 500 Pure Growth ETF RPG. When US equities are not in favor, the portfolio has the ability to fully rotate into cash. Similar to the FTRUST model, RPVRPG uses an RS switching strategy to first establish the strongest of the two US large-cap styles (value or growth) which is determined by the RS chart's column - Xs favor value while Os favor growth. The winner of that comparison is then pitted against cash using a single RS comparison. If this chart is on a buy signal, the model will be 100% invested in the winning US large-cap style. If it is on a sell signal, the strategy will rotate 100% into cash.
RPVRPG Process:

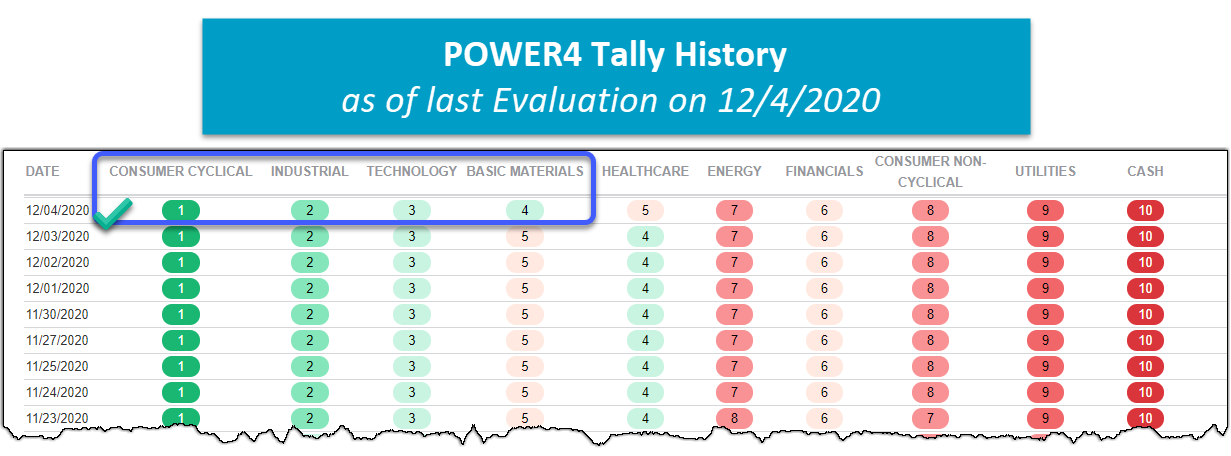
Tally Ranking Method Example - DWA Sector 4 ETF Model POWER4
Tally ranking models utilize a system similar to that of our Dynamic Asset Level Investing (DALI) tool, which we'll discuss further on Day 7. An equal number of proxies (i.e. funds) are selected to represent each area of the market being compared, whether they be sectors, size & style boxes, or countries. All of the proxies are then put into a Relative Strength matrix and the buy signals for each are each group are tallied. In order to illustrate this, let's take a look at the DWA Sector 4 Model POWER4, which provides exposure to four sectors utilizing the Invesco DWA Momentum Sector ETFs. As the image below shows, consumer cyclical is currently the top-ranked sector, followed by industrials, technology, and basic materials. As a result, the model owns the corresponding momentum portfolios for consumer cyclical PEZ, industrials PRN, technology PTF, and basic materials PYZ.
DWA Sector 4 Model Process:
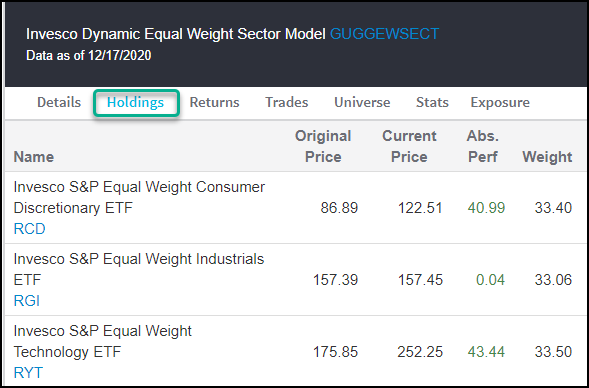
Tally Ranking + Defensive Component Example - Invesco Dynamic Equal Weight Sector ETF Model GUGGEWSECT
Although the POWER4 model has a cash component, we wanted to provide you with another example of a tally-based model with the ability to raise cash. The Invesco Dynamic Equal Weight Sector Model is designed to gain exposure to the three sectors with the highest Relative Strength in the US equity market through the use of 10 equal-weight sector ETFs: RYH, RHS, RTM, RYU, RYF, RYT, RGI, RCD, RYE, and EWRE. When equities are not in favor, the portfolio can raise varying amounts of cash, up to 100%. This model employs an RS tally matrix methodology.
GUGGEWSECT Model Process:
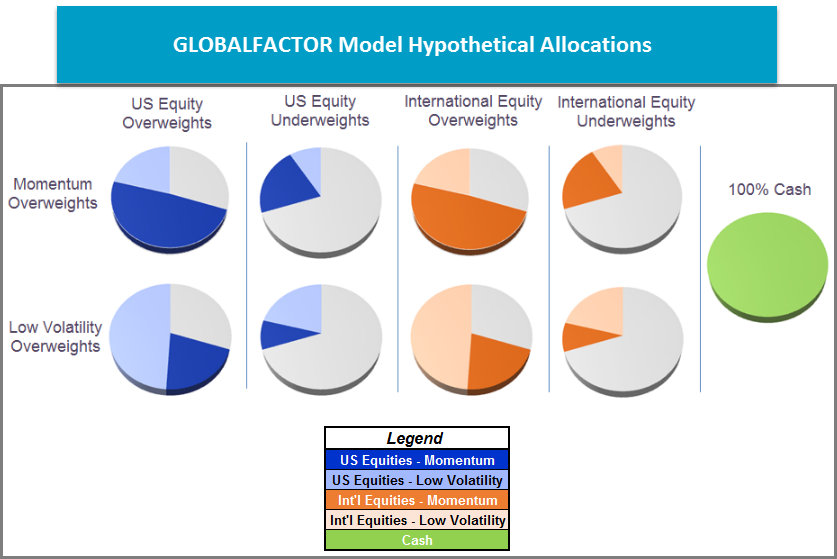
DALI-Based Method Example - DWA Global Factor ETF Model GLOBALFACTOR
The DWA Global Factor Model seeks to provide global equity exposure based upon investment themes identified through Relative Strength using Dorsey Wright’s Dynamic Asset Level Investing (DALI) tool which, as mentioned above, we will discuss further on Day 7. The GLOBALFACTOR model is concerned only with the rankings of US equities, international equities, and cash relative to one another and will over or underweight these asset classes in accordance with their rank. The portfolio is evaluated on a monthly basis.
GLOBALFACTOR Process:
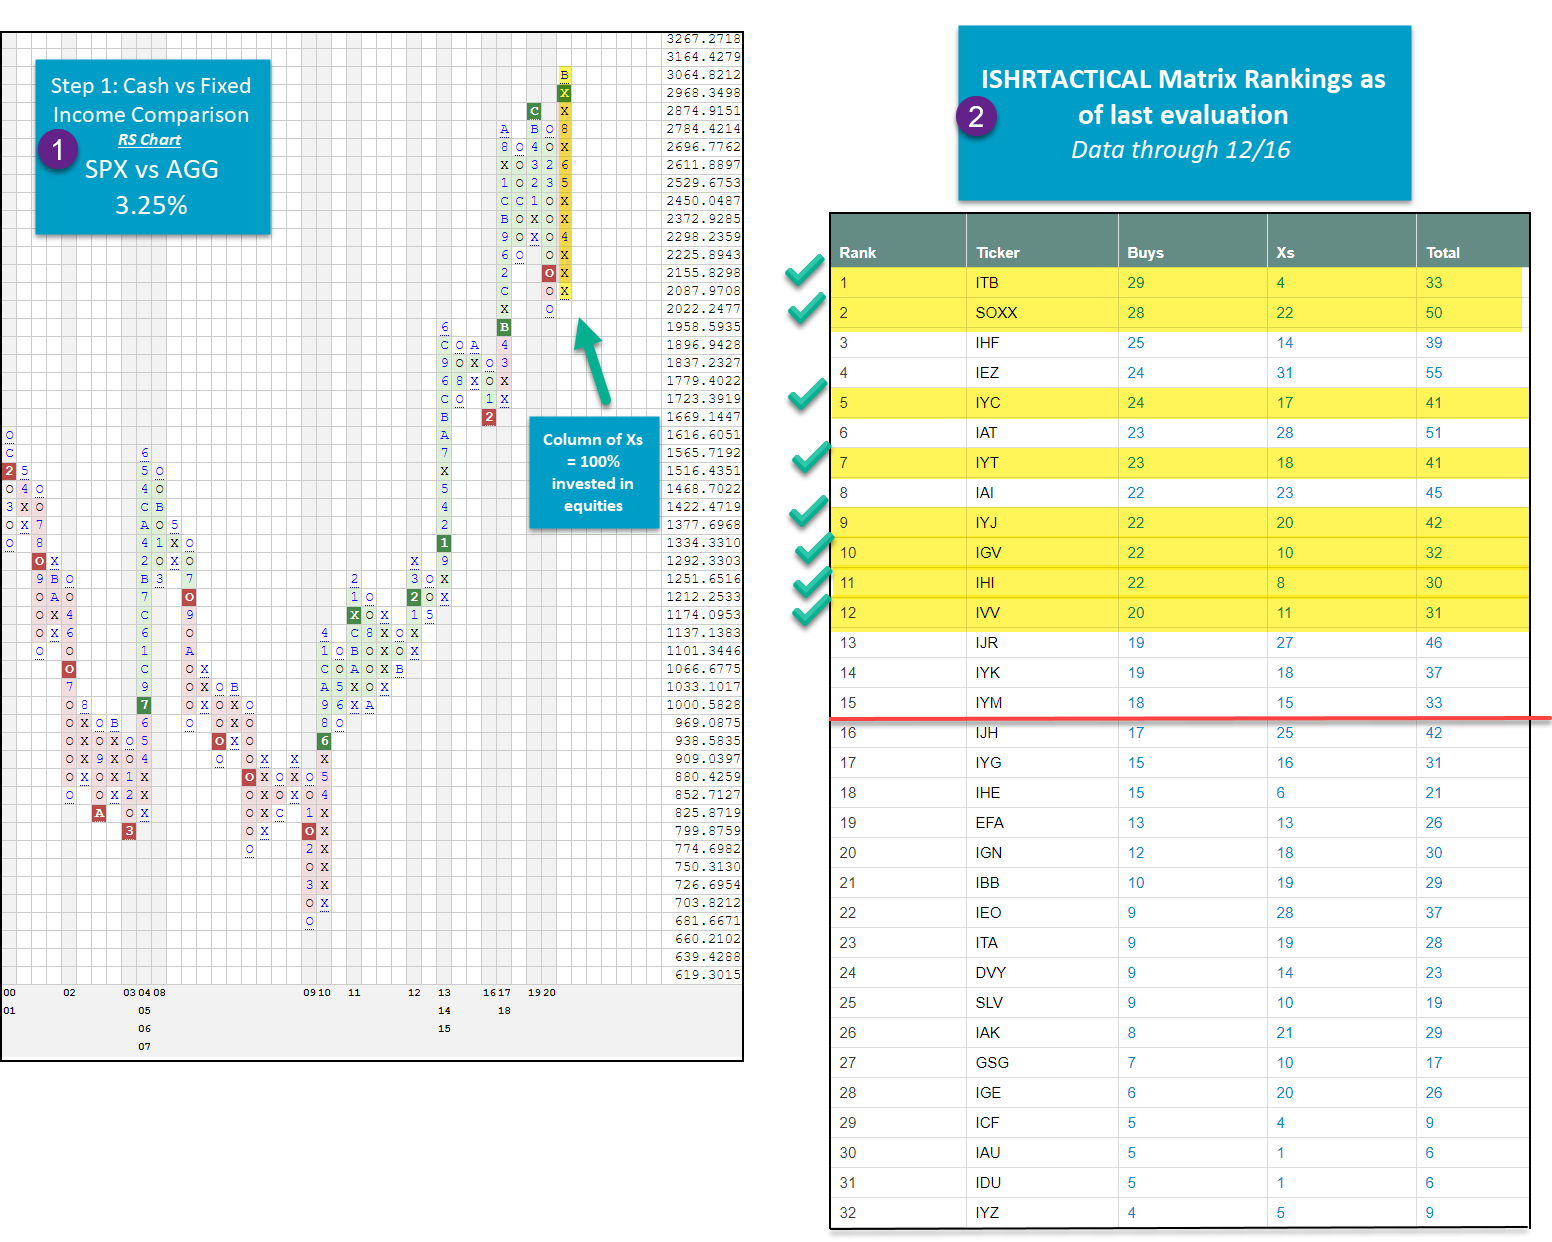
Defense with Fixed Income Example - iShares Tactical ETF Model ISHRTACTICAL
The purpose of the iShares Tactical Rotation Model is to identify major themes in the market, have exposure to those areas of the market controlled by demand, and eliminate exposure to those areas of the market controlled by supply. The model is designed to hone in on the strongest ETFs from the model inventory, which includes a core universe of ETFs spanning US sectors, international equities, and commodities, as well as one fixed income fund. When a defensive posture is warranted, the model has the potential to overweight fixed income up to 30%.
ISHRTACTICAL Process:
Defense with Chinese Fixed Income Example - KraneShares Dynamic China Rotation ETF Model KRANEDYNAMIC.TR
The KraneShares Dynamic China Rotation Model is designed to identify the strongest funds from our chosen inventory of KraneShares ETFs according to Relative Strength with the added potential for the model to become defensive through investment in Chinese fixed income should Chinese equities move out of favor. The KraneShares suite of ETFs offers a variety of investment solutions for exposure to Chinese equities such as sector-specific China thematic funds, broad exposure through China core funds, and defensively-minded positions in the form of Chinese fixed income.
KRANESHARES Process:

Not only have domestic equities shown strength across the Asset Class Group Scores page, but international equities, specifically emerging market equities, are also in good standing. Emerging markets have been led by China for much of the year, but we’ve seen the strength expand out to the broader Asia-Pacific region and the Latin America group as of late. For a more detailed review of the quick improvement of the Latin America group, please click here. One of the issues with broad emerging markets exposure is the heavy weighting towards China. While this has been a leader in the space for much of the year, many clients and advisors are concerned with the political and legislative risk associated with Chinese equities. The China group has an average group score of 4.08 but a negative score direction of -0.79, showing some weakness recently.
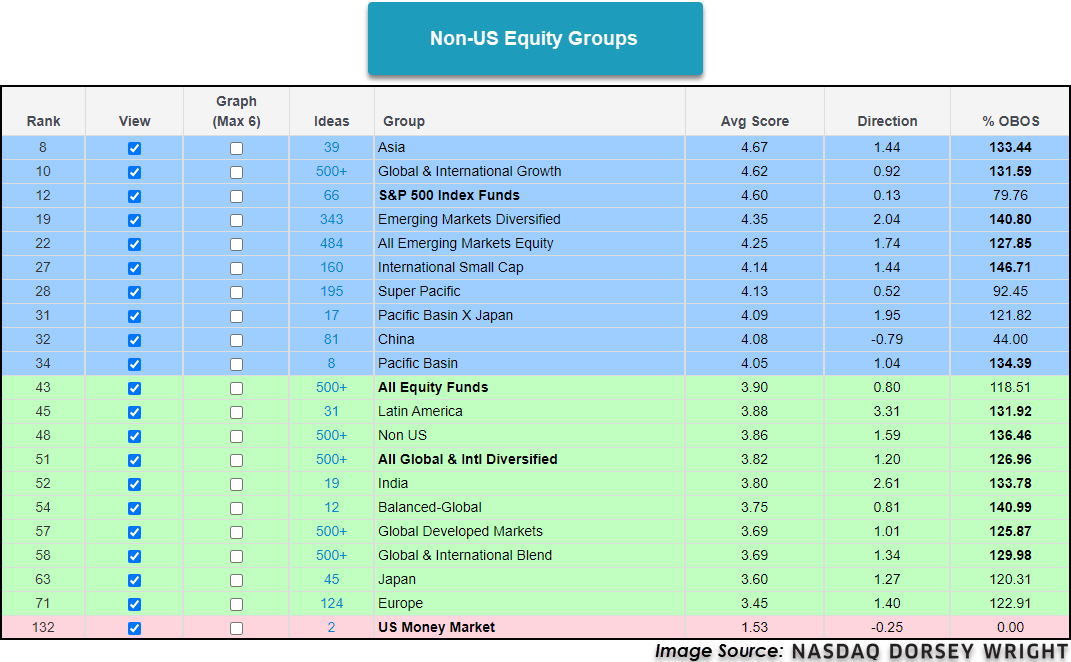
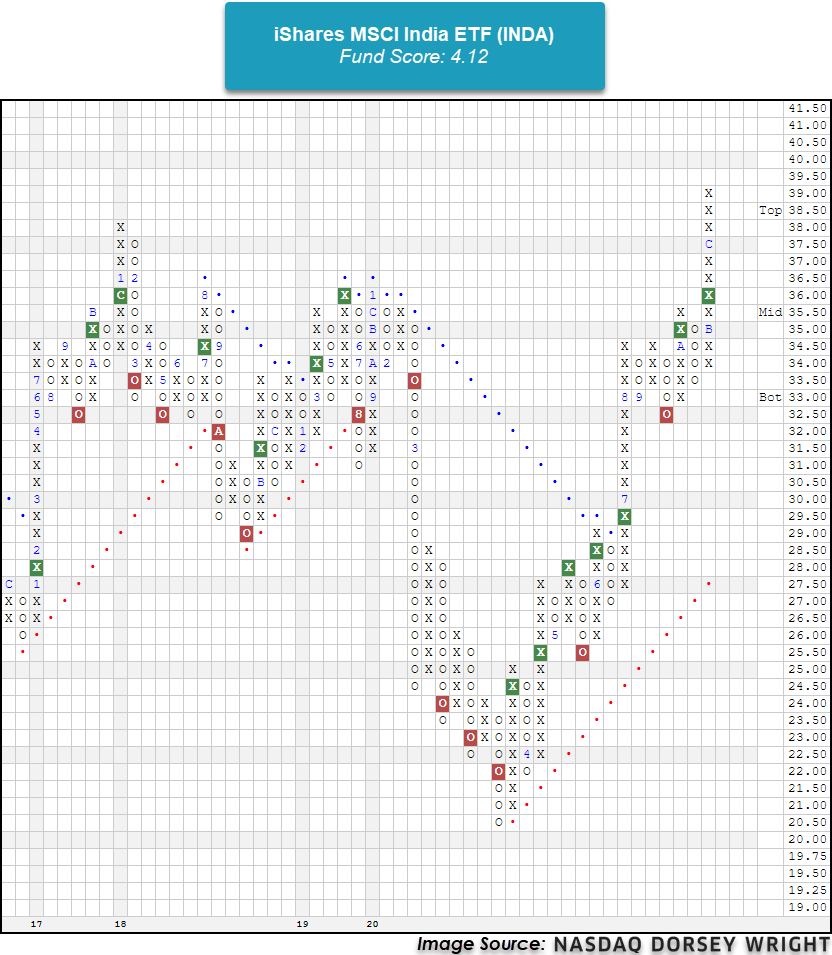
For those in search of emerging markets exposure without having China included, individual country exposure is a possible solution. The India group has an average group score of 3.80 with a positive score direction of 2.61 highlighting the swift improvement. The iShares MSCI India ETF INDA is a strong candidate deserving consideration with a fund score of 4.12 and score direction of 3.58. Currently charting at $39, INDA is at a multi-year high but the recent improvement has put the fund into heavily overbought territory with a weekly overbought/oversold reading of 123%.
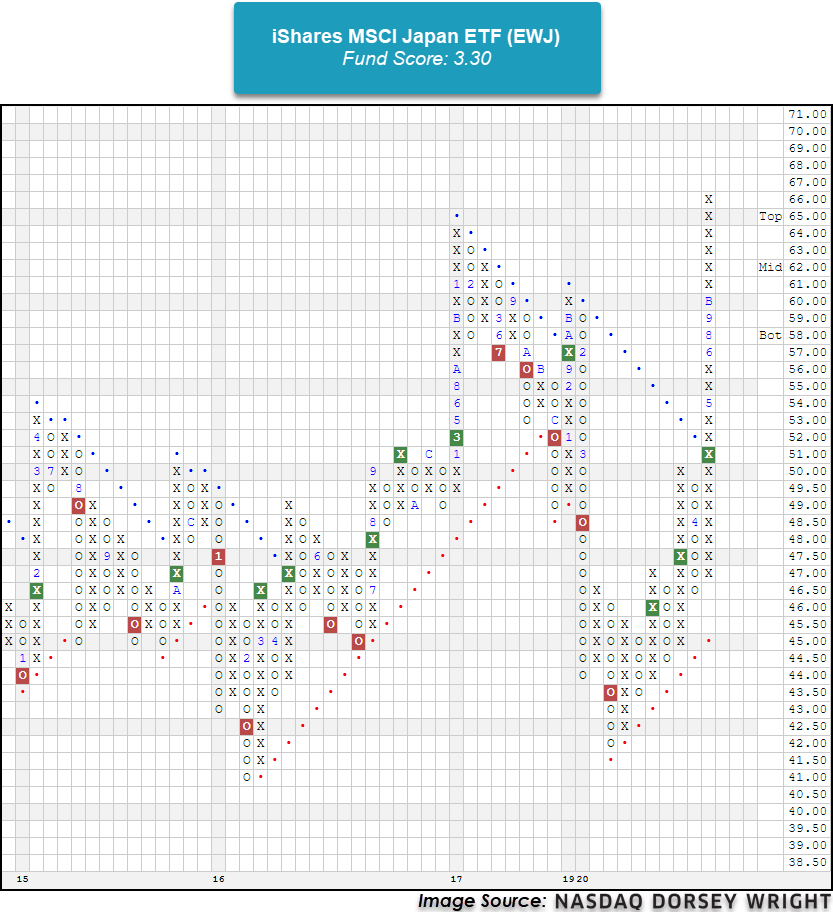
Another individual country group is the Japan group which has an average group score of 3.60 and a positive score direction of 1.27. One of the more popular FSM models, the FSM T Rowe Price 5S PR4050, is holding the T. Rowe Price Japan Fund PRJPX, so we’ve seen some of the FSM models take notice of the strength in Japan. The iShares MSCI Japan ETF EWJ possesses a strong fund score of 3.30 with a positive score direction of 1.86, but recent price action has also put EWJ into heavily overbought territory.
The continuing improvement and strength in emerging markets has been noticeable, especially in the current market environment where the US dollar has continued to weaken over the past few months. Concerns around China stemming from a variety of reasons like political and legislative risks have made it difficult for investors to find broad emerging market exposure that doesn’t include China, but using a few individual country and region funds together can provide the international exposure many are craving while still sticking to groups that exhibit high relative strength characteristics. To look for new ideas and stay on top of ever changing market trends, be sure to visit the Asset Class Group Scores page and set alerts.

Average Level
51.74
| AGG | iShares US Core Bond ETF |
| USO | United States Oil Fund |
| DIA | SPDR Dow Jones Industrial Average ETF |
| DVY | iShares Dow Jones Select Dividend Index ETF |
| DX/Y | NYCE U.S.Dollar Index Spot |
| EFA | iShares MSCI EAFE ETF |
| FXE | Invesco CurrencyShares Euro Trust |
| GLD | SPDR Gold Trust |
| GSG | iShares S&P GSCI Commodity-Indexed Trust |
| HYG | iShares iBoxx $ High Yield Corporate Bond ETF |
| ICF | iShares Cohen & Steers Realty ETF |
| IEF | iShares Barclays 7-10 Yr. Tres. Bond ETF |
| LQD | iShares iBoxx $ Investment Grade Corp. Bond ETF |
| IJH | iShares S&P 400 MidCap Index Fund |
| ONEQ | Fidelity Nasdaq Composite Index Track |
| QQQ | Invesco QQQ Trust |
| RSP | Invesco S&P 500 Equal Weight ETF |
| IWM | iShares Russell 2000 Index ETF |
| SHY | iShares Barclays 1-3 Year Tres. Bond ETF |
| IJR | iShares S&P 600 SmallCap Index Fund |
| SPY | SPDR S&P 500 Index ETF Trust |
| TLT | iShares Barclays 20+ Year Treasury Bond ETF |
| GCC | WisdomTree Continuous Commodity Index Fund |
| VOOG | Vanguard S&P 500 Growth ETF |
| VOOV | Vanguard S&P 500 Value ETF |
| EEM | iShares MSCI Emerging Markets ETF |
| XLG | Invesco S&P 500 Top 50 ETF |
| Symbol | Company | Sector | Current Price | Action Price | Target | Stop | Notes |
|---|---|---|---|---|---|---|---|
| AOS | A.O. Smith Corporation | Building | $55.26 | mid to upper 50s | 72 | 47 | 4 for 5'er, four consec buy signals, mutli-year high, market RS buy signal since 9/2008, 1.86% yield |
| BECN | Beacon Roofing Supply, Inc. | Building | $38.96 | 36 - 40 | 56 | 30 | 4 for 5'er, top third of fav DWABUIL, consec buy signals, 52 week highs, pos weekly mom flip |
| APAM | Artisan Partners Asset Management, Inc | Finance | $49.79 | mid-to-upper 40s | 53.50 | 39 | 5 for 5'er, top 20% of FINA sector matrix, multiple buy signals, pos wkly mom flip, 6% yield |
| LASR | nLIGHT, Inc. | Semiconductors | $35.64 | low-to-mid 30s | 55 | 27 | 5 for 5'er, top 10% of SEMI sector matrix, consec buy signals, pullback from multi-year high |
| JCI | Johnson Controls International PLC | Protection Safety Equipment | $46.45 | mid 30s | 58 | 39 | 4 for 5'er, top half of PROT sector matrix, multiple buy signals 2.3% yield, R-R>2.0 |
| DE | Deere & Company | Machinery and Tools | $264.53 | 250s to low 270s | 348 | 208 | 5 for 5'er, ATH, pos trend, top 25% of DWAMACH, triple top breakout |
| PWR | Quanta Services, Inc. | Electronics | $68.82 | hi 60s - low 70s | 86 | 58 | 5 for 5'er, top 20% of favored ELEC sector matrix, triple top breakout, pullback from ATH |
| PLAN | Anaplan, Inc. | Internet | $71.11 | upper 60s to mid 70s | 84 | 58 | 4 for 5'er, pullback from ATH, consec buy signals, top 25% DWAINET, pos weekly and mon mom |
| IPOB | Social Capital Hedosophia Holdings Corp. II Class A | Wall Street | $29.44 | 28 - 30 | 41 | 24 | 4 for 5'er, #1 of 24 in favored WALL sector matrix, multiple buy signals, new ATH |
| Symbol | Company | Sector | Current Price | Action Price | Target | Stop | Notes |
|---|
| Symbol | Company | Sector | Current Price | Action Price | Target | Stop | Notes |
|---|---|---|---|---|---|---|---|
| SPWR | Sunpower Corporation | Electronics | $24.62 | low 20s | 33.50 | 18 | See follow up below. |
| CZR | Caesars Entertainment Inc. | Gaming | $77.06 | low-to-mid 70s | 88 | 62 | See follow up comment below. |
| Comment |
|---|
| JBHT J.B. Hunt Transport Services, Inc. R ($140.39) - Transports/Non Air - We will ow raise our stop to $118, the third potential sell signal on JBHT's default chart. |
| ROKU Roku, Inc. Class A R ($335.78) - Media - We will now raise our stop to $300, the second potential sell signal on ROKU's default chart. |
| SPWR Sunpower Corporation R ($26.15) - Electronics - SPWR has moved above the ideal action range. OK to hold here. Raise stop to $23.50, the first poential sell signal on SPWR's $0.50 chart. |
| CZR Caesars Entertainment Inc. R ($76.95) - Gaming - CZR has moved above the ideal action range. OK to hold here. Raise stop to $65, the second potential sell signal on CZR's default chart. |
IPOB Social Capital Hedosophia Holdings Corp. II Class A R ($29.09) - Wall Street - IPOB is a 4 for 5'er that ranks first out of 24 names in the favored Wall Street sector matrix. In Friday's trading, the stock gave a fourth consecutive buy signal when it broke a double top at $30, marking a new all-time high for the stock. Long exposure may be added in the $28 - $30 range and we will set our initial stop at $24, the first potential sell signal on IPOB's default chart. Using a modified vertical price objective based on the most recent buy signal, we will set our target price at $41.
| 20 | |||||||||||||||||||||||||
| 30.00 | x | 30.00 | |||||||||||||||||||||||
| 29.00 | X | X | 29.00 | ||||||||||||||||||||||
| 28.00 | • | X | O | X | 28.00 | ||||||||||||||||||||
| 27.00 | X | • | X | O | X | 27.00 | |||||||||||||||||||
| 26.00 | X | O | • | X | O | X | 26.00 | ||||||||||||||||||
| 25.00 | X | O | • | X | O | 25.00 | |||||||||||||||||||
| 24.00 | X | O | • | X | 24.00 | ||||||||||||||||||||
| 23.00 | X | O | • | X | X | 23.00 | |||||||||||||||||||
| 22.00 | X | O | • | X | O | X | 22.00 | ||||||||||||||||||
| 21.00 | X | O | • | X | O | X | Mid | 21.00 | |||||||||||||||||
| 20.00 | X | O | X | X | X | C | X | 20.00 | |||||||||||||||||
| 19.50 | X | O | X | O | X | O | X | O | • | 19.50 | |||||||||||||||
| 19.00 | X | X | X | O | X | X | O | X | O | X | • | 19.00 | |||||||||||||
| 18.50 | X | O | X | O | X | O | X | O | X | O | X | O | • | 18.50 | |||||||||||
| 18.00 | X | X | O | X | O | X | O | X | O | X | O | X | • | 18.00 | |||||||||||
| 17.50 | X | O | X | X | A | O | X | O | X | O | X | O | • | 17.50 | |||||||||||
| 17.00 | X | O | X | O | X | O | X | O | O | X | • | 17.00 | |||||||||||||
| 16.50 | X | O | X | O | X | O | O | X | • | 16.50 | |||||||||||||||
| 16.00 | X | O | X | O | X | • | B | X | • | 16.00 | |||||||||||||||
| 15.50 | X | O | X | O | X | • | O | • | 15.50 | ||||||||||||||||
| 15.00 | X | O | X | O | X | • | • | 15.00 | |||||||||||||||||
| 14.50 | X | O | X | O | • | 14.50 | |||||||||||||||||||
| 14.00 | X | O | • | 14.00 | |||||||||||||||||||||
| 13.50 | X | • | 13.50 | ||||||||||||||||||||||
| 13.00 | • | X | • | 13.00 | |||||||||||||||||||||
| 12.50 | X | • | 9 | • | 12.50 | ||||||||||||||||||||
| 12.00 | X | O | X | • | 12.00 | ||||||||||||||||||||
| 11.50 | X | O | X | • | 11.50 | ||||||||||||||||||||
| 11.00 | 6 | 7 | • | 11.00 | |||||||||||||||||||||
| 10.50 | X | • | 10.50 | ||||||||||||||||||||||
| 20 |

| ADBE Adobe Systems Incorporated ($503.69) - Software - Shares of ADBE moved higher Friday to break a triple top at $504. This 3 for 5'er moved to a positive trend in April and has been on an RS buy signal against the market since mid-2015. Weekly momentum flipped positive as well, suggesting the potential for further upside from here. The overall weight of the evidence is still positive here and once again improving. Initial support can be found at $472. Further support can be found at $448, which is also the current location of the bullish support line, and at $440. |
| ALLK Allakos, Inc. ($128.27) - Drugs - ALLK shares moved higher today to break a double top at $130 to mark its fourth consecutive buy signal. This 5 for 5'er has been in a positive trend since November and on an RS buy signal versus the market since August. Recent price action has put ALLK into heavily overbought territory, so those wishing to initiate a long position may be best served to wait for a pullback or price normalization. From here, support is offered at $120. |
| BC Brunswick Corporation ($81.39) - Leisure - BC broke a double top at $79 before moving higher to $82 on Friday, marking the stock’s fourth consecutive buy signal as well as a new all-time high. BC is a 4 for 5’er within the favored leisure sector. From here, support sits at $74. |
| CXO Concho Resources Inc. ($59.56) - Oil - CXO gave a initial sell signal when it broke a double bottom at $60 on Friday. The overall picture for CXO remains positive as it is a 3 for 5'er and returned to a positive trend in November. From here, support sits at $57, with additional support at $56. |
| HZO Marinemax ($35.82) - Leisure - HZO broke a triple top at $36, which successfully completed a shakeout pattern on the chart. HZO is a 4 for 5’er within the favored leisure sector that is trading in a positive trend. Additionally, HZO is now up against its all-time high last reached in April 2006. From here, support sits at $31. |
| ISRG Intuitive Surgical, Inc. ($780.62) - Healthcare - ISRG shares moved higher today to break a double top at $784 to complete a bullish triangle and mark its second consecutive buy signal. This 5 for 5'er has been in a positive trend since April and on an RS buy signal versus the market since January of 2016. ISRG is actionable at current levels with a weekly overbought/oversold reading of 33%. From here, support is offered at $752. |
| LPSN LivePerson, Inc. ($63.51) - Computers - Shares of LPSN continued higher Friday to break a double top at $61 before moving to a new all-time high at $64 intraday. This 3 for 5'er moved to a positive trend in May and saw weekly momentum just flip positive, suggesting the potential for further upside from here. The weight of the evidence is positive and improving. Those looking to add exposure may consider LPSN at current levels, with initial support offered at $57. Multiple additional support levels exist between $55 and $46. |
| MTOR Meritor Inc ($28.30) - Autos and Parts - MTOR broke a double top at $29, marking the third consecutive buy signal on the chart. This stock is a 4 for 5’er within the favored autos and parts sector. Weekly momentum has been positive for three weeks, suggesting the potential for higher prices. From here, support sits at $25. |
| SEAS SeaWorld Entertainment, Inc. ($31.13) - Leisure - SEAS broke a double top at $31, marking the sixth consecutive buy signal on the chart. SEAS is a strong 5 for 5’er within the favored leisure sector. From here, support sits at $26. |
| WDC Western Digital Corporation ($53.19) - Computers - WDC advanced Friday to break a double top at $54, marking a third consecutive buy signal. This 3 for 5'er moved to a positive trend in October and sits in the top third of the favored computers sector RS matrix. The technical picture remains strong here, however, those looking to add exposure would be best served to wait for a pullback or normalization of the trading band as the stock is overbought. Initial support can be found at $50. |
| Name | Option Symbol | Action | Stop Loss |
|---|---|---|---|
| United Parcel Service, Inc. - $175.18 | O: 21D175.00D16 | Buy the April 175.00 calls at 12.45 | 162.00 |
| Name | Option | Action |
|---|---|---|
| Marvell Technology Group Ltd. ( MRVL) | May. 42.00 Calls | Initiate an option stop loss of 6.25 (CP: 8.25) |
| Name | Option Symbol | Action | Stop Loss |
|---|---|---|---|
| HUYA, Inc. Sponsored ADR Class A - $21.09 | O: 21P22.00D16 | Buy the April 22.00 puts at 4.10 | 23.00 |
| Name | Option | Action |
|---|---|---|
| Flir Systems Inc (FLIR) | Dec. 40.00 Puts | Expired worthless. |
| Intel Corporation (INTC) | Mar. 52.50 Puts | Initiate an option stop loss of 3.30 (CP: 5.30) |
| Netease.com Inc. (China) ADR (NTES) | Mar. 89.00 Puts | Stopped at 92.00 (CP: 94.72) |
| Jack Henry & Associates Inc (JKHY) | Mar. 160.00 Puts | Stopped at 164.00 (CP: 161.41) |
| Name | Option Sym. | Call to Sell | Call Price | Investment for 500 Shares | Annual Called Rtn. | Annual Static Rtn. | Downside Protection |
|---|---|---|---|---|---|---|---|
| Synovus Financial Corp. $32.64 | O: 21B32.00D19 | Feb. 32.00 | 2.15 | $15,075.55 | 29.39% | 34.76% | 5.66% |
| Name | Action |
|---|---|
| Marathon Petroleum Corp. (MPC) - 40.58 | Sell the April 45.00 Calls. |
| Phillips-Van Heusen Corporation (PVH) - 96.40 | Sell the March 90.00 Calls. |
| Comerica Incorporated (CMA) - 52.77 | Sell the April 57.50 Calls. |
| Delta Air Lines Inc. (DAL) - 41.11 | Sell the March 45.00 Calls. |
| KeyCorp (KEY) - 15.58 | Sell the March 16.00 Calls. |
| Mosaic Company (MOS) - 23.10 | Sell the March 25.00 Calls. |
| American International Group, Inc. (AIG) - 38.23 | Sell the May 40.00 Calls. |
| L Brands Inc. (LB) - 39.19 | Sell the May 40.00 Calls. |
| Name | Covered Write |
|---|---|
|
|
|
Daily Equity & Market Analysis
Loading, Please Wait...
