
Most Requested Symbols

This Monday morning, we saw the S&P 500 and Nasdaq-100 indexes print new all-time highs. In light of this, today, we want to provide an update on the various indicators we are monitoring in regards to US equities and provide a list of actionable stock ideas for those who may wish to put money to work.
Today's featured stock is S&P Global Inc.(SPGI).
BLDP, CHH, COLM, ENSG, MRTX, MYOK, NSIT, PYPL, RUN & XBIT.
Call: Crox Inc (CROX); Put: Dentsply Sirona Inc (XRAY); Covered write: Bank of America (BAC).
Monday Market Update Webinar Replay: Missed Monday's (8/24) webcast? Click the link(s) below for a recap:
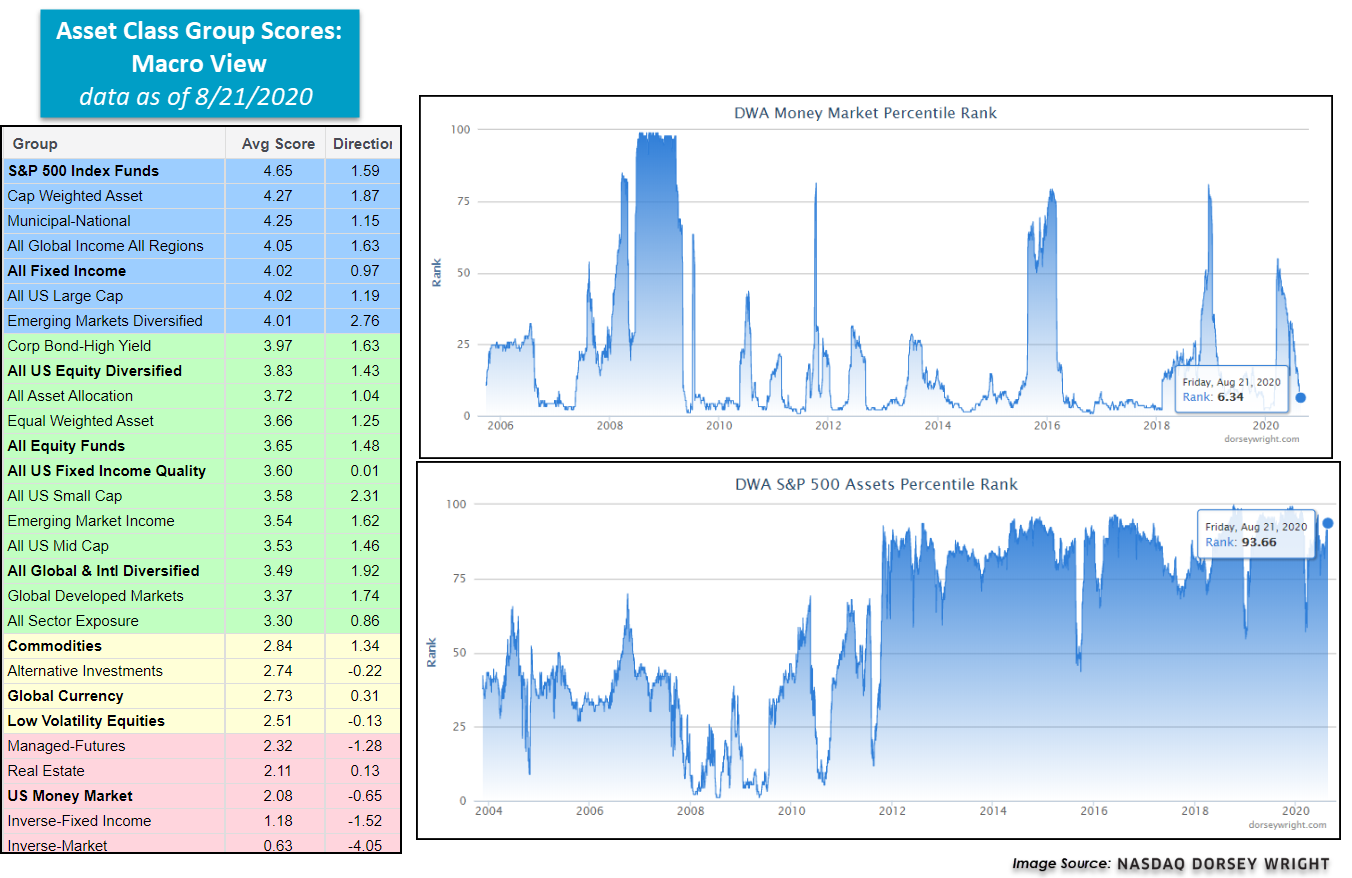
The Emerging Markets space continues to demonstrate strength, recently powering its way into the sought-after “blue sky zone” on the Asset Class Group Scores (ACGS) page with an average group score of 4.01. Furthermore, the group posts the highest score direction of all macro segments on the ACGS page with a reading of 2.76, speaking to the continued improvement of the group over the past six months. Note thematic tailwinds for the Emerging Markets space stemming (in part) from a weakening US Dollar, a topic of continued discussion given historic returns.
Looking to an investable product like the iShares MSCI Emerging Markets ETF EEM, we note a stellar 5.09 fund score, 4.49 positive score direction, four consecutive buy signals, recent flip to positive monthly momentum and an actionable Overbought/Oversold (OBOS) reading of 43%. The weight of the evidence continues to favor emerging equity markets and those looking to diversify their equity exposure with selective international plays may consider the emerging markets space at current levels. For other technically sound investable options, consider using the “Other Ideas” button atop the trend chart or the blue 350 to the left of the group name on the ACGS page.


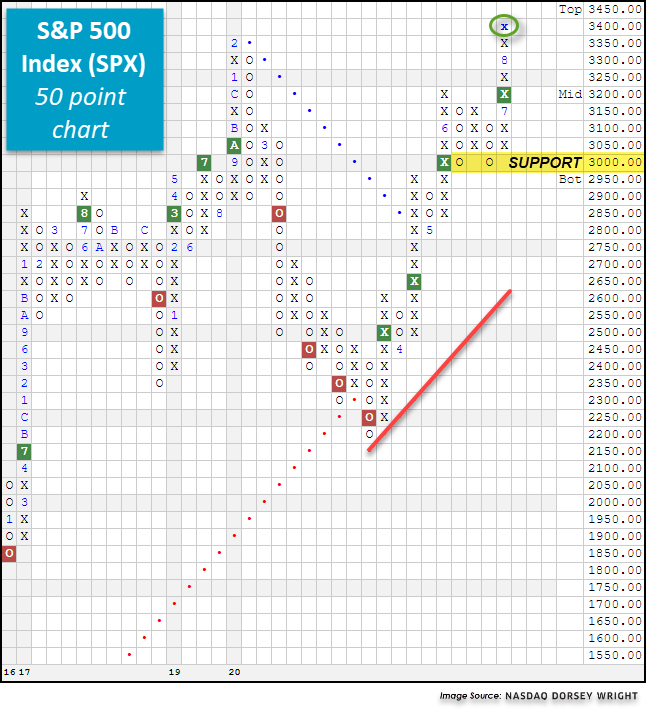
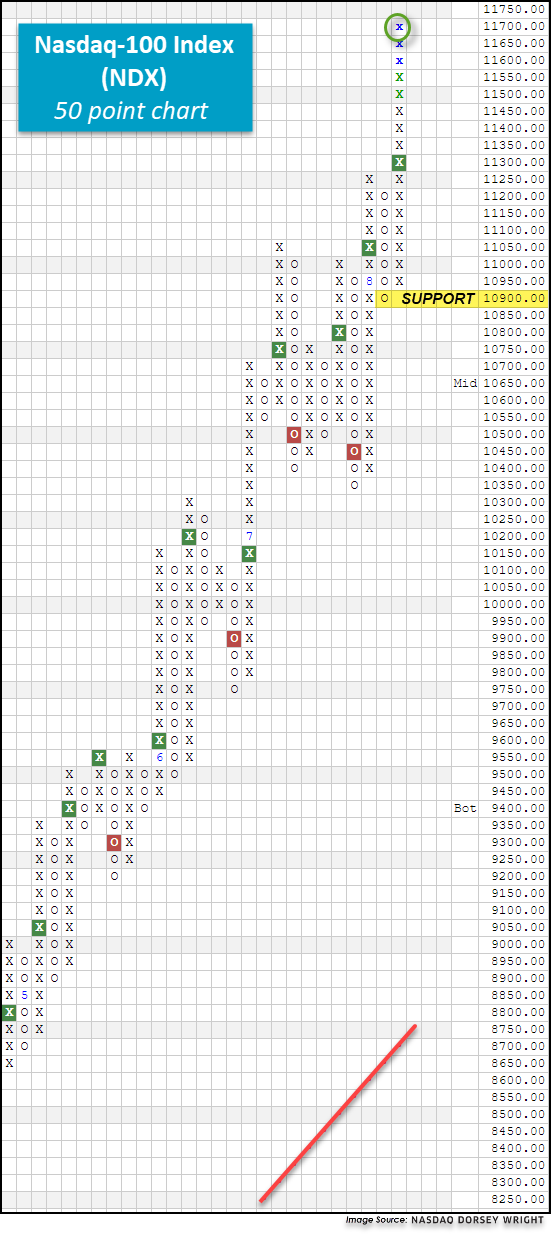
Right out of the gate this Monday morning, we saw the S&P 500 SPX and Nasdaq-100 NDX indexes print new all-time highs at 3,432.09 and 11,728.09, respectively, boosted in part by the positive price action of the "Big Tech 5" stocks. In light of these new all-time index highs, today, we want to provide an update on the various indicators we are monitoring in regards to US equities and provide a list of actionable stock ideas for those who may wish to put money to work in this strengthening asset class.


In order to provide a list of actionable stock ideas, we used the Security Screener tool to generate a list of names meeting certain technical requirements, which we have spelled out below. Note: if you run this same screen after Monday, August 24, your results may differ from ours as each day's action has the potential to alter the results.
Security Screener Filters:
After we ran the screen, we were left with a list of 23 names which are listed in the table below. As always, if you'd like to discuss any of these names in greater detail, please give us a call at (804) 320-8511.
| Symbol | Name | Price | Tech Attrib/Score | DWA Sector | Overbought/Oversold | ||
|---|---|---|---|---|---|---|---|
| AJG | Arthur J. Gallagher & Co. | 103.47 |
5 |
Insurance |
|
||
| ALGN | Align Technology, Inc. | 294.29 |
5 |
Healthcare |
|
||
| AMP | Ameriprise Financial | 154.51 |
4 |
Finance |
|
||
| AMZN | Amazon.com Inc. | 3284.72 |
4 |
Internet |
|
||
| CMS | CMS Energy Corporation | 60.39 |
4 |
Utilities/Electricity |
|
||
| DOCU | DocuSign, Inc. | 210.18 |
5 |
Software |
|
||
| FITB | Fifth Third Bancorp | 19.56 |
4 |
Banks |
|
||
| FRC | First Republic Bank of San Francisco | 112.97 |
5 |
Banks |
|
||
| HOLX | Hologic Incorporated | 66.75 |
5 |
Healthcare |
|
||
| HWM | Howmet Aerospace Inc. | 16.91 |
4 |
Aerospace Airline |
|
||
| LIN | Linde Plc | 244.30 |
5 |
Chemicals |
|
||
| MMC | Marsh & McLennan Companies, Inc. | 113.47 |
5 |
Insurance |
|
||
| MS | Morgan Stanley | 51.10 |
5 |
Wall Street |
|
||
| NEE | NextEra Energy, Inc. | 282.41 |
4 |
Utilities/Electricity |
|
||
| NRG | NRG Energy, Inc. | 34.53 |
5 |
Utilities/Electricity |
|
||
| PLD | ProLogis | 103.04 |
5 |
Real Estate |
|
||
| PXD | Pioneer Natural Resources | 102.11 |
4 |
Oil |
|
||
| RCL | Royal Caribbean Cruises Ltd. | 61.53 |
4 |
Leisure |
|
||
| ROK | Rockwell Automation, Inc. | 228.52 |
5 |
Electronics |
|
||
| SPGI | S&P Global Inc. | 362.01 |
5 |
Media |
|
||
| URI | United Rentals, Inc. | 175.06 |
5 |
Machinery and Tools |
|
||
| WMB | Williams Companies Inc. | 21.41 |
4 |
Gas Utilities |
|
||
| XEL | Xcel Energy, Inc. | 69.61 |
4 |
Utilities/Electricity |
|
Average Level
32.74
| AGG | iShares US Core Bond ETF |
| USO | United States Oil Fund |
| DIA | SPDR Dow Jones Industrial Average ETF |
| DVY | iShares Dow Jones Select Dividend Index ETF |
| DX/Y | NYCE U.S.Dollar Index Spot |
| EFA | iShares MSCI EAFE ETF |
| FXE | Invesco CurrencyShares Euro Trust |
| GLD | SPDR Gold Trust |
| GSG | iShares S&P GSCI Commodity-Indexed Trust |
| HYG | iShares iBoxx $ High Yield Corporate Bond ETF |
| ICF | iShares Cohen & Steers Realty ETF |
| IEF | iShares Barclays 7-10 Yr. Tres. Bond ETF |
| LQD | iShares iBoxx $ Investment Grade Corp. Bond ETF |
| IJH | iShares S&P 400 MidCap Index Fund |
| ONEQ | Fidelity Nasdaq Composite Index Track |
| QQQ | Invesco QQQ Trust |
| RSP | Invesco S&P 500 Equal Weight ETF |
| IWM | iShares Russell 2000 Index ETF |
| SHY | iShares Barclays 1-3 Year Tres. Bond ETF |
| IJR | iShares S&P 600 SmallCap Index Fund |
| SPY | SPDR S&P 500 Index ETF Trust |
| TLT | iShares Barclays 20+ Year Treasury Bond ETF |
| GCC | WisdomTree Continuous Commodity Index Fund |
| VOOG | Vanguard S&P 500 Growth ETF |
| VOOV | Vanguard S&P 500 Value ETF |
| EEM | iShares MSCI Emerging Markets ETF |
| XLG | Invesco S&P 500 Top 50 ETF |

| Symbol | Company | Sector | Current Price | Action Price | Target | Stop | Notes |
|---|---|---|---|---|---|---|---|
| NRG | NRG Energy, Inc. | Utilities/Electricity | $34.53 | mid to upper 30s | $49 | $27 | 5 for 5'er, LT market RS buy signal, consec buy signals, pos mon and weekly momentum, 3.58% yield |
| WMB | Williams Companies Inc. | Gas Utilities | $21.41 | 20 - 22 | 26.5 | 17 | 4 for 5'er, top 10% of GUTI sector matrix, 7.7% yield, pot. covered write |
| DXCM | Dexcom Inc. | Healthcare | $426.90 | 410s to 470s | 488 | 360 | 5 for 5'er, pullback from AT high, consec buy signals, LT market RS buy signal, top 1/3 of DWAHEAL |
| EBAY | eBay Inc. | Internet | $58.20 | mid-to-upper 50s | 100 | 46 | 5 for 5'er, top third of favored INET sector matrix, LT pos mkt RS, pullback from ATH |
| DECK | Deckers Outdoor Corporation | Textiles/Apparel | $209.39 | low 200s to mid 230s | 284 | 178 | 5 for 5'er, pullback from ATH, consec buy signals, pos mon mom, top 10% of DWATEXT |
| PLD | ProLogis | Real Estate | $103.04 | hi 90s - mid 100s | 116 | 87 | 5 for 5'er, top third of REAL sector matrix, spread triple top, pos monthly mom flip, 2.2% yield |
| ELY | Callaway Golf Company | Leisure | $18.70 | mid/upper 10s | 27.50 | 14.50 | 4 for 5'er, 6 consec buy signals, pos mon mom, top 1/3 of DWALEIS |
| V | Visa Inc. | Finance | $204.13 | mid 190s - mid 200s | 226 | 170 | 4 for 5'er, favored FINA sector matrix, spread quad top breakout, pos wkly & mnthly mom flips |
| SPGI | S&P Global Inc. | Media | $362.01 | 350s - 360s | 407 | 304 | 5 for 5'er, top 25% of MEDI sector matrix, LT pos mkt RS, multi consec buys |
| Symbol | Company | Sector | Current Price | Action Price | Target | Stop | Notes |
|---|---|---|---|---|---|---|---|
| THS | TreeHouse Foods, Inc. | Food Beverages/Soap | $42.98 | low to mid 40s | 36 | 53 | 0 for 5'er, consec sell signals, LT market RS sell signal, bottom quartile of DWAFOOD |
| Symbol | Company | Sector | Current Price | Action Price | Target | Stop | Notes |
|---|---|---|---|---|---|---|---|
| CTAS | Cintas Corporation | Textiles/Apparel | $320.39 | low 300s to mid 330s | $400 | $252 | See follow up comment below. |
| NKE | NIKE, Inc. | Textiles/Apparel | $109.75 | hi 90s - mid 100s | 112 | 89 | NKE has moved to heavily overbought territory. OK to hold here. Maintain $89 stop. |
| Comment |
|---|
| PAGS PagSeguro Digital Ltd. Class A R ($43.62) - Business Products - We will raise our stop to $36, the second potential sell signal on the default chart. |
| CTAS Cintas Corporation R ($324.65) - Textiles/Apparel - CTAS has moved above the ideal action range. OK to hold here. Raise stop to $274, which would take out multiple levels of support on CTAS's $1 chart. |
SPGI S&P Global Inc. R ($359.30) - Media - SPGI is a 5 for 5'er that ranks in the top quartile of the media sector matrix and has been on a market RS buy signal since 2011. In Monday's trading, the stock gave a seventh consecutive buy signal and reached a new all-time high when it broke a double top at $364. Long exposure may be added in the $350s and $360s and we will set our initial stop at $304, which would take out three levels of support on SPG's default chart. Using a modified vertical price objective based on Monday's buy signal we will set our initial target price at $407. SPGI also comes with a 0.7% yield.
| 19 | 20 | ||||||||||||||||||||||||||||||||||||||||||||||||||||
| 364.00 | x | 364.00 | |||||||||||||||||||||||||||||||||||||||||||||||||||
| 360.00 | X | X | 360.00 | ||||||||||||||||||||||||||||||||||||||||||||||||||
| 356.00 | X | X | X | O | X | 356.00 | |||||||||||||||||||||||||||||||||||||||||||||||
| 352.00 | X | O | X | O | X | O | X | 352.00 | |||||||||||||||||||||||||||||||||||||||||||||
| 348.00 | X | O | X | O | X | O | X | 348.00 | |||||||||||||||||||||||||||||||||||||||||||||
| 344.00 | X | O | O | 8 | Mid | 344.00 | |||||||||||||||||||||||||||||||||||||||||||||||
| 340.00 | X | 340.00 | |||||||||||||||||||||||||||||||||||||||||||||||||||
| 336.00 | X | 336.00 | |||||||||||||||||||||||||||||||||||||||||||||||||||
| 332.00 | X | X | 7 | 332.00 | |||||||||||||||||||||||||||||||||||||||||||||||||
| 328.00 | 6 | O | X | O | X | 328.00 | |||||||||||||||||||||||||||||||||||||||||||||||
| 324.00 | X | O | X | O | X | 324.00 | |||||||||||||||||||||||||||||||||||||||||||||||
| 320.00 | X | O | X | O | X | 320.00 | |||||||||||||||||||||||||||||||||||||||||||||||
| 316.00 | • | X | O | X | O | 316.00 | |||||||||||||||||||||||||||||||||||||||||||||||
| 312.00 | X | • | X | O | X | 312.00 | |||||||||||||||||||||||||||||||||||||||||||||||
| 308.00 | X | O | • | X | X | O | 308.00 | ||||||||||||||||||||||||||||||||||||||||||||||
| 304.00 | 2 | O | • | X | O | X | X | 304.00 | |||||||||||||||||||||||||||||||||||||||||||||
| 300.00 | X | O | • | X | O | X | O | X | Bot | 300.00 | |||||||||||||||||||||||||||||||||||||||||||
| 296.00 | X | O | X | • | X | O | X | O | X | 296.00 | |||||||||||||||||||||||||||||||||||||||||||
| 292.00 | X | O | X | O | • | X | O | X | O | 292.00 | |||||||||||||||||||||||||||||||||||||||||||
| 288.00 | X | O | X | O | • | X | 5 | X | 288.00 | ||||||||||||||||||||||||||||||||||||||||||||
| 284.00 | X | O | X | O | • | X | X | X | O | 284.00 | |||||||||||||||||||||||||||||||||||||||||||
| 280.00 | X | O | X | O | • | X | O | X | O | X | 280.00 | ||||||||||||||||||||||||||||||||||||||||||
| 276.00 | 1 | O | X | O | • | X | O | X | O | X | 276.00 | ||||||||||||||||||||||||||||||||||||||||||
| 272.00 | X | X | O | 3 | O | • | X | O | X | O | X | 272.00 | |||||||||||||||||||||||||||||||||||||||||
| 268.00 | 9 | X | O | X | O | X | O | • | X | O | O | 268.00 | |||||||||||||||||||||||||||||||||||||||||
| 264.00 | X | O | X | O | X | O | X | O | • | X | • | 264.00 | |||||||||||||||||||||||||||||||||||||||||
| 260.00 | X | X | O | B | C | O | O | X | • | 260.00 | |||||||||||||||||||||||||||||||||||||||||||
| 256.00 | X | O | X | O | X | X | O | X | X | • | 256.00 | ||||||||||||||||||||||||||||||||||||||||||
| 252.00 | 8 | O | X | O | X | O | X | O | X | O | X | • | 252.00 | ||||||||||||||||||||||||||||||||||||||||
| 248.00 | X | O | X | O | X | O | X | O | X | O | X | X | X | • | 248.00 | ||||||||||||||||||||||||||||||||||||||
| 244.00 | X | O | O | X | O | O | O | X | O | X | O | X | • | 244.00 | |||||||||||||||||||||||||||||||||||||||
| 240.00 | X | A | X | O | X | O | X | O | X | • | 240.00 | ||||||||||||||||||||||||||||||||||||||||||
| 236.00 | 7 | O | O | X | O | X | 4 | X | • | 236.00 | |||||||||||||||||||||||||||||||||||||||||||
| 232.00 | X | O | X | O | X | O | • | 232.00 | |||||||||||||||||||||||||||||||||||||||||||||
| 228.00 | X | O | X | O | X | X | • | 228.00 | |||||||||||||||||||||||||||||||||||||||||||||
| 224.00 | 6 | O | X | O | X | O | X | • | 224.00 | ||||||||||||||||||||||||||||||||||||||||||||
| 220.00 | X | X | O | X | O | X | O | X | • | 220.00 | |||||||||||||||||||||||||||||||||||||||||||
| 216.00 | X | O | X | O | O | X | O | X | • | 216.00 | |||||||||||||||||||||||||||||||||||||||||||
| 212.00 | 4 | O | X | O | O | X | X | • | 212.00 | ||||||||||||||||||||||||||||||||||||||||||||
| 208.00 | X | 5 | O | X | O | X | • | 208.00 | |||||||||||||||||||||||||||||||||||||||||||||
| 204.00 | X | X | O | X | O | X | • | 204.00 | |||||||||||||||||||||||||||||||||||||||||||||
| 200.00 | X | O | X | O | X | O | X | • | 200.00 | ||||||||||||||||||||||||||||||||||||||||||||
| 198.00 | X | O | X | O | X | O | X | • | 198.00 | ||||||||||||||||||||||||||||||||||||||||||||
| 196.00 | X | X | 3 | • | O | X | O | X | • | 196.00 | |||||||||||||||||||||||||||||||||||||||||||
| 194.00 | X | O | X | • | O | X | O | X | • | 194.00 | |||||||||||||||||||||||||||||||||||||||||||
| 192.00 | 2 | O | X | • | O | X | O | • | 192.00 | ||||||||||||||||||||||||||||||||||||||||||||
| 190.00 | X | O | • | O | X | • | 190.00 | ||||||||||||||||||||||||||||||||||||||||||||||
| 188.00 | X | • | O | • | 188.00 | ||||||||||||||||||||||||||||||||||||||||||||||||
| 186.00 | X | X | • | • | 186.00 | ||||||||||||||||||||||||||||||||||||||||||||||||
| 184.00 | C | O | X | • | 184.00 | ||||||||||||||||||||||||||||||||||||||||||||||||
| 182.00 | X | O | X | • | 182.00 | ||||||||||||||||||||||||||||||||||||||||||||||||
| 180.00 | X | O | X | • | 180.00 | ||||||||||||||||||||||||||||||||||||||||||||||||
| 178.00 | X | O | X | • | 178.00 | ||||||||||||||||||||||||||||||||||||||||||||||||
| 176.00 | X | O | X | • | 176.00 | ||||||||||||||||||||||||||||||||||||||||||||||||
| 174.00 | O | X | • | 174.00 | |||||||||||||||||||||||||||||||||||||||||||||||||
| 172.00 | O | X | • | 172.00 | |||||||||||||||||||||||||||||||||||||||||||||||||
| 170.00 | O | X | X | • | 170.00 | ||||||||||||||||||||||||||||||||||||||||||||||||
| 168.00 | O | X | O | X | • | 168.00 | |||||||||||||||||||||||||||||||||||||||||||||||
| 166.00 | O | X | O | X | • | 166.00 | |||||||||||||||||||||||||||||||||||||||||||||||
| 164.00 | O | X | 1 | • | 164.00 | ||||||||||||||||||||||||||||||||||||||||||||||||
| 162.00 | O | X | • | 162.00 | |||||||||||||||||||||||||||||||||||||||||||||||||
| 160.00 | O | X | • | 160.00 | |||||||||||||||||||||||||||||||||||||||||||||||||
| 158.00 | O | • | 158.00 | ||||||||||||||||||||||||||||||||||||||||||||||||||
| 19 | 20 |
| BLDP Ballard Power Systems, Inc. ($16.54) - Electronics - Shares of BLDP moved higher Monday to break a double top at $17 before moving to $17.50 intraday. This 3 for 5'er has maintained a positive trend since May of 2019 and ranks in the top third of the favored electronics sector RS matrix. The stock has also maintained an RS buy signal against the market since September of 2018. The overall technical picture is once again improving. Initial support can be found at $14.50 with further support offered at $14. Overhead resistance may come initially at $20 and then $21, the stock's all-time high from July. |
| CHH Choice Hotels ($96.68) - Leisure - CHH continued higher Monday to break a double top at $97. This 4 for 5'er moved back to a positive trend earlier this month and reversed back up into a column of Xs against the market following market action Friday. The stock ranks in the top third of the favored leisure sector RS matrix and also saw monthly momentum just flip positive, suggesting the potential for further upside from here. The weight of the technical evidence is positive and continues to strengthen. Initial support can be found at $93. Further overhead resistance may come at $108, the all-time high from February. |
| COLM Columbia Sportswear Company ($84.50) - Textiles/Apparel - Shares of COLM moved higher Monday to break a spread quadruple top at $83 before advancing past further resistance to $84 intraday. This 3 for 5'er moved to a positive trend in May and ranks in the top half of the textiles/apparel sector RS matrix. The stock has also maintained an RS buy signal against the market since early-2015. Those looking to add exposure may consider COLM on this breakout, with initial support offered at $78. Further support may be found at $76, the current location of the bullish support line. |
| ENSG Ensign Group, Inc. ($58.17) - Healthcare - ENSG rose Monday to break a double top at $59. This 5 for 5'er moved to a positive trend in July and ranks in the top decile of the favored healthcare sector RS matrix. The stock has also maintained an RS buy signal against the market since mid-2018. The overall weight of the evidence is decidedly positive here, however, the recent price improvement has led ENSG into overbought territory with an intraday weekly overbought/oversold (OBOS) reading of 91% Monday. Those looking to add exposure may be best served by waiting for a pullback or normalization of the trading band. Initial support can be found at $55. |
| MRTX Mirati Therapeutics Inc. ($148.06) - Biomedics/Genetics - MRTX continued higher Monday to break a double top at $146 before marking a new all-time high at $148 intraday. This 4 for 5'er ranks 8th out of 127 names in the biomedics/genetics sector RS matrix and moved back to a positive trend in April. The stock has also maintained an RS buy signal against the market since 2017. While the technical picture is positive, MRTX is now in overbought territory so those looking to add exposure would be best served to wait for a pullback or normalization of the trading band. Initial support can be found at $136 with further support offered at $126. |
| MYOK Myokardia Inc ($103.58) - Biomedics/Genetics - Shares of MYOK continued to rise Monday and completed a bullish triangle at $104. This 3 for 5'er moved to a positive trend in April and ranks in the top half of the biomedics/genetics sector RS matrix. Weekly and monthly momentum are also each positive, suggesting the potential for further upside from here. Those looking to add exposure may consider the stock at current levels, with initial support offered at $98 and further support found at $97. Note that the stock is currently at overhead resistance from earlier this month, with the potential for further resistance coming next at $106. |
| NSIT Insight Enterprises Inc ($59.23) - Business Products - Shares of NSIT advanced Monday to break a spread triple top at $58 before moving to $59 intraday. This 3 for 5'er moved to a positive trend earlier this month and ranks in the top half of the favored business products sector RS matrix. The stock has also maintained an RS buy signal against the market since mid-2014. Monthly momentum recently flipped positive, suggesting the potential for higher prices. However, this recent price improvement has also moved NSIT into overbought territory with an intraday weekly OBOS reading of 81% Monday. Those looking to add exposure would be best served to wait for a pullback or normalization of the trading band. Initial support can be found at $54, with further support offered at $49, the current location of the bullish support line. |
| PYPL Paypal Holdings Inc ($196.92) - Software - PYPL moved higher Monday and broke a double top at $200. This 4 for 5'er moved to a positive trend in April and just saw weekly momentum flip positive, suggesting the potential for further upside from here. Those looking to add exposure may consider PYPL at current levels, with initial support offered at $192 and further support found at $188. Note that further overhead resistance may be found at the all-time high of $204 from earlier this month. |
| RUN Sunrun Inc ($50.90) - Utilities/Electricity - RUN reversed up into a column of Xs Monday and broke its second consecutive triple top at $50, before advancing to a new all-time high at $51 intraday. This 5 for 5'er moved to a positive trend in May and ranks 1st out of 48 names in the utilities/electricity sector RS matrix. The overall weight of the evidence is positive and continues to improve, however, RUN is now in heavily overbought territory so those looking to add exposure would be best served to wait for a pullback or normalization of the trading band. Initial support can be found at $46 with further support offered at $45 and $42. |
| XBIT Xbiotech Inc ($20.06) - Biomedics/Genetics - XBIT continued higher Monday to break a double top at $20, marking its third consecutive buy signal after the FDA announced the authorization of the company's Convalescent Plasma treatment for Covid-19. This 5 for 5'er ranks in the top quintile of the biomedics/genetics sector RS matrix and moved back to a positive trend earlier this month. Monthly momentum also just flipped positive, suggesting the potential for further price appreciation. Although the technical picture is positive and continues to strengthen, XBIT is now in heavily overbought territory so those looking to add exposure would be best served to wait for a pullback or normalization of the trading band. Initial support can be found at $17.50. |

| Name | Option Symbol | Action | Stop Loss |
|---|---|---|---|
| Crocs, Inc. - $39.34 | O: 20L39.00D18 | Buy the December 39.00 calls at 5.60 | 35.00 |
| Name | Option | Action |
|---|---|---|
| Lowe's Companies, Inc. ( LOW) | Sep. 130.00 Calls | Raise the option stop loss to 33.05 (CP: 35.05) |
| Best Buy Co., Inc. ( BBY) | Oct. 85.00 Calls | Raise the option stop loss to 28.60 (CP: 30.60) |
| Name | Option Symbol | Action | Stop Loss |
|---|---|---|---|
| DENTSPLY SIRONA Inc. - $43.45 | O: 21M45.00D15 | Buy the January 45.00 puts at 5.30 | 47.00 |
| Name | Option | Action |
|---|---|---|
| Seagate Technology (STX) | Oct. 55.00 Puts | Stopped at 9.15 (CP: 9.10) |
| Name | Option Sym. | Call to Sell | Call Price | Investment for 500 Shares | Annual Called Rtn. | Annual Static Rtn. | Downside Protection |
|---|---|---|---|---|---|---|---|
| Bank of America $24.98 | O: 20L27.00D18 | Dec. 27.00 | 1.42 | $12,270.55 | 28.23% | 14.73% | 4.47% |
| Name | Action |
|---|---|
| Wendy's Company (WEN) - 21.79 | Sell the November 22.00 Calls. |
| Teradyne, Inc. (TER) - 88.00 | Sell the January 97.50 Calls. |
| eBay Inc. (EBAY) - 58.21 | Sell the January 60.00 Calls. |
| PulteGroup, Inc. (PHM) - 47.48 | Sell the January 50.00 Calls. |
| Qorvo Inc. (QRVO) - 130.67 | Sell the November 135.00 Calls. |
| Name | Covered Write |
|---|---|
| QUALCOMM Incorporated ( QCOM - 113.00 ) | January 115.00 covered write. |
| J.P. Morgan Chase & Co. ( JPM - 97.32 ) | December 100.00 covered write. |
Daily Equity & Market Analysis
Loading, Please Wait...
