
This Monday morning, we saw the S&P 500 and Nasdaq-100 indexes print new all-time highs. In light of this, today, we want to provide an update on the various indicators we are monitoring in regards to US equities and provide a list of actionable stock ideas for those who may wish to put money to work.
Right out of the gate this Monday morning, we saw the S&P 500 and Nasdaq-100 indexes print new all-time highs at 3,432.09 and 11,728.09, respectively, boosted in part by the positive price action of the "Big Tech 5" stocks. In light of these new all-time index highs, today, we want to provide an update on the various indicators we are monitoring in regards to US equities and provide a list of actionable stock ideas for those who may wish to put money to work in this strengthening asset class.
- After Friday's market action, US equities gained 2 additional tally signals, bringing its signal count up to 226. While fixed income remains the #1 ranked asset class, the gap between #1 and #2 has narrowed significantly to just 3 tally signals. Be sure to set DALI alerts to stay abreast of future shifts in long-term leadership. If the US equities asset class moves ahead of fixed income, we will need to see at least a 5 signal spread between the two before implementing any changes in the DALI-based strategies such as the 3 Legged Stool and DALI Flex.

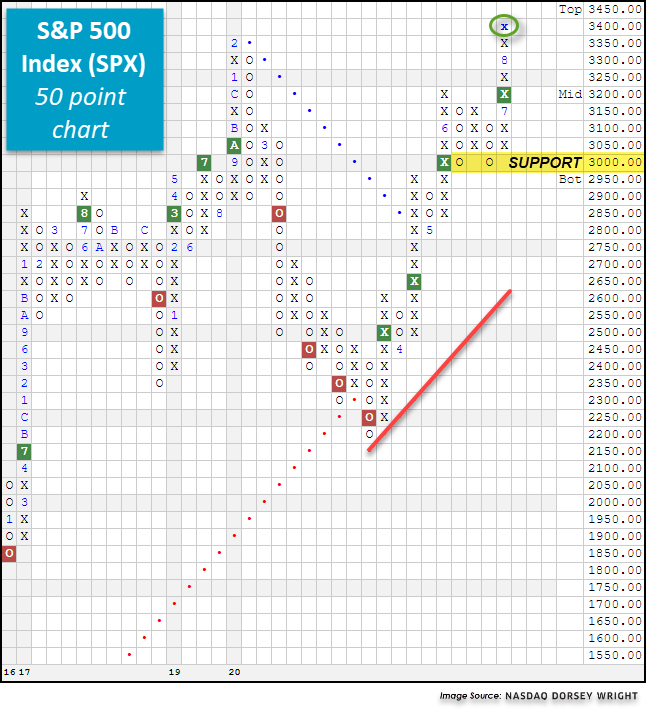
- The long-term 50 point chart of the SPX printed an X at 3,400 with today’s market action, breaking through resistance dating back to February. As a result, this chart is now trading at new all-time highs. From here, initial support sits at 3,000, a level that has been tested on three previous occasions.
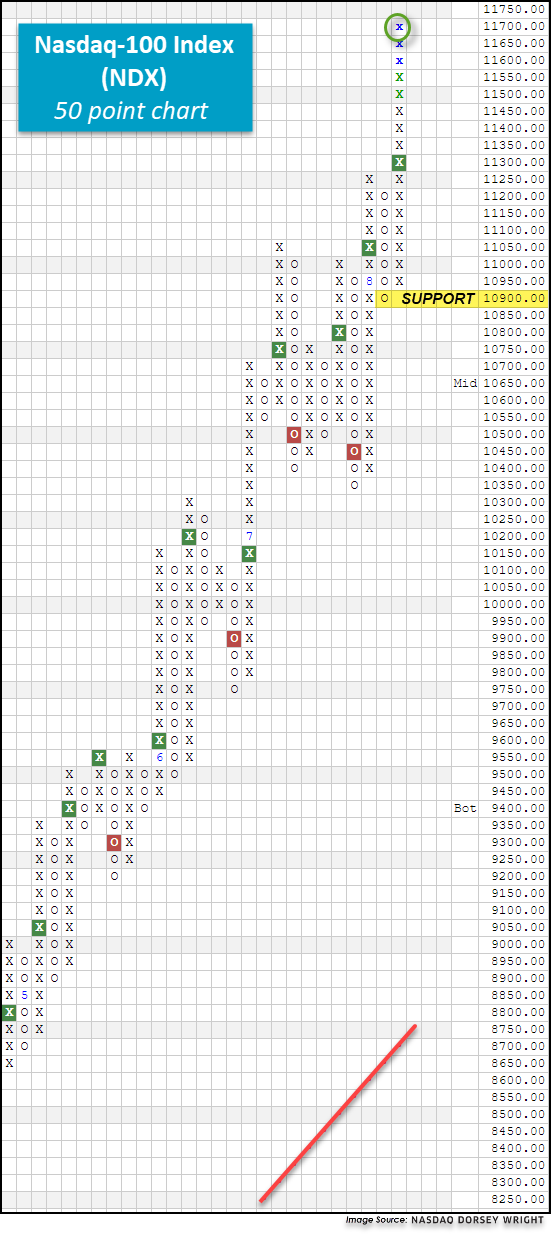
- The long-term 50 point chart of the NDX printed three new Xs today to the 11,700 level, marking a fresh all-time high. Initial support sits at 10,900. The Invesco QQQ Trust , which is the single largest and most widely-traded product to track NDX, also added an X at $285 on its default chart today, providing further bullish evidence that is attributive to its near-perfect fund score of 5.89.
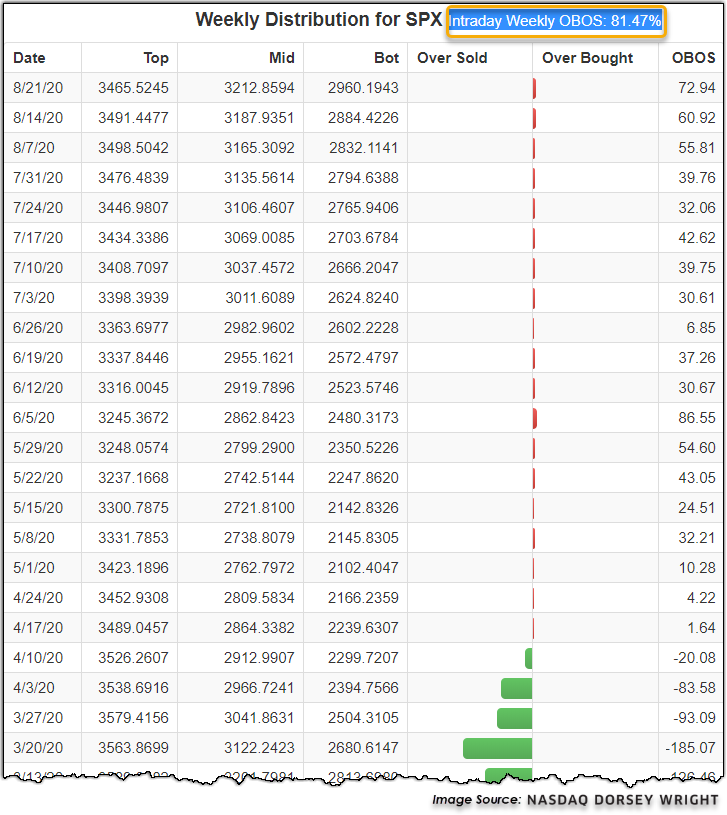
- Based on Monday’s intraday action, the SPX is about 81% overbought based on its 10-week trading band. Back in mid-March, the SPX became as oversold as -186% before becoming 86.55% overbought in early June. While we have seen this OBOS% level stabilize significantly, the SPX is trading in technically overbought territory due to its recent rally. The DJIA is currently 69% overbought, while the NDX is 74% overbought. The average stock is now 6% overbought on its ten-week trading band, as seen on the Weekly Distribution for All Stocks .
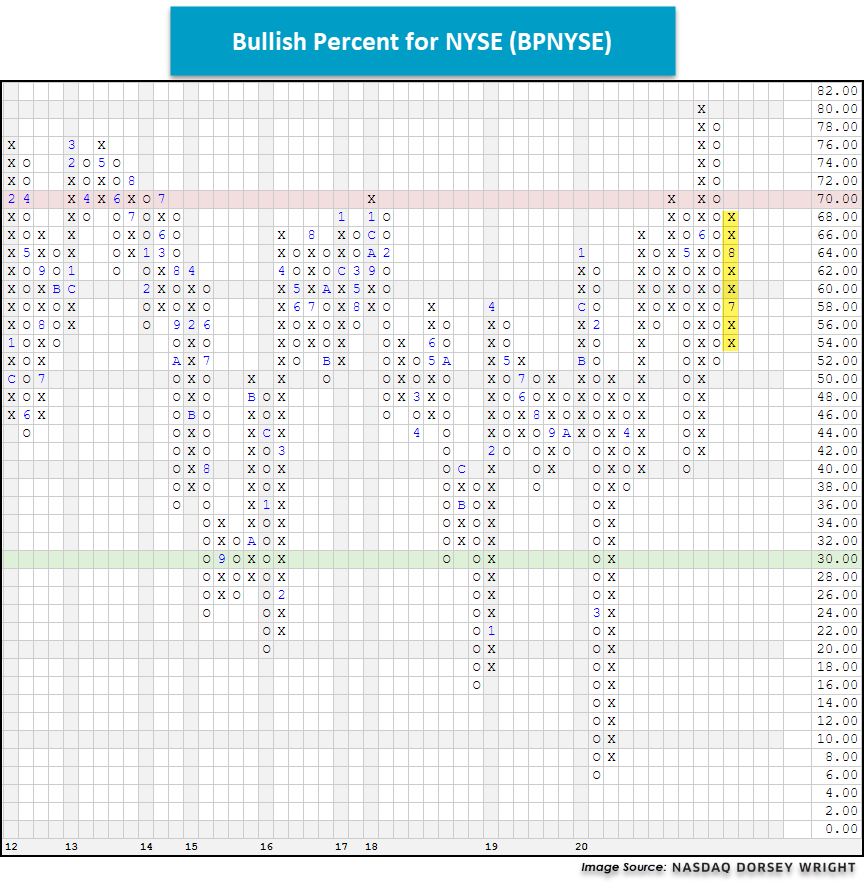
- Participation: the Bullish Percent for NYSE is currently in Xs at 68%. The offensive team is on the field with good field position. For more on the BPNYSE, please refer to the DWA Playbook.
- From a trend standpoint, the Percent Positive Trend for All Stocks is in X’s at 50%, meaning that exactly half of all stocks are trading in a positive trend. Currently, the Percent Positive Trend for NYSE is in Xs at 56%, while the Percent Positive Trend for S&P 500 sits in Xs at 78%. Strong, healthy markets often occur when the PT indicators are above 50%.

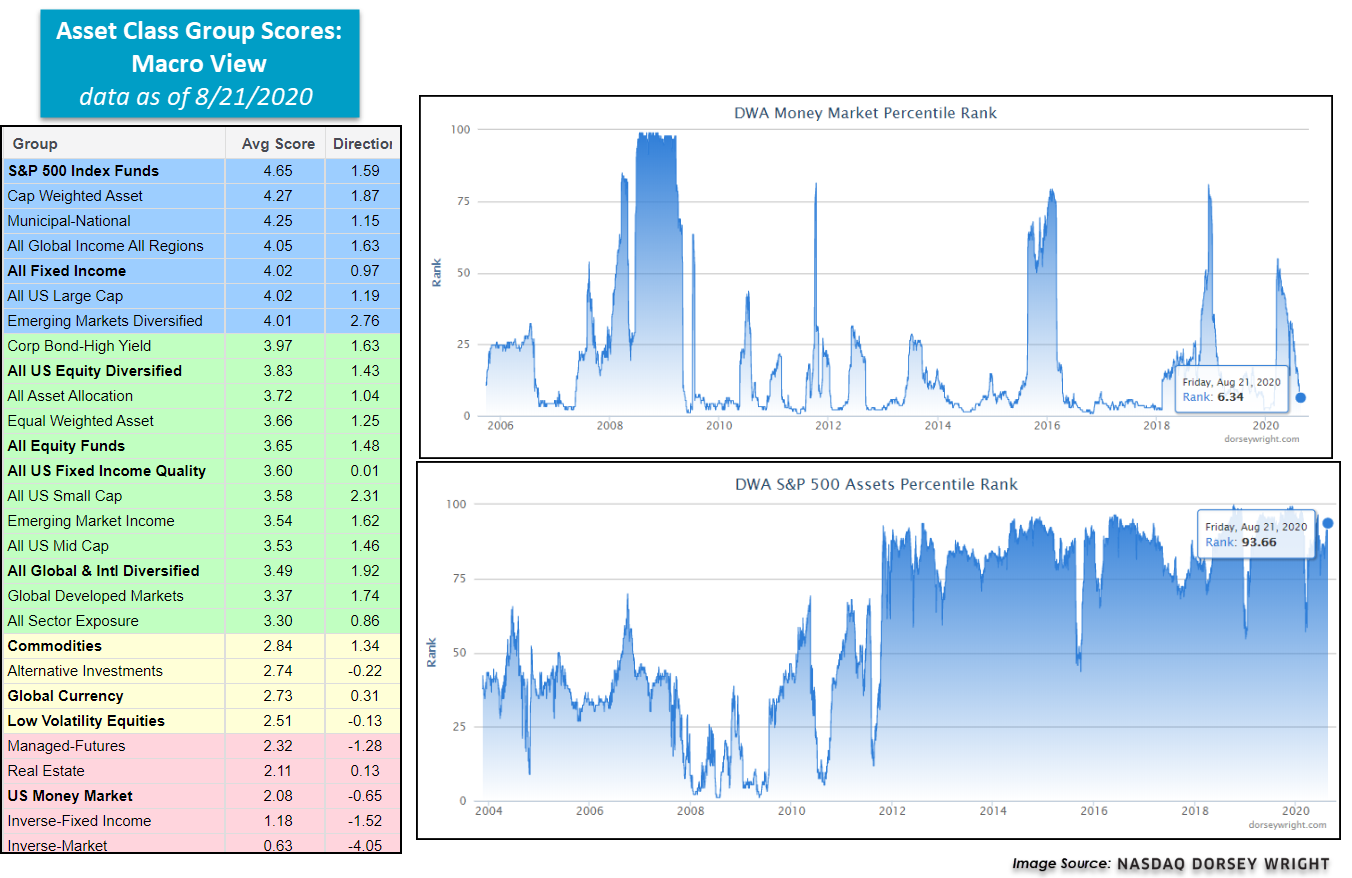
- For those keeping track of the Money Market Percentile Rank (MMPR) and US Equity Core Pct Rank on the Asset Class Group Scores page, the MMPR is now sitting at 6.34%, a low level last seen in late February, while the US Equity Core Percentile Rank has climbed to 93.66%. From a macro-perspective, the S&P 500 Index Group is the strongest with a fund score of 4.65, putting the group in the sought-after blue zone. The All Fixed Income group is also in the blue zone with a score of 4.02.
In order to provide a list of actionable stock ideas, we used the Security Screener tool to generate a list of names meeting certain technical requirements, which we have spelled out below. Note: if you run this same screen after Monday, August 24, your results may differ from ours as each day's action has the potential to alter the results.
Security Screener Filters:
- Universe: S&P 500 Index & Nasdaq-100 Index
- Last Price: > $15
- 30-Day Average Volume: > 500,000
- Optionable = Yes
- Weekly Overbought/Oversold <= 50%
- Technical Attribute = 4 & 5
- Point & Figure Signal = Buy
- Point & Figure Trend = Positive
- Sector Matrix Percentile Rank Between 75 and 100
After we ran the screen, we were left with a list of 23 names which are listed in the table below. As always, if you'd like to discuss any of these names in greater detail, please give us a call at (804) 320-8511.
High-RS Stock Ideas: SPX & NDX
| Symbol |
Name |
Price |
Tech Attrib/Score |
DWA Sector |
Overbought/Oversold |
|
Arthur J. Gallagher & Co. |
103.47 |
5  |
Insurance |
|
|
Align Technology, Inc. |
294.29 |
5 |
Healthcare |
|
|
Ameriprise Financial |
154.51 |
4 |
Finance |
|
|
Amazon.com Inc. |
3284.72 |
4  |
Internet |
|
|
CMS Energy Corporation |
60.39 |
4 |
Utilities/Electricity |
|
|
DocuSign, Inc. |
210.18 |
5 |
Software |
|
|
Fifth Third Bancorp |
19.56 |
4 |
Banks |
|
|
First Republic Bank of San Francisco |
112.97 |
5 |
Banks |
|
|
Hologic Incorporated |
66.75 |
5 |
Healthcare |
|
|
Howmet Aerospace Inc. |
16.91 |
4 |
Aerospace Airline |
|
|
Linde Plc |
244.30 |
5 |
Chemicals |
|
|
Marsh & McLennan Companies, Inc. |
113.47 |
5 |
Insurance |
|
|
Morgan Stanley |
51.10 |
5 |
Wall Street |
|
|
NextEra Energy, Inc. |
282.41 |
4 |
Utilities/Electricity |
|
|
NRG Energy, Inc. |
34.53 |
5 |
Utilities/Electricity |
|
|
ProLogis |
103.04 |
5 |
Real Estate |
|
|
Pioneer Natural Resources |
102.11 |
4 |
Oil |
|
|
Royal Caribbean Cruises Ltd. |
61.53 |
4 |
Leisure |
|
|
Rockwell Automation, Inc. |
228.52 |
5 |
Electronics |
|
|
S&P Global Inc. |
362.01 |
5 |
Media |
|
|
United Rentals, Inc. |
175.06 |
5 |
Machinery and Tools |
|
|
Williams Companies Inc. |
21.41 |
4 |
Gas Utilities |
|
|
Xcel Energy, Inc. |
69.61 |
4 |
Utilities/Electricity |
|
