
Most Requested Symbols

One area of the market that has lagged, but that has recently shown relative strength is the industrials sector. Today, we review some fund ideas that have exemplified this improvement over the past few weeks.
Today's featured stock is Deckers Outdoor Corporation (DECK)
AMZN, ARNA, BXC, ENPH, GOLD, MTH, PENN, W, POST, & SCCO
Call: Williams Companies (WMB), Put: Edison International (EIX), Covered Write: Electronic Arts (EA)
Monday Market Update Webinar Replay: Missed Monday's (8/17) webcast? Click the link(s) below for a recap:
Upcoming KKM webinar: Join KKM on Wednesday, August 19th at 3 pm ET for a webinar focusing on models powered by Nasdaq Dorsey Wright methodology. The topic will be on "Dynamic & Active: Time to revisit two investment themes (powered by Nasdaq Dorsey Wright) for 2020", which is hosted by KKM and sponsored by Adhesion Wealth. Click here to register.
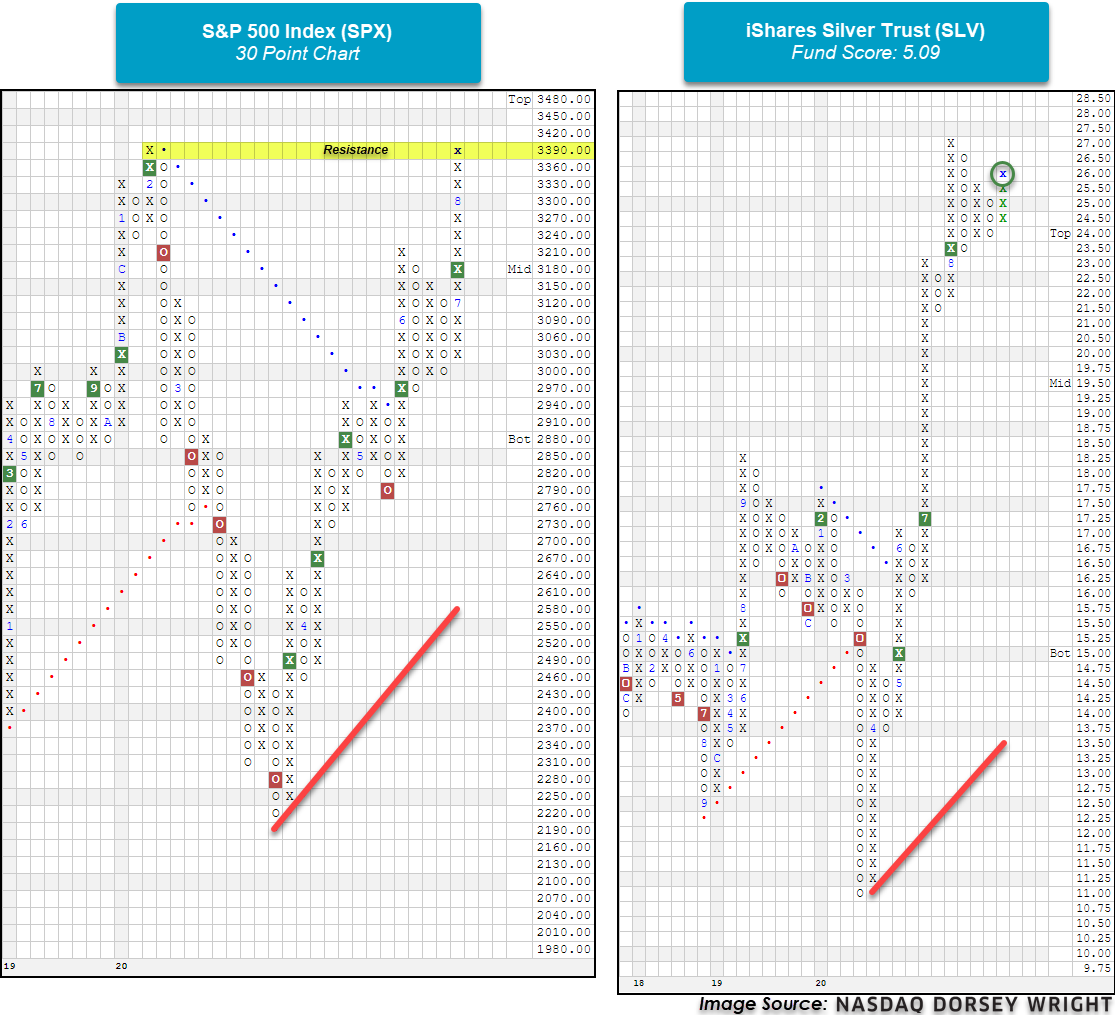
Odds and Ends: The S&P 500 hits a new intraday high and Silver continues higher.
The S&P 500 Index SPX reached a new intraday high of 3395.06 and printed an X at the 3390 mark on its default chart (Source: FactSet). The S&P 500 Index Funds group is the highest scoring group within the macro grouping on the asset class group scores page with an average score of 4.62. On its Point and Figure chart, SPX now sits at resistance established in February of this year.
Precious metals have been a bright spot as the iShares Silver Trust SLV broke a double top with today’s intraday action to complete bullish triangle and is now on its fourth consecutive buy signal. SLV has a fund score of 5.09 and a positive score direction of 3.08. Recent price action has put SLV into heavily overbought territory with an overbought/oversold reading of 134%. Those wishing to take a long position may be best served to wait for a pullback or price normalization before doing so. The precious metals group on the asset class group scores page currently has an average group score of 4.44 highlighting the strength of the sector.

(Source: etf.com)
There has been talking in the financial media about the so-called “reopening” or “rotation” trade, i.e. a rotation out of the stocks/sectors that held up best and recovered earliest from the coronavirus sell-off, primarily technology stocks, and into areas that should benefit as the economy recovers.
One area of the market that has lagged, but that has recently shown relative strength is the industrials sector. Year-to-date (through 8/17), the S&P 500 Industrials Sector .SPSI is down -4.83%, trailing the broad S&P 500 SPX, which is up 4.63%, by almost 9.5% and while the S&P 500 matched its all-time chart, which it reached in February, SPSI is -7.63% over the same period (2/19 – 8/17). In last week’s trading, the industrials group climbed above the 4.0 score threshold and into the blue zone within the Asset Class Group Scores (ACGS) for the first time since February, placing it in the top third of all 135 groups in the ACGS system. While industrials remains in the bottom half of the DALI domestic equity sector rankings, it has improved in recent months. After falling to 10th place and hitting a low of 82 signals, industrials has gained 42 signals and climbed to seventh place; only the consumer cyclicals sector has gained more buy signals during the same period.

Investors who want to add exposure to the industrials sector have a variety of options at their disposal. Today we’ll take a look at two of them – the iShares U.S. Industrial ETF IYJ which offers exposure to the broad industrials sector and the Invesco DWA Industrials Momentum ETF PRN, which utilizes a momentum or relative strength overlay among stocks in the sector.
The first fund we will examine that has been indicative of the recent improvement within the industrials space is the broad iShares U.S. Industrial ETF IYJ. This fund fell to a multi-year low of $102 with the broad market decline in March, before reversing higher to move back to a positive trend in May at $142 and most recently completing a bullish triangle in July, leading the fund to current levels at $168. While the fund has shown a gain of over 61% since its bottom on March 23, outperforming the S&P 500 Index SPX that has risen 51% during the same timeframe (through 8/17), IYJ remains just over 4.5% off a new all-time chart high, which would come with movement to $176. Furthermore, the price normalization over the past week has led the fund to more actionable territory with an intraday weekly overbought/oversold (OBOS) reading of 62% at the time of this writing.
The near-term strength of IYJ is also displayed by the favorable recent 4.30 fund score posting, which bests the average industrials fund of 4.18 as well as the average all US fund at 3.71, and is paired with a strongly positive score direction of 2.87. Weekly and monthly momentum also recently flipped positive, suggesting the potential for further upside from here. The technical picture is strong and continues to improve, however, those considering long exposure should note that IYJ is on somewhat of a stem at current levels, with initial support offered at $146 and further support potentially found at $144.

In order to gain more perspective on the movement within the fund that has produced this near-term strength, we can examine the exposure breakdown of the underlying holdings for a more focused view of the underlying holdings. This shows that the two largest industry exposure are aerospace & defense and data processing services which each have weightings of around 14%.

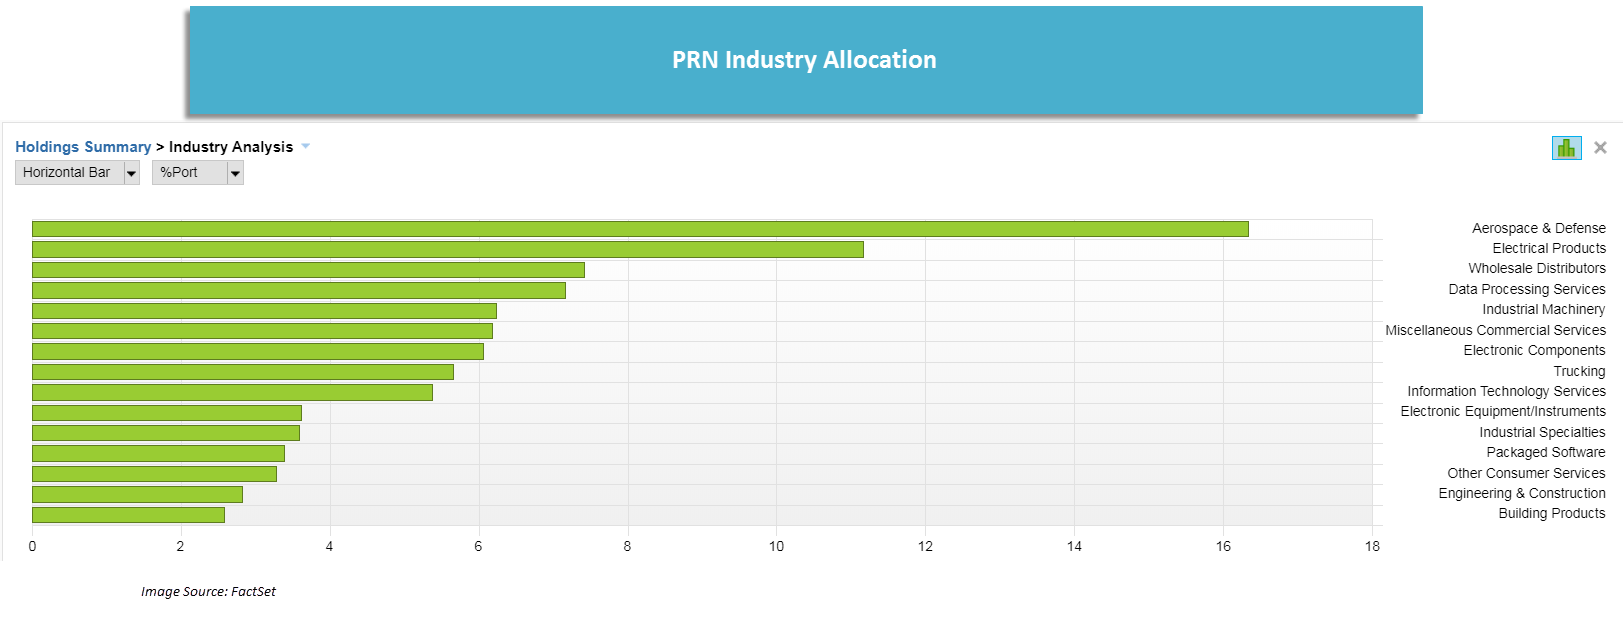
The Invesco DWA Industrials Momentum ETF PRN has a strong 5.30 fund score, 1.12 points better than the average for all industrial funds and a positive 2.34 fund score direction, speaking to the recent improvement of the fund and the sector. While the broader industrials sector has not reclaimed the all-time high it reached in February, PRN reached a new high on its default chart last week after giving its fifth consecutive buy signal. Also unlike the broader industrials sector, PRN has outperformed the S&P 500 year-to-date (though 8/17) as it gained 11.86% versus 4.68% for the index.

While both IYJ and PRN are industrial sector funds, the year-to-date outperformance of PRN (11.86%) vs. IYJ (0.10%) shows that the fund has clearly benefited from its momentum overlay and looking at the industry allocations of each fund we can see that there notable differences between the two portfolios. As with IYJ, PRN's largest allocation is to aerospace & defense, however, PRN's second largest allocation, at around 11% is electrical products, more than twice IYJ's allocation. PRN also has approximately a 7% allocation to wholesale distributors.


Two Invesco Model Changes: GUGGSO & POWERSMALL
There are changes to two Invesco models this week. First, the Invesco Small Cap Sector Model POWERSMALL sold the Invesco S&P Smallcap Healthcare ETF PSCH and added the Invesco S&P Smallcap Consumer Discretionary ETF PSCD. PSCH was removed because its rank in the model’s relative strength... (Read more)
New Highs for the iShares Russell 1000 Growth ETF IWF
There are no changes to any of the iShares models this week. The iShares Russell 1000 Growth ETF IWF gave an eighth consecutive buy signal on its default chart last week when it completed a bullish catapult at $210, marking a new all-time high for the fund. Large cap growth continues to lead the DALI domestic equity size and style rankings as it has for the majority of the year... (Read more)
ETF Spotlight: VictoryShares US 500 Enhanced Volatility Wtd WTF CFO
Whether evoking alarm, happiness, or confusion, broad large-cap equity indices are within single digits of new all-time highs; a topic further articulated in last week’s (8/13) Prospecting: Peak to (almost) Peak section. In fact, although summer months are historically associated with lackluster returns in the investment world, 2020 is on track to override its Summertime Blues as the S&P 500 SPX, Dow Jones Industrial Average DJIA, and Nasdaq Composite NASD have currently posted gains of 14.43%, 13.81%, and ... (Read more)
Average Level
36.23
| AGG | iShares US Core Bond ETF |
| USO | United States Oil Fund |
| DIA | SPDR Dow Jones Industrial Average ETF |
| DVY | iShares Dow Jones Select Dividend Index ETF |
| DX/Y | NYCE U.S.Dollar Index Spot |
| EFA | iShares MSCI EAFE ETF |
| FXE | Invesco CurrencyShares Euro Trust |
| GLD | SPDR Gold Trust |
| GSG | iShares S&P GSCI Commodity-Indexed Trust |
| HYG | iShares iBoxx $ High Yield Corporate Bond ETF |
| ICF | iShares Cohen & Steers Realty ETF |
| IEF | iShares Barclays 7-10 Yr. Tres. Bond ETF |
| LQD | iShares iBoxx $ Investment Grade Corp. Bond ETF |
| IJH | iShares S&P 400 MidCap Index Fund |
| ONEQ | Fidelity Nasdaq Composite Index Track |
| QQQ | Invesco QQQ Trust |
| RSP | Invesco S&P 500 Equal Weight ETF |
| IWM | iShares Russell 2000 Index ETF |
| SHY | iShares Barclays 1-3 Year Tres. Bond ETF |
| IJR | iShares S&P 600 SmallCap Index Fund |
| SPY | SPDR S&P 500 Index ETF Trust |
| TLT | iShares Barclays 20+ Year Treasury Bond ETF |
| GCC | WisdomTree Continuous Commodity Index Fund |
| VOOG | Vanguard S&P 500 Growth ETF |
| VOOV | Vanguard S&P 500 Value ETF |
| EEM | iShares MSCI Emerging Markets ETF |
| XLG | Invesco S&P 500 Top 50 ETF |

| Symbol | Company | Sector | Current Price | Action Price | Target | Stop | Notes |
|---|---|---|---|---|---|---|---|
| MS | Morgan Stanley | Wall Street | $51.28 | hi 40s - low 50s | 70 | 43 | 5 for 5'er, top quartile of WALL sector matrix, LT pos mkt RS, 2.9% yield, good R-R |
| NOW | Servicenow Inc | Software | $442.37 | low 440s to upper 460s | $588 | $344 | 4 for 5'er, 8 consec buy signals, pullback from AT high, LT makret RS buy signal |
| PII | Polaris Inc. | Leisure | $104.95 | low $100s to mid $110s | $138 | $84 | 5 for 5'er, one box from 5th consec buy signal, pos weekly mom flip, 2 mons pos month momentum, 2.36% yield |
| NRG | NRG Energy, Inc. | Utilities/Electricity | $35.30 | mid to upper 30s | $49 | $27 | 5 for 5'er, LT market RS buy signal, consec buy signals, pos mon and weekly momentum, 3.58% yield |
| CTAS | Cintas Corporation | Textiles/Apparel | $320.99 | low 300s to mid 330s | $400 | $252 | 5 for 5'er, top 25% of favored DWATEXT sector, pos mon & weekly mom, LT market/peer RS buy signals, up against ATH. |
| WMB | Williams Companies Inc. | Gas Utilities | $22.34 | 20 - 22 | 26.5 | 17 | 4 for 5'er, top 10% of GUTI sector matrix, 7.7% yield, pot. covered write |
| DXCM | Dexcom Inc. | Healthcare | $440.92 | 410s to 470s | 488 | 360 | 5 for 5'er, pullback from AT high, consec buy signals, LT market RS buy signal, top 1/3 of DWAHEAL |
| EBAY | eBay Inc. | Internet | $57.35 | mid-to-upper 50s | 100 | 46 | 5 for 5'er, top third of favored INET sector matrix, LT pos mkt RS, pullback from ATH |
| NKE | NIKE, Inc. | Textiles/Apparel | $105.66 | hi 90s - mid 100s | 112 | 89 | 4 for 5'er, top half of TEXT sector matrix, LT pos mkt RS, big base breakout to new ATH |
| DECK | Deckers Outdoor Corporation | Textiles/Apparel | $212.16 | low 200s to mid 230s | 284 | 178 | 5 for 5'er, pullback from ATH, consec buy signals, pos mon mom, top 10% of DWATEXT |
| Symbol | Company | Sector | Current Price | Action Price | Target | Stop | Notes |
|---|---|---|---|---|---|---|---|
| THS | TreeHouse Foods, Inc. | Food Beverages/Soap | $43.22 | low to mid 40s | 36 | 53 | 0 for 5'er, consec sell signals, LT market RS sell signal, bottom quartile of DWAFOOD |
| Symbol | Company | Sector | Current Price | Action Price | Target | Stop | Notes |
|---|---|---|---|---|---|---|---|
| SNPS | Synopsys Inc | Software | $200.21 | mid 190s to low 210s | 228 | 162 | See follow comment below. |
| Comment |
|---|
| BIG Big Lots, Inc. R ($48.52) - Retailing - Raise stop to $38, the first sell signal on the default chart. |
| CREE Cree Research Inc R ($68.94) - Semiconductors - Raise stop to $56 which would take out multiple levels of support on the default chart. |
| SNPS Synopsys Inc R ($200.11) - Software - Okay to add new exposure here. We will maintain our $162 stop. Note earnings are expected 8/19. |
DECK Deckers Outdoor Corporation R ($212.12) - Textiles/Apparel - DECK is a perfect 5 for 5’er that ranks 3rd out of 21 names in the textiles/apparel sector RS matrix. In May, DECK returned to a positive trend and has experienced two months of positive monthly momentum. This stock has given three consecutive buy signals since July, confirming that demand is in control. After reaching a new all-time high at $224 this month, DECK pulled back slightly to $212 and remains well above initial support at $198. New positions are welcome in the low 200s to mid 230s. We will set our initial stop at $178, which would take out multiple levels of support on DECK’s default chart, and we will use a modified bullish price objective of $284 as our near-term price target.
| 224.00 | X | 224.00 | |||||||||||||||||||||||||||||||||||||||||||||||||||
| 220.00 | X | X | O | 220.00 | |||||||||||||||||||||||||||||||||||||||||||||||||
| 216.00 | X | X | O | X | O | 216.00 | |||||||||||||||||||||||||||||||||||||||||||||||
| 212.00 | X | O | X | O | X | O | 212.00 | ||||||||||||||||||||||||||||||||||||||||||||||
| 208.00 | X | O | X | O | 8 | 208.00 | |||||||||||||||||||||||||||||||||||||||||||||||
| 204.00 | • | X | O | X | X | X | X | O | X | 204.00 | |||||||||||||||||||||||||||||||||||||||||||
| 200.00 | X | • | X | O | X | X | O | X | O | X | X | X | O | X | O | X | Mid | 200.00 | |||||||||||||||||||||||||||||||||||
| 198.00 | X | O | • | X | O | X | X | O | X | O | X | O | 7 | O | X | O | X | O | X | O | 198.00 | ||||||||||||||||||||||||||||||||
| 196.00 | O | X | O | • | X | X | O | X | O | X | O | X | O | O | X | O | X | O | X | O | 196.00 | ||||||||||||||||||||||||||||||||
| 194.00 | O | X | O | • | X | O | X | O | X | O | X | O | O | X | O | X | O | X | 194.00 | ||||||||||||||||||||||||||||||||||
| 192.00 | 2 | X | O | • | X | O | X | O | X | O | X | O | X | O | X | O | X | 192.00 | |||||||||||||||||||||||||||||||||||
| 190.00 | O | X | O | • | X | O | X | O | X | O | X | O | X | O | X | O | 190.00 | ||||||||||||||||||||||||||||||||||||
| 188.00 | O | O | • | X | X | O | 6 | O | O | O | X | O | X | 188.00 | |||||||||||||||||||||||||||||||||||||||
| 186.00 | O | • | X | O | X | O | X | O | O | 186.00 | |||||||||||||||||||||||||||||||||||||||||||
| 184.00 | O | X | • | X | O | X | O | X | 184.00 | ||||||||||||||||||||||||||||||||||||||||||||
| 182.00 | O | X | O | • | X | O | X | O | 182.00 | ||||||||||||||||||||||||||||||||||||||||||||
| 180.00 | O | X | O | • | X | O | 180.00 | ||||||||||||||||||||||||||||||||||||||||||||||
| 178.00 | O | X | O | • | X | 178.00 | |||||||||||||||||||||||||||||||||||||||||||||||
| 176.00 | O | 3 | O | • | X | 176.00 | |||||||||||||||||||||||||||||||||||||||||||||||
| 174.00 | O | X | O | • | X | 174.00 | |||||||||||||||||||||||||||||||||||||||||||||||
| 172.00 | O | X | O | • | X | 172.00 | |||||||||||||||||||||||||||||||||||||||||||||||
| 170.00 | O | • | O | • | X | 170.00 | |||||||||||||||||||||||||||||||||||||||||||||||
| 168.00 | • | • | O | X | • | X | 168.00 | ||||||||||||||||||||||||||||||||||||||||||||||
| 166.00 | • | O | X | O | • | X | 166.00 | ||||||||||||||||||||||||||||||||||||||||||||||
| 164.00 | O | X | O | • | X | 164.00 | |||||||||||||||||||||||||||||||||||||||||||||||
| 162.00 | O | X | O | • | X | 162.00 | |||||||||||||||||||||||||||||||||||||||||||||||
| 160.00 | O | X | O | • | X | 160.00 | |||||||||||||||||||||||||||||||||||||||||||||||
| 158.00 | O | X | O | X | • | X | Bot | 158.00 | |||||||||||||||||||||||||||||||||||||||||||||
| 156.00 | O | X | O | X | O | • | X | 156.00 | |||||||||||||||||||||||||||||||||||||||||||||
| 154.00 | O | X | O | X | O | • | X | 154.00 | |||||||||||||||||||||||||||||||||||||||||||||
| 152.00 | O | O | X | O | • | X | 152.00 | ||||||||||||||||||||||||||||||||||||||||||||||
| 150.00 | O | X | X | X | O | X | X | 150.00 | |||||||||||||||||||||||||||||||||||||||||||||
| 148.00 | O | X | O | X | O | X | X | X | O | X | X | O | X | 148.00 | |||||||||||||||||||||||||||||||||||||||
| 146.00 | O | X | O | X | O | X | O | X | O | X | 5 | X | O | X | O | X | 146.00 | ||||||||||||||||||||||||||||||||||||
| 144.00 | O | X | O | X | O | X | O | X | O | X | O | X | O | X | O | X | • | 144.00 | |||||||||||||||||||||||||||||||||||
| 142.00 | O | X | O | O | O | X | O | X | O | X | O | X | O | X | • | 142.00 | |||||||||||||||||||||||||||||||||||||
| 140.00 | O | X | X | X | O | X | O | X | O | O | O | X | • | 140.00 | |||||||||||||||||||||||||||||||||||||||
| 138.00 | O | X | O | X | O | X | O | O | X | O | X | • | 138.00 | ||||||||||||||||||||||||||||||||||||||||
| 136.00 | O | X | O | X | O | X | O | X | O | X | • | 136.00 | |||||||||||||||||||||||||||||||||||||||||
| 134.00 | O | X | O | X | O | X | O | X | O | X | • | 134.00 | |||||||||||||||||||||||||||||||||||||||||
| 132.00 | O | X | O | X | 4 | X | O | O | X | • | 132.00 | ||||||||||||||||||||||||||||||||||||||||||
| 130.00 | O | X | O | O | X | O | • | 130.00 | |||||||||||||||||||||||||||||||||||||||||||||
| 128.00 | O | X | O | X | X | • | 128.00 | ||||||||||||||||||||||||||||||||||||||||||||||
| 126.00 | O | X | O | X | O | X | • | 126.00 | |||||||||||||||||||||||||||||||||||||||||||||
| 124.00 | O | X | O | X | O | X | • | 124.00 | |||||||||||||||||||||||||||||||||||||||||||||
| 122.00 | O | X | O | O | X | • | 122.00 | ||||||||||||||||||||||||||||||||||||||||||||||
| 120.00 | O | X | O | • | 120.00 | ||||||||||||||||||||||||||||||||||||||||||||||||
| 118.00 | O | X | • | 118.00 | |||||||||||||||||||||||||||||||||||||||||||||||||
| 116.00 | O | X | • | 116.00 | |||||||||||||||||||||||||||||||||||||||||||||||||
| 114.00 | O | X | • | 114.00 | |||||||||||||||||||||||||||||||||||||||||||||||||
| 112.00 | O | X | • | 112.00 | |||||||||||||||||||||||||||||||||||||||||||||||||
| 110.00 | O | X | • | 110.00 | |||||||||||||||||||||||||||||||||||||||||||||||||
| 108.00 | O | X | • | 108.00 | |||||||||||||||||||||||||||||||||||||||||||||||||
| 106.00 | O | X | • | 106.00 | |||||||||||||||||||||||||||||||||||||||||||||||||
| 104.00 | O | X | • | 104.00 | |||||||||||||||||||||||||||||||||||||||||||||||||
| 102.00 | O | X | • | 102.00 | |||||||||||||||||||||||||||||||||||||||||||||||||
| 100.00 | O | X | • | 100.00 | |||||||||||||||||||||||||||||||||||||||||||||||||
| 99.00 | O | X | • | 99.00 | |||||||||||||||||||||||||||||||||||||||||||||||||
| 98.00 | O | X | • | 98.00 | |||||||||||||||||||||||||||||||||||||||||||||||||
| 97.00 | O | X | • | 97.00 | |||||||||||||||||||||||||||||||||||||||||||||||||
| 96.00 | O | X | • | 96.00 | |||||||||||||||||||||||||||||||||||||||||||||||||
| 95.00 | O | X | • | 95.00 | |||||||||||||||||||||||||||||||||||||||||||||||||
| 94.00 | O | X | • | 94.00 | |||||||||||||||||||||||||||||||||||||||||||||||||
| 93.00 | O | X | • | 93.00 | |||||||||||||||||||||||||||||||||||||||||||||||||
| 92.00 | O | X | • | 92.00 | |||||||||||||||||||||||||||||||||||||||||||||||||
| 91.00 | O | X | • | 91.00 | |||||||||||||||||||||||||||||||||||||||||||||||||
| 90.00 | O | X | • | 90.00 | |||||||||||||||||||||||||||||||||||||||||||||||||
| 89.00 | O | X | • | 89.00 | |||||||||||||||||||||||||||||||||||||||||||||||||
| 88.00 | O | X | • | 88.00 | |||||||||||||||||||||||||||||||||||||||||||||||||
| 87.00 | O | X | • | 87.00 | |||||||||||||||||||||||||||||||||||||||||||||||||
| 86.00 | O | X | • | 86.00 | |||||||||||||||||||||||||||||||||||||||||||||||||
| 85.00 | O | X | • | 85.00 | |||||||||||||||||||||||||||||||||||||||||||||||||
| 84.00 | O | X | • | 84.00 | |||||||||||||||||||||||||||||||||||||||||||||||||
| 83.00 | O | X | • | 83.00 | |||||||||||||||||||||||||||||||||||||||||||||||||
| 82.00 | O | X | • | 82.00 | |||||||||||||||||||||||||||||||||||||||||||||||||
| 81.00 | O | X | • | 81.00 | |||||||||||||||||||||||||||||||||||||||||||||||||
| 80.00 | O | X | • | 80.00 | |||||||||||||||||||||||||||||||||||||||||||||||||
| 79.00 | O | • | 79.00 |
| AMZN Amazon.com Inc. ($3,278.54) - Internet - AMZN broke a quadruple top at 3264 with Tuesday’s market action, returning the stock to a buy signal. AMZN is a 4 for 5’er that has been trading in a positive trend since January 2015. Also, AMZN has maintained a long-term market RS buy signal since April 2007. Demand is in control, and the technical picture is positive. From here, initial support sits at 3104 while overhead resistance sits at 3328. |
| ARNA Arena Pharmaceuticals, Inc. ($66.47) - Biomedics/Genetics - ARNA returned to a buy signal with a double top breakout at $67. This stock is a perfect 5 for 5’er as all of its trending and relative strength characteristics are positive here. Additionally, ARNA ranks 37th out of 128 names in the biomedics/genetics sector RS matrix and has experienced four months of positive monthly momentum. From here, initial support sits at $63, while ARNA faces overhead resistance at $69. |
| BXC BlueLinx Holdings Inc. ($20.98) - Building - BXC broke a triple top at $21 on Wednesday, marking the stock’s fifth consecutive buy signal since April of this year. BXC is a perfect 5 for 5’er that moved back into a positive trend earlier this month. In addition, monthly momentum has been positive for two months, suggesting the potential for higher prices. Demand is in control; however, BXC is heavily overbought here. Initial support sits at $18.50, while BXC faces resistance at $22. |
| ENPH Enphase Energy Inc ($75.70) - Electronics - ENPH broke a triple top at $77 on Tuesday, marking the second consecutive buy signal on the chart as well as a new all-time high. This stock is a perfect 5 for 5’er within the favored electronics sector that ranks 5th out of 63 names in the sector RS matrix. Monthly momentum just flipped positive and ENPH is trading in an overall positive trend. From here, initial support sits at $73. |
| GOLD Barrick Gold Corporation ($30.12) - Precious Metals - GOLD broke a double top at $31 and is now trading at new multi-year highs. Tuesday’s breakout marks the fifth consecutive buy signal on the chart, confirming that demand is in control. GOLD is a 4 for 5’er that just experienced a flip to positive weekly momentum. Demand is in control. From here, initial support sits at $26. |
| MTH Meritage Homes Corporation ($103.90) - Building - MTH completed a bullish catapult pattern on Tuesday and marked a new all-time high with a move to $106. This stock is a perfect 5 for 5’er that is trading well above the bullish support line. Also, MTH ranks 4th out of 75 names in the building sector RS matrix, making this one of the stronger names in this favored sector. From here, initial support sits at $98. |
| PENN Penn National Gaming Inc ($55.62) - Gaming - PENN broke a double top at $55, marking the stock’s fifth consecutive buy signal since July, confirming that demand is firmly in control. Tuesday’s move also marked a new all-time high for this 5 for 5’er that ranks #1 in the favored gaming sector RS Matrix. Weekly momentum has been positive for three weeks. Demand is in control; however, PENN is nearing heavily overbought territory. From here, initial support sits at $51. |
| POST Post Holdings Inc ($86.70) - Food Beverages/Soap - POST broke a double bottom at $86, a move that also violated the stock’s bullish support line. As a result, POST is now a weak 2 for 5’er that is trading in a negative trend. Weekly momentum just flipped negative, suggesting the potential for lower prices. No new positions here. POST is testing support at current levels, with additional support offered between $84 - $85. |
| SCCO Southern Copper Corporation ($46.68) - Metals Non Ferrous - SCCO broke a double top at $47 and is now trading at new multi-year highs. Today’s breakout marks the fourth consecutive buy signal, confirming that demand is in control of this 5 for 5’er. From here, initial support sits at $43. Note SCCO provides a yield of 3.54%. |
| W Wayfair Inc. ($331.79) - Retailing - W broke a triple top at $324 before moving higher to $332 with today’s market action. This breakout marks the fourth consecutive buy signal for the stock and marks a new all-time high. W is a perfect 5 for 5’er that ranks #1 out of 82 names in the retailing sector RS matrix, making this one of the strongest names in this favored sector. From here, initial support sits at $308. Note that W is more than 100% overbought at current levels. |
| Name | Option Symbol | Action | Stop Loss |
|---|---|---|---|
| Williams Companies Inc. - $21.78 | WMB2115A20 | Buy the January 20.00 calls at 2.80 | 18.00 |
| Name | Option | Action |
|---|---|---|
| Home Depot, Inc. ( HD) | Sep. 250.00 Calls | Raise the option stop loss to 34.05 (CP: 36.05) |
| Lowe's Companies, Inc. ( LOW) | Sep. 130.00 Calls | Raise the option stop loss to 26.20 (CP: 28.20) |
| Fastenal Company ( FAST) | Nov. 40.00 Calls | Raise the option stop loss to 6.80 (CP: 8.80) |
| J.P. Morgan Chase & Co. ( JPM) | Dec. 95.00 Calls | Stopped at 11.10 (CP: 9.25) |
| Carmax Group ( KMX) | Oct. 92.50 Calls | Raise the option stop loss to 14.70 (CP: 16.70) |
| Best Buy Co., Inc. ( BBY) | Oct. 85.00 Calls | Raise the option stop loss to 23.90 (CP: 25.90) |
| Discover Financial Services ( DFS) | Oct. 45.00 Calls | Stopped at 9.20 (CP: 7.40) |
| Name | Option Symbol | Action | Stop Loss |
|---|---|---|---|
| Edison International - $51.74 | EIX2018L55 | Buy the December 57.50 puts at 2.10 | 58.00 |
| Name | Option | Action |
|---|---|---|
| Smartsheet, Inc. Class A (SMAR) | Nov. 50.00 Puts | Stopped at 8.90 (CP: 7.10) |
| Name | Option Sym. | Call to Sell | Call Price | Investment for 500 Shares | Annual Called Rtn. | Annual Static Rtn. | Downside Protection |
|---|---|---|---|---|---|---|---|
| Electronic Arts Inc. $140.45 | EA2018L150 | Dec. 150.00 | 7.85 | $68,021.20 | 27.56% | 13.96% | 4.46% |
| Name | Action |
|---|---|
| Wendy's Company (WEN) - 21.31 | Sell the November 22.00 Calls. |
| Lennar Corporation (LEN) - 77.07 | Sell the November 75.00 Calls. |
| Teradyne, Inc. (TER) - 91.98 | Sell the January 97.50 Calls. |
| eBay Inc. (EBAY) - 57.35 | Sell the January 60.00 Calls. |
| Discover Financial Services (DFS) - 52.59 | Sell the January 60.00 Calls. |
| PulteGroup, Inc. (PHM) - 46.43 | Sell the January 50.00 Calls. |
| Pennymac Mortgage Investment Trust (PMT) - 17.87 | Sell the January 20.00 Calls. |
| Name | Covered Write |
|---|---|
| JD.COM INC ( JD - 66.98 ) | October 65.00 covered write. |
Daily Equity & Market Analysis
Loading, Please Wait...
