One area of the market that has lagged, but that has recently shown relative strength is the industrials sector. Today, we review some fund ideas that have exemplified this improvement over the past few weeks.
There has been talking in the financial media about the so-called “reopening” or “rotation” trade, i.e. a rotation out of the stocks/sectors that held up best and recovered earliest from the coronavirus sell-off, primarily technology stocks, and into areas that should benefit as the economy recovers.
One area of the market that has lagged, but that has recently shown relative strength is the industrials sector. Year-to-date (through 8/17), the S&P 500 Industrials Sector .SPSI is down -4.83%, trailing the broad S&P 500 SPX, which is up 4.63%, by almost 9.5% and while the S&P 500 matched its all-time chart, which it reached in February, SPSI is -7.63% over the same period (2/19 – 8/17). In last week’s trading, the industrials group climbed above the 4.0 score threshold and into the blue zone within the Asset Class Group Scores (ACGS) for the first time since February, placing it in the top third of all 135 groups in the ACGS system. While industrials remains in the bottom half of the DALI domestic equity sector rankings, it has improved in recent months. After falling to 10th place and hitting a low of 82 signals, industrials has gained 42 signals and climbed to seventh place; only the consumer cyclicals sector has gained more buy signals during the same period.

Investors who want to add exposure to the industrials sector have a variety of options at their disposal. Today we’ll take a look at two of them – the iShares U.S. Industrial ETF IYJ which offers exposure to the broad industrials sector and the Invesco DWA Industrials Momentum ETF PRN, which utilizes a momentum or relative strength overlay among stocks in the sector.
The first fund we will examine that has been indicative of the recent improvement within the industrials space is the broad iShares U.S. Industrial ETF IYJ. This fund fell to a multi-year low of $102 with the broad market decline in March, before reversing higher to move back to a positive trend in May at $142 and most recently completing a bullish triangle in July, leading the fund to current levels at $168. While the fund has shown a gain of over 61% since its bottom on March 23, outperforming the S&P 500 Index SPX that has risen 51% during the same timeframe (through 8/17), IYJ remains just over 4.5% off a new all-time chart high, which would come with movement to $176. Furthermore, the price normalization over the past week has led the fund to more actionable territory with an intraday weekly overbought/oversold (OBOS) reading of 62% at the time of this writing.
The near-term strength of IYJ is also displayed by the favorable recent 4.30 fund score posting, which bests the average industrials fund of 4.18 as well as the average all US fund at 3.71, and is paired with a strongly positive score direction of 2.87. Weekly and monthly momentum also recently flipped positive, suggesting the potential for further upside from here. The technical picture is strong and continues to improve, however, those considering long exposure should note that IYJ is on somewhat of a stem at current levels, with initial support offered at $146 and further support potentially found at $144.

In order to gain more perspective on the movement within the fund that has produced this near-term strength, we can examine the exposure breakdown of the underlying holdings for a more focused view of the underlying holdings. This shows that the two largest industry exposure are aerospace & defense and data processing services which each have weightings of around 14%.

The Invesco DWA Industrials Momentum ETF PRN has a strong 5.30 fund score, 1.12 points better than the average for all industrial funds and a positive 2.34 fund score direction, speaking to the recent improvement of the fund and the sector. While the broader industrials sector has not reclaimed the all-time high it reached in February, PRN reached a new high on its default chart last week after giving its fifth consecutive buy signal. Also unlike the broader industrials sector, PRN has outperformed the S&P 500 year-to-date (though 8/17) as it gained 11.86% versus 4.68% for the index.

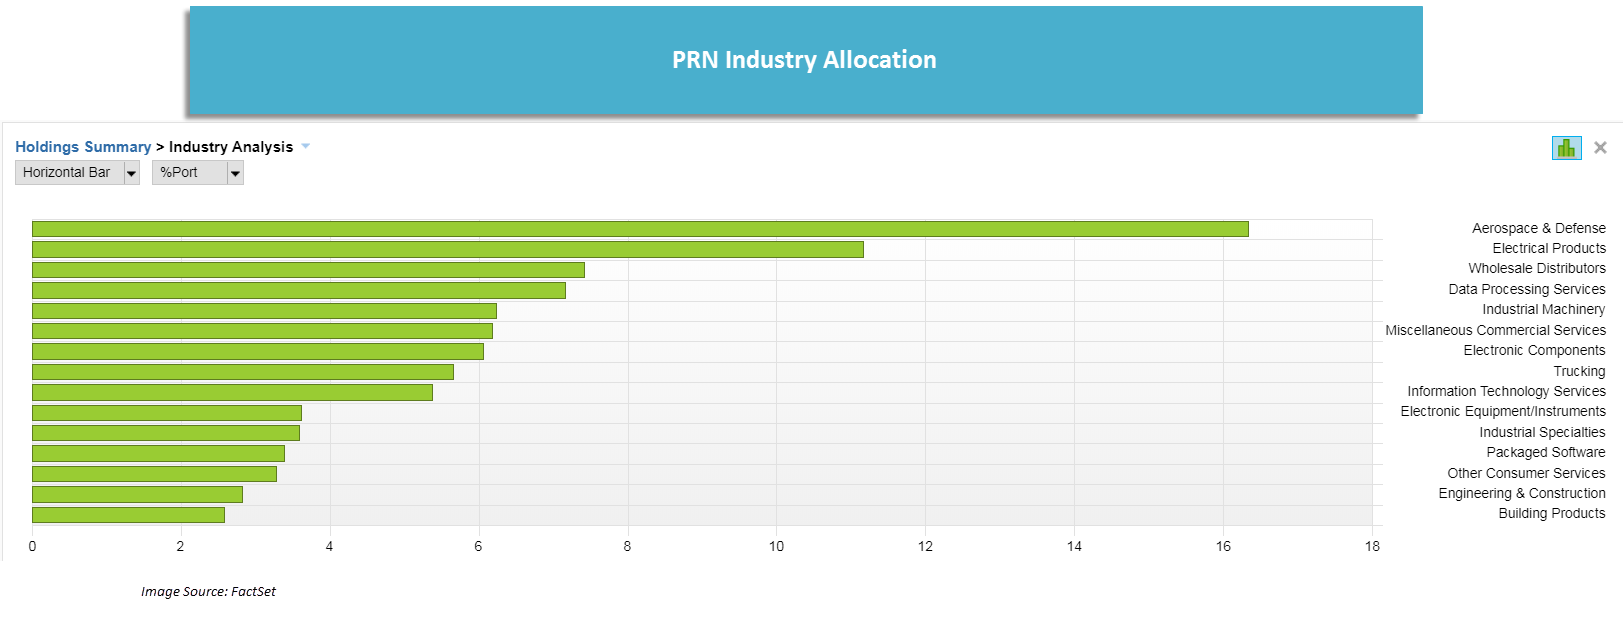
While both IYJ and PRN are industrial sector funds, the year-to-date outperformance of PRN (11.86%) vs. IYJ (0.10%) shows that the fund has clearly benefited from its momentum overlay and looking at the industry allocations of each fund we can see that there notable differences between the two portfolios. As with IYJ, PRN's largest allocation is to aerospace & defense, however, PRN's second largest allocation, at around 11% is electrical products, more than twice IYJ's allocation. PRN also has approximately a 7% allocation to wholesale distributors.