
Most Requested Symbols

Making the decision to reenter the market can be even more difficult than the decision to exit it.
While the highest-scoring groups have seen little change over the past week, we have seen a notable change in the directional ranking of the ACGS system.
Today's featured stock is Autodesk, Inc. (ADSK)
AAPL, BLDR, CPA, DFS, EFX, ENPH, LW, NCLH, NKE & PRI.
Call: Cisco Systems (CSCO), Put: Seagate Technology (STX), Covered Write: Fiserv (FISV)
Mid -Year Market Review: Join the Nasdaq Dorsey Wright team on Wednesday, July 29 at 1 pm EST as we discuss the volatile market movement through the first six months of the year and what to monitor in the second half of 2020. Click here to register.
Speakers include:

Virtual Investment Models Workshop: The Investment Models Workshop is designed specifically for financial professionals looking to incorporate Nasdaq Dorsey Wright's (NDW) turnkey model solutions into their investment practice, as well as those who would just like to learn more. This three-hour virtual course will not only give you the chance to engage with experts from NDW, but will also expose you to new strategies, investment frameworks, and best practices for utilizing the NDW Research Platform to help you manage your business with more confidence, efficiency, and greater scale. Investments & Wealth Institute® has accepted the Nasdaq Dorsey Wright Investment Models Workshop for 3 hours of CE credit towards the CIMA®, CPWA®, CIMC®, and RMA certifications. The workshop will take place on Thursday, August 6 from 12:30 pm - 3:30 pm EST. Click here for more information.
Beginners Series Webinar - Join us on Friday, July 24th, at 2 PM (ET) for our NDW Beginners Series Webinar. This week's topic is Individual Stock Idea Generation. Register here.
Market Update Webinar Replay: Missed Monday's webcast? Click the link(s) below for a recap.
For the first time in documented history, “the CBOE Volatility Index VIX is on track for its 15th weekly drop in the past 18 weeks. Before now, the closest the VIX Index had gotten was in 1992, 1994, and last year, when the gauge declined 14 out of 18 weeks” (Source: Bloomberg). As recently featured in DWA Prospecting: Fear and Volatility, the VIX measures uncertainty/volatility in the US equity market, using data from S&P 500 index options to project the expected volatility in the market as an annualized figure. So, when the VIX reached 85 in March amid the COVID19-induced sell-off, it implied an annualized volatility level of 85% and during that period we saw some of the most volatile trading days on record. Conversely, the VIX closed Wednesday around 24, matching its lowest chart level since the onset of the pandemic.
In addition to a falling VIX level we find several of our near- to intermediate-term indicators stabilizing/neutralizing as well (1/8/2020 - 7/22/2020), especially in relation to parts of the first and second quarter. Looking at the Percent Positive Trend PTNYSE and Bullish Percent for the NYSE BPNYSE, both indicators have parked just above midfield territory, telling us that just over half of the representatives are in a positive trend and/or on a Point and Figure buy signal, respectively. As for the NYSE HiLo indicator NYSEHILO, that of which measures the percentage of stocks making new 52-week highs relative to those making new 52-week highs and 52-week lows, it is in high field position yet also stable (as of now).
Those interested in tracking the VIX or any of the indicators mentioned above may consider setting alerts via the blue “Set Alert” button at the top of each chart page, seeking notification of column changes.


Something that caught our eye recently was a New York Times article entitled “Once You’re out of the Market, It’s Tricky Getting Back In.” There are some oversimplifications in the piece, like a quote that begins “Jumping out of the market is a mistake…” However, we wholeheartedly agree that “…getting back into stocks can be a more difficult decision than leaving the market in the first place.”
In March, at the height of panic selling, investors pulled $326 billion from mutual funds and ETFs. Although it ended more than decade ago, the global financial crisis was the last real bear market. As we now know, many investors who exited the market never had the stomach to reenter, much to their detriment, even if their initial decision to exit the market was the correct one.
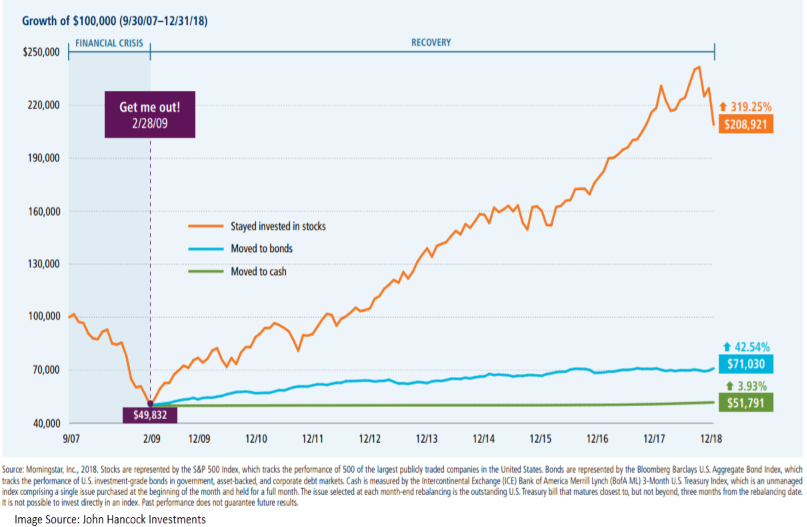
Although remaining out of the market was a mistake, and a costly one, there was plenty of cause for investors to be fearful at the time. Younger investors may or may not have an appreciation for the pervasive fear that existed from Main Street to Wall Street. There were several events surrounding the financial crisis that had never occurred and/or were believed to be “impossible” e.g., the fall of Lehman Brothers and the nationwide collapse of home prices. At the time, the notion that the global economy could collapse did not seem farfetched.
On the TODAY show on October 6, 2008, at which point the S&P 500 was already down more than 32% from its 2007 peak, Jim Cramer said “Whatever money you may need for the next five years, please take it out of the stock market right now, this week. I do not believe that you should risk those assets in the stock market right now.”
Even after the US equity market had hit what we now know was its bottom in 2009, there was still no shortage of headlines that would have given all but the most steely, disciplined investors qualms about deploying capital into the market. An April 3, 2009, New York Times headline read, “663,000 Jobs Lost in March; Total Tops 5 Million.” Chrysler filed for bankruptcy on April 30th, followed by General Motors in early June. All of this to say, that even as the recovery of the US equity market was underway, there were still plenty of reasons to be skeptical that the worst was over.
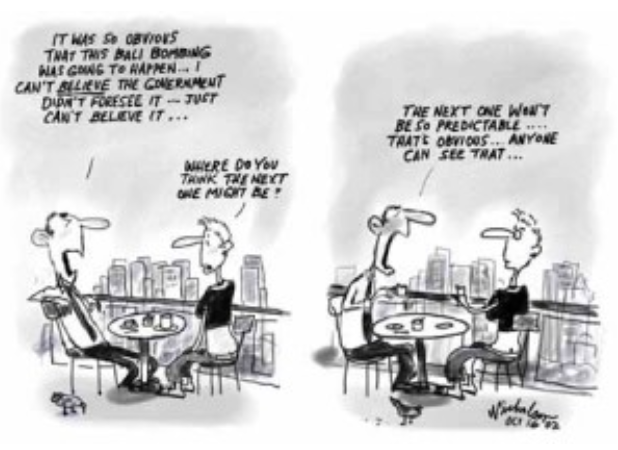
Hindsight, as the saying goes, is 20/20 and as a result we tend to believe that past was predictable and that we would have sidestepped the pitfalls that others fell victim too. However, many of us are probably feeling a bit more circumspect right now with the heightened levels of uncertainty in the market and the March sell-off still fresh in our minds. Investors who went into March without a plan for raising cash and rode the market down and back up you may be feeling like they dodged a proverbial bullet. Others who exited positions without a plan for reentering may be looking at the current market environment in which the Nasdaq 100 NDX hit a new all-time high 10 days ago while unemployment is north of 10% and feeling only fear - fear of missing out (FOMO) and fear of getting back in just before the market pulls back. If you don’t have a plan at all or if you only have a system for getting defensive but not for putting the offense back on the field, this is the perfect opportunity address that – before hindsight bias sets in.
We regularly receive calls from advisors asking which indicator(s) or system they should use to determine when to raise cash and reduce market exposure and there are several options to choose from on the NDW platform. However, having a plan for re-entering the market often receives less attention. In an environment like the one that existed in 2009 or the one we find ourselves in today, making the call to get back may be even harder than making the call to get out. Therefore, it is imperative to have a plan for both halves of the equation worked out in advance. As we have seen, over the long-term, only having a risk-off plan could be worse than having no plan at all.
So, which indicator(s) should you use? This is something that many people seem to want to make overly complicated. Fortunately, the answer is simple. You should use the indicator(s) that you understand, feel comfortable with and that you can explain to your clients to make them comfortable with the plan in place. There will be points when any indicator will tell you to raise cash too early or get back in the market a little bit too late. Although we consistently look for ways to improve the tools we offer, no market indicator is perfect, and it should raise immediate red flags if anyone says they have one. If someone had a system for perfectly identifying market tops and bottoms, why would they share it when they could earn virtually unlimited sums by keeping to themselves and trading on it?
A good indicator should be like the navigation system in your car – it provides a route to get your destination with as few detours as possible. However, you may find the first route it suggests isn’t necessarily optimal for you (or your client). If you’re a right-lane-of-the-highway, cruise-control-set-to-60 type of driver, then a route that has you zipping through city streets may not be the best route for you, even if it would get you there five minutes sooner. The point is, the best navigation system or indicator is one that gets you to your destination and does so by providing a route that you will follow. After all, you’ll arrive at your destination much later if you abandon your aggressive through-the-city route halfway through than if you had just taken the slightly longer highway path in the first place.
The top end of the Asset Class Group Scores page has remained largely similar over the past week, with equity leadership still coming from those groups that have pushed much of the market higher throughout the recent rally. This includes the technology and healthcare-related sector groups, as well as the growth-oriented size classifications that have been a continued point of focus over the past few weeks. China also continues to score well on the international front, with its group score retreating slightly over the past week, but still maintaining a relatively strong score of 4.63. The Money Market Percentile Rank also continues to remain in low field position, with a recent reading of 14.79% returning the indicator toward its previous rally-low of 14.08% in June.
While the highest-scoring groups have seen little change over the past week, we have seen a notable change in the directional ranking of the ACGS system, which can be viewed by simply clicking on the “Direction” column header to the right of the average group score. This view resorts the page by the average score direction of each group, which takes the score change from either a high or low over the past six months for each of the representatives housed in a group and provides the average directional move for the group as a whole. Sorting the page by the highest average direction displays those groups that have shown the most recent score improvement, without regard to the ranking of the group itself. In this view, we can see some variations in the ranking of domestic equity-related areas, as the basic materials group currently possesses the highest average direction of any group on the ACGS system. We can also see that while China still has the highest average direction of any international group, Latin America has shown a somewhat surprising improvement in its average score as well.

Focusing on basic materials first, we can see that the average direction of 2.80 is actually the highest score direction in the history of the group, dating to April 2011. This has aided the average score of the group to a recent posting of 3.29, marking its highest score in over two years. This group has struggled to maintain a high group score over the years, spending most of its time in low field position with a group score below 3.00. The most recent ascent came from a score low of 1.12 on March 27th, which was the lowest reading the group had seen since February of 2016. While each market environment is certainly different, the last movement higher from this washed-out territory saw the group maintain a score north of 3.00 for almost two years, making the basic materials space a sector to monitor over the next few months. Despite its strong average score direction, the sector is not as heavily overbought as other areas of the domestic equity market, printing a recent average overbought/oversold (OBOS) reading of only 67.95% overbought. For comparative purposes, we can see that the group with the second-highest score direction, precious metals, saw a recent average OBOS reading of 141.85%.

Another group that has shown surprising recent upside movement in score is Latin America, with an average direction of 2.11. Although the group still possesses a less than favorable average score of 2.26, it should be noted that the Latin America group has been no stranger to sharp score movements over its 16+ year group history. Some of these sharp score increases from very low field position have ultimately led to sustained periods of score strength, such as early-2009 through early-2011, and much of mid-2016 through early-2018. It is also important to keep in mind that the sharp movements upwards have also been followed by further score deterioration on several occasions, leading the Latin American space to be reserved for those seeking more aggressive, “bottom-fish” plays in the current market environment. We would ideally like to see further technical improvement, such as an average score reading above 3.00, before looking to gain exposure to the region. Those looking to keep monitor further score movement for the group can utilize the Alerts column to be notified of any further score improvement, or deterioration, on the ACGS page.


Average Level
45.97
| AGG | iShares US Core Bond ETF |
| USO | United States Oil Fund |
| DIA | SPDR Dow Jones Industrial Average ETF |
| DVY | iShares Dow Jones Select Dividend Index ETF |
| DX/Y | NYCE U.S.Dollar Index Spot |
| EFA | iShares MSCI EAFE ETF |
| FXE | Invesco CurrencyShares Euro Trust |
| GLD | SPDR Gold Trust |
| GSG | iShares S&P GSCI Commodity-Indexed Trust |
| HYG | iShares iBoxx $ High Yield Corporate Bond ETF |
| ICF | iShares Cohen & Steers Realty ETF |
| IEF | iShares Barclays 7-10 Yr. Tres. Bond ETF |
| LQD | iShares iBoxx $ Investment Grade Corp. Bond ETF |
| IJH | iShares S&P 400 MidCap Index Fund |
| ONEQ | Fidelity Nasdaq Composite Index Track |
| QQQ | Invesco QQQ Trust |
| RSP | Invesco S&P 500 Equal Weight ETF |
| IWM | iShares Russell 2000 Index ETF |
| SHY | iShares Barclays 1-3 Year Tres. Bond ETF |
| IJR | iShares S&P 600 SmallCap Index Fund |
| SPY | SPDR S&P 500 Index ETF Trust |
| TLT | iShares Barclays 20+ Year Treasury Bond ETF |
| GCC | WisdomTree Continuous Commodity Index Fund |
| VOOG | Vanguard S&P 500 Growth ETF |
| VOOV | Vanguard S&P 500 Value ETF |
| EEM | iShares MSCI Emerging Markets ETF |
| XLG | Invesco S&P 500 Top 50 ETF |
| Symbol | Company | Sector | Current Price | Action Price | Target | Stop | Notes |
|---|---|---|---|---|---|---|---|
| BIG | Big Lots, Inc. | Retailing | $42.41 | hi 30s - low 40s | 66 | 32 | 3 for 5'er, #3 of 82 names in favored RETA sector matrix, pullback from multi-year high, 3%, pot. covered write |
| ABC | AmerisourceBergen Corporation | Drugs | $103.81 | mid 90s to low 100s | 122 | 81 | 4 for 5'er, favored DRUG sector, big base breakout, pullback from multi-year high, 1.7% yield. Earnings 8/5 |
| PYPL | Paypal Holdings Inc | Business Products | $178.42 | high 160s - low 180s | 200 | 138 | 4 for 5'er, top 10% of favored BUSI sector matrix, multi consec buy signals, pullback from ATH, pot. cov write, Earn. 7/29 |
| MBUU | Malibu Boats Inc. | Leisure | $59.07 | low $50s to low $60s | $71 | $44 | 5 for 5'er, LT peer RS buy signal, pos mon mom, fav DWALEIS Spread Triple Top Buy Signal |
| CHGG | Chegg Inc | Business Products | $76.00 | low-to-mid 70s | 101 | 62 | 5 for 5'er, top 10% of favored BUSI sector matrix, pullback from ATH, pos wkly mom flip, pot. cov write, Earn. 8/3 |
| MNST | Monster Beverage Corp. | Food Beverages/Soap | $75.73 | 70s | 87 | 62 | 5 for 5'er, top 20% of FOOD sector matrix, bullish triangle, pos wkly mom flip, Earn. 8/5 |
| NAV | Navistar International Corporation | Autos and Parts | $31.68 | high $20s to low $30s | $42 | $25 | 4 for 5'er, top 25% of DWAAUTO, consec buy signals, |
| ZTS | Zoetis Inc. | Drugs | $145.11 | 140s - low 150s | 166 | 118 | 4 for 5'er, top half of DRUG sector matrix, multi consec buys, pos wkly mom flip Earnings expected 8/6 |
| ADSK | Autodesk, Inc. | Software | $240.74 | $230s to low $260s | $292 | $192 | 5 for 5'er, consec buy signals, pullback from AT high, top 1/3rd of DWASOFT, pos mon mom, LT market RS buy |
| Symbol | Company | Sector | Current Price | Action Price | Target | Stop | Notes |
|---|---|---|---|---|---|---|---|
| TAP | Molson Coors Company | Food Beverages/Soap | $35.80 | mid 30s | $22 | $41 | 0 for 5'er, consec sell signals, spread triple bottom, LT market RS sell signal, bottom of DWAFOOD Earnings 7/30 |
| Symbol | Company | Sector | Current Price | Action Price | Target | Stop | Notes |
|---|---|---|---|---|---|---|---|
| SIMO | Silicon Motion Technology Corporation (Taiwan) ADR | Semiconductors | $42.89 | upper 40s - lower 50s | 75 | 40 | See follow comment below. |
| Comment |
|---|
| SIMO Silicon Motion Technology Corporation (Taiwan) ADR R ($42.29) - Semiconductors - SIMO is now a 2 for 5'er. No new positions here. We will abide by our $40 stop. Note earnings are expected on 7/29. |
ADSK Autodesk, Inc. R ($237.61) - Software - ADSK is a perfect 5 for 5’er that ranks in the top third of the favored software sector RS matrix. This stock is trading well above its bullish support line and is showing long-term strength versus the market, evidenced by a market RS buy signal that has been in place since December 2015. Also, ADSK has given four consecutive buy signals since May, with the last occurring at $248, the stock’s all-time high. After reaching the $248 level in early July, ADSK pulled back slightly to support at $228; however, the stock has since reversed back up into Xs to the $244 level. Furthermore, monthly momentum has been positive for three months, adding to the positive technical picture. Okay to initiate new long exposure in the $230s to lower $260s. We will set our initial stop at $192, which would violate multiple levels of support on ADKS’s default chart. A modified bullish price objective of $292 will act as our near-term price target.
| 20 | |||||||||||||||||||||||||||||||||||||||||||||||||||||
| 248.00 | X | 248.00 | |||||||||||||||||||||||||||||||||||||||||||||||||||
| 244.00 | X | X | O | X | 244.00 | ||||||||||||||||||||||||||||||||||||||||||||||||
| 240.00 | X | X | O | 7 | O | X | 240.00 | ||||||||||||||||||||||||||||||||||||||||||||||
| 236.00 | X | O | X | O | X | O | X | 236.00 | |||||||||||||||||||||||||||||||||||||||||||||
| 232.00 | X | O | X | O | X | O | X | 232.00 | |||||||||||||||||||||||||||||||||||||||||||||
| 228.00 | X | O | X | O | O | 228.00 | |||||||||||||||||||||||||||||||||||||||||||||||
| 224.00 | X | O | X | 224.00 | |||||||||||||||||||||||||||||||||||||||||||||||||
| 220.00 | X | O | Mid | 220.00 | |||||||||||||||||||||||||||||||||||||||||||||||||
| 216.00 | X | 216.00 | |||||||||||||||||||||||||||||||||||||||||||||||||||
| 212.00 | • | 6 | 212.00 | ||||||||||||||||||||||||||||||||||||||||||||||||||
| 208.00 | X | • | X | 208.00 | |||||||||||||||||||||||||||||||||||||||||||||||||
| 204.00 | X | O | • | X | 204.00 | ||||||||||||||||||||||||||||||||||||||||||||||||
| 200.00 | X | X | 2 | O | • | X | X | 200.00 | |||||||||||||||||||||||||||||||||||||||||||||
| 198.00 | X | O | X | O | X | O | • | X | O | X | 198.00 | ||||||||||||||||||||||||||||||||||||||||||
| 196.00 | X | O | X | O | X | O | • | X | O | X | 196.00 | ||||||||||||||||||||||||||||||||||||||||||
| 194.00 | X | O | O | O | X | • | X | O | 194.00 | ||||||||||||||||||||||||||||||||||||||||||||
| 192.00 | X | O | X | O | X | • | X | 192.00 | |||||||||||||||||||||||||||||||||||||||||||||
| 190.00 | X | O | X | O | X | X | O | • | X | 190.00 | |||||||||||||||||||||||||||||||||||||||||||
| 188.00 | X | O | X | O | X | O | X | O | • | X | X | 188.00 | |||||||||||||||||||||||||||||||||||||||||
| 186.00 | 1 | O | O | X | O | X | O | • | X | X | O | X | X | 186.00 | |||||||||||||||||||||||||||||||||||||||
| 184.00 | X | O | X | O | X | O | • | X | O | X | O | X | O | X | 184.00 | ||||||||||||||||||||||||||||||||||||||
| 182.00 | X | O | 3 | O | X | O | • | X | X | O | X | 5 | X | O | X | 182.00 | |||||||||||||||||||||||||||||||||||||
| 180.00 | X | X | O | X | O | X | O | • | X | O | X | O | X | O | X | O | X | 180.00 | |||||||||||||||||||||||||||||||||||
| 178.00 | X | O | X | O | X | O | O | • | X | O | X | O | O | X | O | X | 178.00 | ||||||||||||||||||||||||||||||||||||
| 176.00 | X | O | X | O | O | • | X | O | X | O | X | O | X | • | 176.00 | ||||||||||||||||||||||||||||||||||||||
| 174.00 | X | C | X | O | • | X | X | O | X | O | O | X | • | Bot | 174.00 | ||||||||||||||||||||||||||||||||||||||
| 172.00 | X | O | O | • | X | O | X | O | X | O | • | 172.00 | |||||||||||||||||||||||||||||||||||||||||
| 170.00 | X | O | • | X | X | O | X | O | X | • | 170.00 | ||||||||||||||||||||||||||||||||||||||||||
| 168.00 | X | O | • | X | O | X | O | O | • | 168.00 | |||||||||||||||||||||||||||||||||||||||||||
| 166.00 | X | O | X | X | O | X | • | 166.00 | |||||||||||||||||||||||||||||||||||||||||||||
| 164.00 | • | X | O | X | O | X | O | X | • | 164.00 | |||||||||||||||||||||||||||||||||||||||||||
| 162.00 | • | X | • | O | X | O | X | X | O | X | • | 162.00 | |||||||||||||||||||||||||||||||||||||||||
| 160.00 | • | X | • | O | X | O | X | O | X | O | X | • | 160.00 | ||||||||||||||||||||||||||||||||||||||||
| 158.00 | X | • | X | • | O | O | X | X | O | X | X | O | • | 158.00 | |||||||||||||||||||||||||||||||||||||||
| 156.00 | X | O | X | • | O | X | O | X | X | X | O | X | O | X | • | 156.00 | |||||||||||||||||||||||||||||||||||||
| 154.00 | X | O | X | • | O | X | O | X | O | X | O | X | O | X | O | X | • | 154.00 | |||||||||||||||||||||||||||||||||||
| 152.00 | X | O | X | X | • | O | X | O | X | O | X | O | X | O | X | 4 | X | • | 152.00 | ||||||||||||||||||||||||||||||||||
| 150.00 | X | O | X | O | B | • | O | X | O | X | O | X | O | X | O | X | O | X | • | 150.00 | |||||||||||||||||||||||||||||||||
| 148.00 | X | O | X | O | X | • | O | X | O | X | O | X | O | X | O | X | O | X | • | 148.00 | |||||||||||||||||||||||||||||||||
| 146.00 | 9 | O | X | O | X | • | O | X | O | X | O | X | O | X | O | X | O | X | • | 146.00 | |||||||||||||||||||||||||||||||||
| 144.00 | X | O | X | O | X | • | O | X | O | X | O | X | O | X | O | X | O | X | • | 144.00 | |||||||||||||||||||||||||||||||||
| 142.00 | X | A | O | X | • | O | X | O | X | O | X | O | X | O | O | X | • | 142.00 | |||||||||||||||||||||||||||||||||||
| 140.00 | X | O | • | O | X | O | X | O | X | O | O | X | • | 140.00 | |||||||||||||||||||||||||||||||||||||||
| 138.00 | X | • | O | X | O | X | O | X | O | X | • | 138.00 | |||||||||||||||||||||||||||||||||||||||||
| 136.00 | X | • | O | O | O | X | O | • | 136.00 | ||||||||||||||||||||||||||||||||||||||||||||
| 134.00 | X | • | O | X | • | • | 134.00 | ||||||||||||||||||||||||||||||||||||||||||||||
| 132.00 | X | • | O | X | • | 132.00 | |||||||||||||||||||||||||||||||||||||||||||||||
| 130.00 | • | O | X | • | 130.00 | ||||||||||||||||||||||||||||||||||||||||||||||||
| 128.00 | O | X | • | 128.00 | |||||||||||||||||||||||||||||||||||||||||||||||||
| 126.00 | O | • | 126.00 | ||||||||||||||||||||||||||||||||||||||||||||||||||
| 20 |

| AAPL Apple Inc. ($372.65) - Computers - AAPL reversed down into a column of Os Thursday and broke a double bottom at $380, before moving past further support to $372 intraday. This is the stock's first sell signal after six consecutive buy signals, which also led the mega-cap technology name into heavily overbought territory prior to today's move. The long-term technical picture for AAPL remains intact, as the stock possesses 5 out of the 5 possible technical attributes and ranks in the top half of the favored computers sector RS matrix. Further support may be found at $352 with additional support offered at $336. AAPL would return to a buy signal from current levels with a quadruple top breakout at $400. Note that earnings are expected on 7/30. |
| BLDR Builders FirstSource, Inc. ($23.15) - Building - BLDR returned to a buy signal with a double top breakout at $24. This stock is a perfect 5 for 5'er that moved back into a positive trend in late-April. Also, BLDR has maintained a long-term peer RS buy signal since August 2017. Demand is in control and the technical picture is strong. Initial support sits at $19.50 while BLDR faces overhead resistance at $28, the stock's all-time high from February 19, 2020. Note earnings are expected on 7/30. |
| CPA Copa Holdings SA ($46.75) - Aerospace Airline - Shares of CPA fell lower Thursday to break a spread triple bottom at $45. This 1 for 5'er moved to a negative trend in February and ranks in the bottom half of the aerospace airline sector RS matrix. Weekly momentum also recently flipped negative, suggesting the potential for further downside from here. Long exposure should be avoided, while short-seekers should note that CPA carries a 6.81% yield and has further support found at $44. Initial overhead resistance may be found at $50. Also, note that earnings are expected on 8/5. |
| DFS Discover Financial Services ($51.55) - Finance - DFS moved higher following their earnings release Thursday to break a triple top at $52. This 4 for 5'er moved to a positive trend in early-June and ranks in the top third of the favored finance sector RS matrix. The overall weight of the evidence continues to improve here. Exposure may be considered at current levels, with initial support offered at $48. Further support can be found at $46, which is also the current location of the bullish support line. Note that DFS also carries a 3.47% yield. |
| EFX Equifax Inc. ($177.24) - Business Products - EFX continued higher after their earnings call Thursday to break a double top at $176 before continuing higher intraday to match its all-time high at $180. This 3 for 5'er moved to a positive trend in April and ranks in the top quartile of the favored business products sector RS matrix. The stock has also maintained an RS buy signal against the market since early-2015. The weight of the evidence is positive and improving. Initial support can be found at $162. |
| ENPH Enphase Energy Inc ($61.62) - Electronics - ENPH broke a double top at $65 on Thursday, marking the stock's third consecutive buy signal this month. This stock is a perfect 5 for 5'er that ranks within the top third of the favored electronics sector RS matrix. Weekly momentum has been positive for two weeks, suggesting the potential for higher prices. From here, initial support sits at $60 while ENPH faces resistance at the $70 level, the all-time high on the chart printed in May of this year. Note earnings are expected on 8/4. |
| LW Lamb Weston Holdings Inc ($68.66) - Food Beverages/Soap - LW continued higher Thursday to break a double top at $69. This 3 for 5'er moved to a positive trend last month and ranks in the top third of the food beverages/soap sector RS matrix. The stock also carries a bullish price objective of $87 and a favorable reward-to-risk ratio. The overall technical picture continues to strengthen. Initial support can be found at $65 with further support offered at the bullish support line, which can be found at $61. Note earnings are expected on 7/28. |
| NCLH Norwegian Cruise Line Holdings Ltd. ($14.41) - Leisure - NCLH continued lower Thursday to break a triple bottom at $14.50 before falling past further support intraday to $14. This 2 for 5'er moved to a negative trend in February and ranks 47th out of 48 names in the leisure sector RS matrix. Weekly momentum also recently flipped negative, suggesting the potential for further price depreciation. Avoid long exposure. Further support can be found at $9.50, while initial overhead resistance may come at $18.50. Note that earnings are expected on 8/6. |
| NKE NIKE, Inc. ($98.16) - Textiles/Apparel - NKE returned to a buy signal today with a double top breakout at $100. This stock is a strong 4 for 5'er within the favored textiles/apparel sector that just experienced a flip to positive monthly momentum, suggesting the potential for higher prices. Additionally, NKE continues to show long-term strength versus the broader market, evidenced by its market RS buy signal that has been in place since December 2000. From here, initial support sits at $96, while the stock is facing overhead resistance here at the $100 level. |
| PRI Primerica Inc. ($120.80) - Insurance - PRI broke a double top at $122, marking the stock's second consecutive buy signal since May. PRI is a perfect 5 for 5'er as all of its trending and relative strength characteristics are positive here that currently ranks 10th out of 67 names in the insurance sector RS matrix. Additionally, PRI has maintained a long-term market RS buy signal since July 2013, confirming its strength versus the broader market. Monthly momentum just flipped positive, suggesting the potential for higher prices. From here, support sits at $110 while PRI faces overhead resistance at $130. Note earnings are expected on 8/5 and PRI provides a yield of 1.33%. |
| Name | Option Symbol | Action | Stop Loss |
|---|---|---|---|
| Cisco Systems, Inc. - $47.41 | CSCO2016J45 | Buy the October 45.00 calls at 4.10 | 43.00 |
| Name | Option | Action |
|---|---|---|
| Lowe's Companies, Inc. ( LOW) | Oct. 130.00 Calls | Stopped at 19.60 (CP: 18.75) |
| Best Buy Co., Inc. ( BBY) | Oct. 85.00 Calls | Raise the option stop loss to 11.95 (CP: 13.95) |
| Name | Option Symbol | Action | Stop Loss |
|---|---|---|---|
| Seagate Technology - $50.00 | STX2016V55 | Buy the October 55.00 puts at 7.35 | 56.00 |
| Name | Option | Action |
|---|---|---|
| Walgreens Boots Alliance Inc. (WBA) | Jul. 45.00 Puts | Stopped at 0.00 (CP: 3.40) |
| Micron Technology, Inc. (MU) | Oct. 50.00 Puts | Stopped at 53.00 (CP: 52.63) |
| Name | Option Sym. | Call to Sell | Call Price | Investment for 500 Shares | Annual Called Rtn. | Annual Static Rtn. | Downside Protection |
|---|---|---|---|---|---|---|---|
| Fiserv, Inc. $102.44 | FISV2020K105 | Nov. 105.00 | 6.20 | $48,536.95 | 21.63% | 16.03% | 5.01% |
| Name | Action |
|---|---|
| Bank of America (BAC) - 24.31 | Sell the November 25.00 Calls. |
| Applied Materials, Inc. (AMAT) - 64.22 | Sell the October 65.00 Calls. |
| Chegg Inc (CHGG) - 76.00 | Sell the October 75.00 Calls. |
| Big Lots, Inc. (BIG) - 42.41 | Sell the October 42.50 Calls. |
| Wendy's Company (WEN) - 23.35 | Sell the October 23.00 Calls. |
| Fifth Third Bancorp (FITB) - 19.42 | Sell the November 19.00 Calls. |
| Chegg Inc (CHGG) - 76.00 | Sell the October 75.00 Calls. |
| Wendy's Company (WEN) - 23.35 | Sell the November 23.00 Calls. |
| L Brands Inc. (LB) - 19.41 | Sell the November 20.00 Calls. |
| JD.COM INC (JD) - 61.84 | Sell the October 65.00 Calls. |
| Name | Covered Write |
|---|---|
|
|
|
Daily Equity & Market Analysis
Loading, Please Wait...
