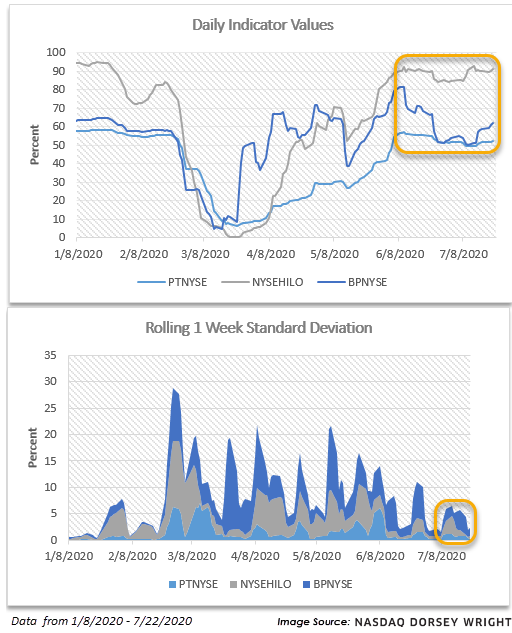
Despite market action today and underlying sentiment, volatility has actually been on the decline
Mid -Year Market Review: Join the Nasdaq Dorsey Wright team on Wednesday, July 29 at 1 pm EST as we discuss the volatile market movement through the first six months of the year and what to monitor in the second half of 2020. Click here to register.
Speakers include:
- Jay Gragnani, Head of Research and Client Engagement
- John Lewis, CMT, Senior Portfolio Manager
- Jamie West, CFA, Senior Analyst
- Chuck Fuller, Senior Vice President, Applied Research
Virtual Investment Models Workshop: The Investment Models Workshop is designed specifically for financial professionals looking to incorporate Nasdaq Dorsey Wright's (NDW) turnkey model solutions into their investment practice, as well as those who would just like to learn more. This three-hour virtual course will not only give you the chance to engage with experts from NDW, but will also expose you to new strategies, investment frameworks, and best practices for utilizing the NDW Research Platform to help you manage your business with more confidence, efficiency, and greater scale. Investments & Wealth Institute® has accepted the Nasdaq Dorsey Wright Investment Models Workshop for 3 hours of CE credit towards the CIMA®, CPWA®, CIMC®, and RMA certifications. The workshop will take place on Thursday, August 6 from 12:30 pm - 3:30 pm EST. Click here for more information.
Beginners Series Webinar - Join us on Friday, July 24th, at 2 PM (ET) for our NDW Beginners Series Webinar. This week's topic is Individual Stock Idea Generation. Register here.
Market Update Webinar Replay: Missed Monday's webcast? Click the link(s) below for a recap.
For the first time in documented history, “the CBOE Volatility Index VIX is on track for its 15th weekly drop in the past 18 weeks. Before now, the closest the VIX Index had gotten was in 1992, 1994, and last year, when the gauge declined 14 out of 18 weeks” (Source: Bloomberg). As recently featured in DWA Prospecting: Fear and Volatility, the VIX measures uncertainty/volatility in the US equity market, using data from S&P 500 index options to project the expected volatility in the market as an annualized figure. So, when the VIX reached 85 in March amid the COVID19-induced sell-off, it implied an annualized volatility level of 85% and during that period we saw some of the most volatile trading days on record. Conversely, the VIX closed Wednesday around 24, matching its lowest chart level since the onset of the pandemic.
In addition to a falling VIX level we find several of our near- to intermediate-term indicators stabilizing/neutralizing as well (1/8/2020 - 7/22/2020), especially in relation to parts of the first and second quarter. Looking at the Percent Positive Trend PTNYSE and Bullish Percent for the NYSE BPNYSE, both indicators have parked just above midfield territory, telling us that just over half of the representatives are in a positive trend and/or on a Point and Figure buy signal, respectively. As for the NYSE HiLo indicator NYSEHILO, that of which measures the percentage of stocks making new 52-week highs relative to those making new 52-week highs and 52-week lows, it is in high field position yet also stable (as of now).
Those interested in tracking the VIX or any of the indicators mentioned above may consider setting alerts via the blue “Set Alert” button at the top of each chart page, seeking notification of column changes.


