
A guide to risk management via guided models and ETFs that offer the ability to systematically raise cash when needed.
Although the CBOE SPX Volatility Index VIX remains well below its long-term average of 18.34 (source: CBOE), recent market volatility has provided an opportune backdrop for advisors who tactically manage risk to tell their story. While we have not seen enough of a change to the landscape to merit significant shifts in a tactical allocation, having the ability to do so remains a point of differentiation for many of you. To that end, those of you using one of our strategies (whether a model or an ETF) that has the ability to raise cash can use this time to remind clients or prospects that you follow a rules-based, systematic approach, that can help manage downside risk. Such a conversation can help you accomplish two important tasks. First, you can explain that despite the increased volatility this year, we have yet to see enough of a change to merit a truly defensive stance against equity exposure. Second, you can reassure them that you have a proactive plan in place that will adapt when necessary.
Today we will highlight four strategies that are accessible both as guided models and through ETF products that have the ability to raise cash on the Nasdaq Dorsey Wright platform, as well as two additional single CUSIP solutions. It is important to keep in mind that the main objective of each of these strategies is to provide a path to being invested versus reacting to the first sign of market turbulence. They are designed to respond to material changes in risk, helping take the psychological process out of the equation so you don’t have to think twice about hitting the sell button. That being said, nothing is perfect nor works all the time; but in the grand scheme, these types of strategies help us ride out corrections with relative frequency and limit losses in bear markets.
Tactical Cash Strategies
Below we have put together some bullet points outlining how each strategy works. You’ll notice there are some Nasdaq Dorsey Wright driven strategies that offer both a guided ETF model approach as well as an ETF that tracks the same index. For more information, please find the linked fact sheet/info file for each model and/or fund.
Pacer Trendpilot 100 ETF PTNQ
- Rules-based ETF with the ability to go 100% cash based on three objective indicators
- Equity Indicator: when the Nasdaq-100 Total Return index closes above its 200-day moving average for five consecutive business days, the fund will have 100% exposure to the Nasdaq-100 index
- 50/50 Indicator: when the Nasdaq-100 Total Return index closes below its 200-day moving average for five consecutive business days, the fund will have 50% exposure to the Nasdaq-100 index and 50% exposure to 3-Month T-Bills
- T-Bill Indicator: When the Nasdaq-100 Total Return index's 200-day moving average closes lower than its value from five business days prior, the fund will have 100% exposure to 3-month T-Bills
- Evaluated daily
- Pacer also offers the Large Cap (PTLC) and Mid Cap (PTMC) equivalents
- PTNQ Fact Sheet

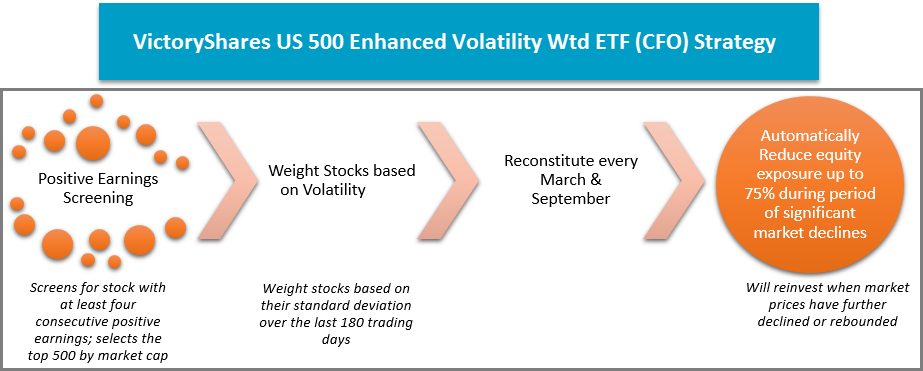
VictoryShares US 500 Enhanced Volatility Wtd ETF CFO
- Volatility weighted, rules-based ETF with the ability to go 75% cash
- Uses an exit/reinvestment strategy based on the All-Time Highest Daily Closing Value relative to the index's month-end value
- Automatically reduces its exposure to the equity markets during periods of significant market declines and reinvests when market prices have further declined or rebounded
- If the index has declined -10% or more, the fund will liquidate 75% of its equity exposure at the end of the month
- When the fund is less than 100% equities, the remaining will be in 30-day T-Bills
- Evaluated monthly
- CFO Fact Sheet
DWA Sector 4 Model POWER4
- Uses a tally matrix based upon nine broad sectors and cash
- Evaluated monthly
- Owns the top four sectors at any given time
- Cash comes into the model in 25% increments based on its respective ranking versus the other broad sectors, up to 100%.
- The Invesco DWA Tactical Sector Rotation Portfolio DWTR is an ETF that seeks to track the same underlying index
- POWER4 Model Info File
- DWTR Fact Sheet

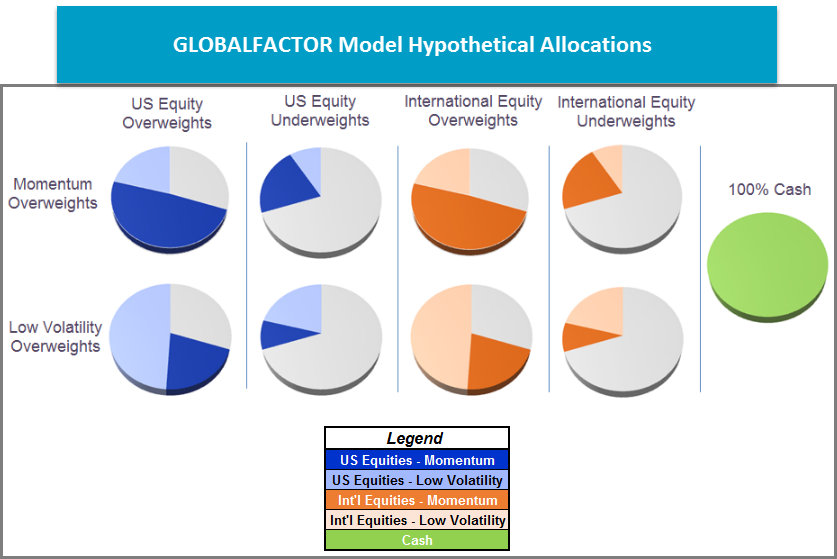
Invesco Global Factor Model GLOBALFACTOR
- Uses DALI rankings for US equities, international equities, and cash to determine which asset classes to allocate towards
- Evaluated monthly
- Overweights asset classes in a 70/30 fashion based on whichever is ranked higher
- Overweights the momentum factor and underweights low volatility if the asset class is within the top two ranks and vice versa
- Cash can be either 30% or 100% of the portfolio based upon its ranking in DALI
- GLOBALFACTOR Model Info File
DWA People’s Portfolio PEOPLESPORT
- Compares the Nasdaq US 500 Large Cap and Equal Weighted Indices versus one another on a relative strength basis and bases its decision on the current column - X's favors large-cap, O’s favors equal weight
- The winner of this relationship is then compared against our money market proxy (MNYMKT) on a relative strength basis but is based upon the signal rather than the column - buy signal favors the index, sell signal favors cash
- Evaluated daily
- Cash can be up to 100% of the portfolio
- The First Trust Dorsey Wright People’s Portfolio ETF DWPP is an ETF that seeks to track the same underlying index
- PEOPLESPORT Model Info File
- DWPP Fact Sheet

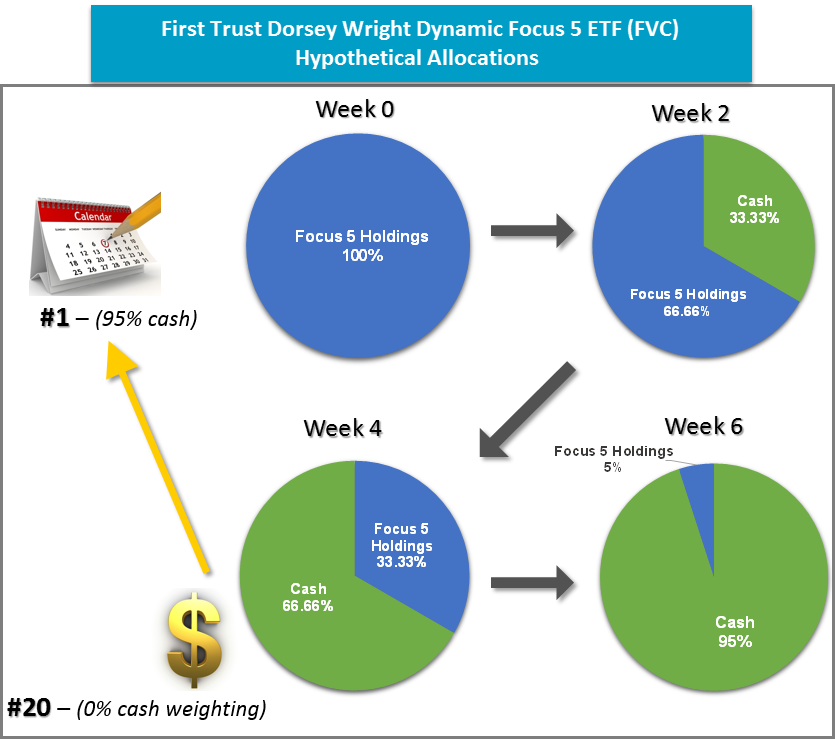
First Trust Dorsey Wright Dynamic Focus 5 ETF FVC
- Similar to the Focus 5 Model FTRUST5 on the Nasdaq Dorsey Wright platform but with the ability to raise cash
- Evaluated bi-monthly
- Uses a relative strength matrix to compare the 19 sector funds in the universe and a cash proxy (MNYMKT)
- Will own the top five ranked ETFs within the inventory until they fall sufficiently out of favor versus the other members of the model universe
- Cash comes into play when the cash proxy moves into the top two-thirds of the matrix. The fund will then invest in US T-Bills proportionate to the cash proxy ranking (example: MNYMKT ranks 10 out of 20 in the matrix = FVC would target 50% weighting in cash, other 50% in the 5 sectors)
- Cash movement cannot exceed 33% (up or down) in any evaluation and has the potential to reach 95% of the entire portfolio allocation
- FVC Fact Sheet
For your reference, below we have compared both the Guided Model and ETF approach so you may determine which solution is the best fit for you and your clients. The Guided Model approach does provide an opportunity for a touch point with clients upon changes, and generally speaking, individual ETFs do offer lower expense ratios on average than the ETFs that seek to track the models. However, those running the model do create taxable events upon a change and ticket charges could apply. On the other hand, someone using one of the ETFs isn’t always made aware of the change because the trades will occur within the ETF. By doing this, the ETFs offer tax efficiencies that the model itself does not afford. Both approaches have their benefits and often we find that it depends on what each individual advisor wants. In any case, the sector rotation and adaptation the strategy delivers will be provided. Typically we see advisors take advantage of the model approach when working in a non-taxable account while the ETF route tends to be used more often in a taxable account.

Regardless of how you wish to approach these strategies, we hope this piece has equipped you with an understanding of how these strategies work and what they can potentially look like during different market environments. These strategies allow both money to be invested in strong trends and come with an embedded process to manage the fear of a correction. If your clients understand the process, you both may be able to endure choppy market cycles without running into as many potholes or unsettling scenarios where the sell button begins to look friendly. Disciplined investing is not always easy, but it offers clients clarity and peace of mind about what is happening with their money and the opportunity for advisors to offer rules-based risk management within portfolios. The key here is to manage the emotions resulting from a sharp sell-off along with the reality that the weight of technical evidence (via the indicators) supports putting money to work at this time. If you need assistance understanding these models more in-depth or have a question about a certain methodology, please do not hesitate to give our office a call at (804)-320-8511.
