
Most Requested Symbols

With summer right around the corner, it's time for "Summertime Blues." Today we take a look at how the summer months perform relative to other seasons historically. Unfortunately, the summer months tend to provide lackluster performance providing further evidence of, "Sell in May and go away."
The Us Equity Core Percentile Rank moves higher while the Money Market Percentile Rank continues lower.
Today's featured stock is Lamar Advertising Company (LAMR)
AAP, ANSS, AMT, CDAY, ABC, BL, EQIX, HD, TYL, & ZEN
Call: ConocoPhillips (COP), Put: Newell Brands (NWL), Covered Write: The Walt Disney Company (DIS)
Replay for FSM Models Webinar: We have a replay available for our latest webinar on Applying the Fund Score Method through FSM Models, which took place on Thursday, May 21st. This webinar featured an overview of the various FSM strategies and offered potential implementation ideas. Click here to view the replay.
Market Webinar Replay: We also have a video replay and slides available from our lastest Market Update Webinar from Tuesday, May 26th:
Beginners Series Webinar - Join us on Friday, May 29th at 2 PM (ET) for our NDW Beginners Series Webinar. This week's topic is Individual Stock Idea Generation. Register here.
Since broad domestic equity indices posted a bottom on March 23rd, they have not looked back. In fact, the S&P 500 SPX, Nasdaq Composite NASD, and Dow Jones Industrial Average DJIA have each rebounded with price returns in excess of 30% (data beginning 3/23/20 through 5/27/20). As a result of this upward movement a number of indicators on the Nasdaq Dorsey Wright research platform have turned positive, yet perhaps none more so than the ten-week for the S&P 500 TWSPX. As a refresher, TWSPX measures the percentage of stocks in the S&P 500 that are currently trading above their 10-week (50 day) moving average. With an intraday calculation of 95.64% on Thursday (5/28) TWSPX posted its highest reading ever, signifying that over 95% of securities in the S&P 500 are trading above their 10-week moving average. While this may sound ominous to some, the data suggests otherwise as we note generally positive returns following TWSPX movements above the 90% threshold, with almost all observations rolling positive within nine months.
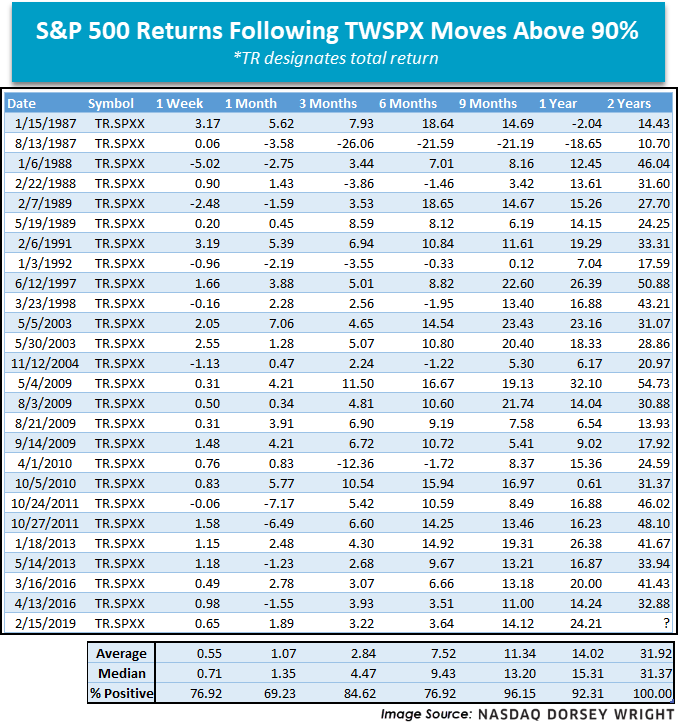
In a similar vein, when first highlighted several weeks ago as a developing story, SPX managed to get 10% above its 50-day moving average yesterday (5/27). This event is also rare, only occurring six times since 1955 (April 2009, November 1998, February 1991, September 1982, January 1975, and July 1955). Respective performance for the S&P 500 (as perhaps anticipated at this point) is also positive, with all returns in the black six months out.

While the events surrounding TWSPX and the 50-day moving average for the S&P 500 are certainly promising, they are not a silver bullet nor a guarantee of the past repeating itself. It is also worth noticing that events like these are infrequent, resulting in a small sample size to build from. However, the findings here do evidence that demand continues to reenter the equity markets, positively contributing to the weight of the evidence.

Although summer doesn’t officially begin for three more weeks, many Americans recognize Memorial Day as the unofficial start of the season. While this summer is likely to be far from normal, we typically associate the season with warm weather, beach vacations, and longer days; however, in the investment world, the summer months are associated with lackluster returns, also known as the "Summertime Blues." This year, we enter the summer months coming off one of the most volatile starts to a year ever. However, the major indices have rebounded strongly off their March bottoms with the S&P 500 SPX and DOW DJIA now down -6.03% and -10.48% for the year, respectively (through 5/27). Meanwhile, the Nasdaq NASD is actually in positive territory for the year with a return of 4.9%. While the Bullish Percent for the NYSE BPNYSE currently sits in Xs, domestic equities currently rank third in the DALI asset class rankings as we head into the historically sluggish summer months. Of course, there is no way to know how the next three months will unfold, especially given the uncertainty around COVID-19 and the reopening of maxim of the Summertime Blues came to be.
The table below shows the returns of both the Dow Jones Industrial Average and the S&P 500 during the summer months (May 31st to August 31st) back to 1981. The S&P 500 and the Dow Jones Industrial Average have each finished in negative territory in 15 of the past 39 summers (or about 38.5% of the time). Of those 15 down summers, there were 13 summers in which SPX and DJIA were both down at the same time. While less than half of the summers have been negative for these benchmarks, the bad summers were indeed bad, with some down double digits over the three-month period. For instance, in the summer of 1990, the SPX fell -10.69%. In 1998, it saw a drop of -12.24%; but the worst summer came in 2002 during the tech crash when the index declined -14.16%. During the summer of 2008, which began a famously longer slide, SPX fell -8.39%. The market has bucked the trend recently, however, as both indices have posted gains during the most recent four summers.

In an effort to determine if there is one month that tends to have an outsized effect on summer returns as a whole, we compiled a monthly summary of S&P 500 returns going back to 1958. What we found is that the summer months tend to have a lower median return than most of the other months of the year. It is actually the month of September that has historically provided the lowest median return at -0.30%, but it is followed closely by June which has a median return of just 0.05%. Notice too that the spread, i.e. the max return in a given month versus the minimum return in a given month, is relatively low for the summer months (namely June and July). A closer look at the month of June reveals a max return of 6.89% in the last 60 years, which it posted last year, and also followed a May return of -6.58%. Every other month, except February, had a maximum return in excess of 8%. Clearly, June has historically been one of the weaker months for SPX returns. However, we can't blame the Summertime Blues on June alone. August has experienced the second-largest drawdown (after October) at -14.56%, which compares unfavorably to the other months' minimums which seem to hover around -10%. The data below indicates that the Summertime Blues cannot be traced back to just one month.

To take this concept one step further, we looked at four hypothetical portfolios specific to each of the four seasons. Defined as follows:
Winter Portfolio Dates: 11/30 - 2/28
Spring Portfolio Dates: 2/28 - 5/31
Summer Portfolio Dates: 5/31 - 8/31
Fall Portfolio Dates: 8/31 – 11/30
The end result? The summer portfolio greatly underperformed the other three seasons - fall, winter, and spring. If you were to invest only during the spring months (March through May), the initial investment would have had a cumulative return of 375% from 1958 through 2019, with an average annualized return of 10.58%, making it the best performing seasonal portfolio. The summer months pale in comparison to the others, gaining a measly 46% since 1958 years! That results in an average annualized rate of return of only 2.47%.

Hong Kong came to the center stage of world news late last year due to protests against mainland China after a controversial law was passed. Hong Kong residents viewed the legislation as infringing on their rights based on the agreement of “one country two systems” after Hong Kong was handed back to China in 1997 from Great Britain. US and China tensions are beginning to boil over again with the latest development of China passing a plan to increase its security presence in Hong Kong. The US has signaled that it was likely to end some or all of the US government’s special trade and economic relations with Hong Kong due to China’s actions. The state department no longer considers Hong Kong to have significant autonomy. The current special status allows the US dollar can be freely exchanged with the Hong Kong dollar, Hong Kong gets preferential treatment with regards to trade, and the US and Hong Kong have a visa-free travel policy. If this were to change, Hong Kong would be treated like any other Chinese city and American businesses may choose to leave due to higher costs and restricted travel. Also, Hong Kong would be subject to the same export controls over sensitive technology. The further deterioration of the US and China relationship could have serious implications on US markets as many large US companies rely heavily on China for revenue.
According to FactSet, the average company tracked in the S&P 500 has 4.19% of its revenue derived from China, and the companies tracked in the Invesco QQQ Trust QQQ have an average of 11.02% revenues derived from China. Some popular names that rely on China for revenue include Apple Inc. (AAPL) with 15.70% of its revenue from China, Starbucks (SBUX) with 14.39%, and Chevron with 26.38% amongst many others.

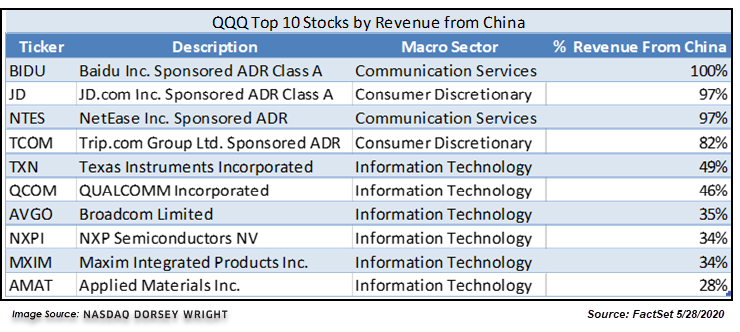
In terms of sectors, some are more reliant than others on China for revenue. As seen in the tables below, some of these sectors attribute a significant portion of revenues to China.

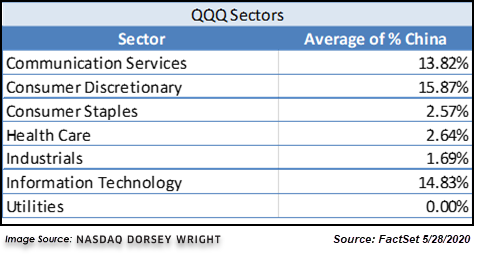
If tensions between the US and China continue to escalate, these high revenue exposure sectors like Information Technology, Communication Services, and Consumer Discretionary could be negatively affected. Some of the larger names that have China exposure could face a damaging impact and pull these cap-weighted indices with them. The averages were given equal weights, so large names like Microsoft and Apple that derive a significant portion of revenue from China could have an even larger negative effect on the major indices than the numbers above suggest. Regardless of weightings, the continuation of tensions between the US and China brings a large level of uncertainty to US companies that depend on China for a significant portion of their revenue stream.
(Sources: The New York Times, FactSet)

Broad domestic equity markets have continued to rally over the past week, as we can see through the S&P 500 Index funds group moving higher to possess an average score of about 4.00. This group recently moved above precious metals and a few fixed income-related areas, as the “risk-on” market environment has led to more domestic equity-related groups dominating the top end of the Asset Class Group Scores (ACGS) page. On that end, there is only one fixed income group left with a group score above 4.00, namely US Government Agency with an average score of 4.31.
The further push we have seen from the S&P 500 Index funds group has also led the US Equity Core Percentile Rank (CorePR) to cross back above the 90% threshold with a recent posting of 92.96%. As a refresher, this reading tracks the percentage of names our core equity market representative, the S&P 500 Index funds group, is beating out of all the groups we track on the system. We saw the CorePR move as low as 57% in March, after maintaining a reading north of 90% since June of 2019. This latest move to the upside marks the first time the CorePR has been above 90% since February 26th of this year and is certainly a sign of broad strength across the large-cap space that has led the market higher after the recent drawdown.

On the other end of the group rankings, we have continued to see the US Money Market group fall in its score, with a recent posting of 2.38 leading to a Money Market Percentile Rank (MMPR) reading of 32.39%. This reading has generally been moving lower since its near-term high of 54.93% on March 23rd; however, much of this movement can be attributed to the improvement of other groups and not necessarily the declining score of US money market. This has begun to change over the past few weeks, as the score of money market has deteriorated alongside further improvement from some laggard equity areas, specifically looking towards US Large Cap Value and US Micro Cap, which each moved above money market this past week. The combination of score deterioration with further laggard improvement has pushed the MMPR to its lowest level since March 11th, as the reading has fallen more than 10% in May alone.

Although the MMPR has fallen significantly, it is still quite a bit above what have been “normal” levels for strong equity markets, which we see typically stay south of 20%. As we await the further decline of the MMPR, we see a number of groups that have shown near-term score improvement to sit just beneath US money market on the ACGS rankings, with a specific focus on energy-related areas such as MLPs, which possess a recent score posting of 2.34 (through 5/27). In looking at the score history of these two groups, we can see that MLPs have ranked beneath US money market since July of last year. These two areas moved quite close in score in January of this year before the enhanced market volatility drove them apart, with MLPs falling to a low score posting of only 0.20 on March 18th, one day before money market reached its recent score high of 3.13. Given their close proximity in recent scores, we would look towards this group and others nearby as places to monitor for the further dampening of the MMPR reading.

Average Level
34.32
| AGG | iShares US Core Bond ETF |
| USO | United States Oil Fund |
| DIA | SPDR Dow Jones Industrial Average ETF |
| DVY | iShares Dow Jones Select Dividend Index ETF |
| DX/Y | NYCE U.S.Dollar Index Spot |
| EFA | iShares MSCI EAFE ETF |
| FXE | Invesco CurrencyShares Euro Trust |
| GLD | SPDR Gold Trust |
| GSG | iShares S&P GSCI Commodity-Indexed Trust |
| HYG | iShares iBoxx $ High Yield Corporate Bond ETF |
| ICF | iShares Cohen & Steers Realty ETF |
| IEF | iShares Barclays 7-10 Yr. Tres. Bond ETF |
| LQD | iShares iBoxx $ Investment Grade Corp. Bond ETF |
| IJH | iShares S&P 400 MidCap Index Fund |
| ONEQ | Fidelity Nasdaq Composite Index Track |
| QQQ | Invesco QQQ Trust |
| RSP | Invesco S&P 500 Equal Weight ETF |
| IWM | iShares Russell 2000 Index ETF |
| SHY | iShares Barclays 1-3 Year Tres. Bond ETF |
| IJR | iShares S&P 600 SmallCap Index Fund |
| SPY | SPDR S&P 500 Index ETF Trust |
| TLT | iShares Barclays 20+ Year Treasury Bond ETF |
| GCC | WisdomTree Continuous Commodity Index Fund |
| VOOG | Vanguard S&P 500 Growth ETF |
| VOOV | Vanguard S&P 500 Value ETF |
| EEM | iShares MSCI Emerging Markets ETF |
| XLG | Invesco S&P 500 Top 50 ETF |

| Symbol | Company | Sector | Current Price | Action Price | Target | Stop | Notes |
|---|---|---|---|---|---|---|---|
| HLI | Houlihan Lokey Inc | Banks | $60.51 | upper $50s - mid to upper 60s | $68 | $49 | 4 for 5'er, pullback from AT high, consec buy signals, top 25% of DWABANK, pos week mom, 2.09% yield |
| ATSG | Air Transport Services Group Inc. | Aerospace Airline | $21.77 | low 20s | 33.50 | 17.50 | 4 for 5'er, top third of favored AERO sector matrix, spread quad top, pot. covered write, R-R>3.0 |
| KKR | KKR & Co. L.P | Finance | $28.67 | mid-to-upper 20s | 44.50 | 21 | 4 for 5'er, top half of FINA sector matrix, triple top, 2.2% yield, cov. write opp., R-R>4.0 |
| ICE | IntercontinentalExchange Inc. | Wall Street | $92.83 | 90s | 125 | 77 | 5 for 5'er, top 25% of WALL sector matrix, LT pos mkt RS, multi consec buy signals, 1.3% yield |
| DGX | Quest Diagnostics Incorporated | Healthcare | $115.54 | mid $110s to $130s | $132 | $92 | 4 for 5'er, pullback from AT high, consec buy signals, top 25% of favored healthcare sector, 2.02% yield |
| VRSK | Verisk Analytics, Inc. | Business Products | $163.46 | high 150s to 170s | $184 | $126 | 5 for 5'er, LT market & peer RS buy, consec buy signals, LT pos trend |
| BGS | B&G Foods, Inc. | Food Beverages/Soap | $23.93 | 22 - 24 | 28.50 | 18 | 5 for 5'er, #3 of 70 names in favored FOOD sector matrix, bullish catapult, 8.6% yield, pot. cov write |
| INTC | Intel Corporation | Semiconductors | $63.56 | hi 50s - mid 60s | 73 | 51 | 4 for 5'er, favored SEMI sector matrix, spread triple top, 2.1% yield, pot. covered write |
| CMCSA | Comcast Corporation | Media | $39.93 | hi 30s - low 40s | 48 | 32 | 4 for 5'er, LT mkt RS buy signal, spread quad top breakout, 2.3% yield |
| LAMR | Lamar Advertising Company | Media | $70.03 | low 70s to mid/upper 80s | $97 | $56 | 4 for 5'er, consec buy signals, #1 in DWAMEDIA, 5.83% yield |
| Symbol | Company | Sector | Current Price | Action Price | Target | Stop | Notes |
|---|---|---|---|---|---|---|---|
| HSBC | HSBC Holding PLC (United Kingdom) ADR | Banks | $24.17 | (26 - 23) | 17 | 28 | 0 for 5'er, bottom third of unfavored BANK sector matrix, LT neg mkt RS, multi sell signals, lower tops and lower bottoms |
| Symbol | Company | Sector | Current Price | Action Price | Target | Stop | Notes |
|---|---|---|---|---|---|---|---|
| ABBV | AbbVie Inc. | Drugs | $89.98 | 82 - 89 | 100 | 71 | See follow comment below. |
| Comment |
|---|
| ABBV AbbVie Inc. R ($90.97) - Drugs - ABBV moved to a sell signal. No new positions here. We will maintain our $71 stop. |
| CLX The Clorox Company R ($203.76) - Household Goods - Raise stop to $170, which would violate multiple levels of support on CLX's default chart. |
| QDEL Quidel Corporation R ($168.00) - Healthcare - QDEL hit our stop. |
| MDB MongoDB, Inc. Class A R ($221.52) - Software - Raise stop to $184, which would violate two levels of support on MDB's default chart. |
LAMR Lamar Advertising Company R ($68.66) - Media - LAMR is the #1 ranked stock in the media sector and currently has 4 technical attributes in its favor. With today’s market action, LAMR has reversed up into Xs to $71 after experiencing a slight pullback to $68 yesterday. As a result, LAMR is now one box away from marking a third consecutive buy signal. Okay to add new exposure in the low 70s to mid to upper 80s. We will set our initial stop at $56 and we will use LAMR’s bullish price objective of $97 as our near-term price target. Note LAMR offers a yield of 5.83%.
| 20 | ||||||||||||||||||||||||||||||||||||||||||||||||||||||
| 96.00 | 2 | X | • | 96.00 | ||||||||||||||||||||||||||||||||||||||||||||||||||
| 95.00 | X | O | X | O | • | Top | 95.00 | |||||||||||||||||||||||||||||||||||||||||||||||
| 94.00 | X | O | X | O | • | 94.00 | ||||||||||||||||||||||||||||||||||||||||||||||||
| 93.00 | X | O | X | O | • | 93.00 | ||||||||||||||||||||||||||||||||||||||||||||||||
| 92.00 | X | O | X | O | • | 92.00 | ||||||||||||||||||||||||||||||||||||||||||||||||
| 91.00 | X | O | O | • | 91.00 | |||||||||||||||||||||||||||||||||||||||||||||||||
| 90.00 | 1 | O | • | 90.00 | ||||||||||||||||||||||||||||||||||||||||||||||||||
| 89.00 | X | O | • | 89.00 | ||||||||||||||||||||||||||||||||||||||||||||||||||
| 88.00 | X | O | X | • | 88.00 | |||||||||||||||||||||||||||||||||||||||||||||||||
| 87.00 | X | O | X | O | • | 87.00 | ||||||||||||||||||||||||||||||||||||||||||||||||
| 86.00 | C | O | X | O | • | 86.00 | ||||||||||||||||||||||||||||||||||||||||||||||||
| 85.00 | X | O | 3 | O | • | 85.00 | ||||||||||||||||||||||||||||||||||||||||||||||||
| 84.00 | X | X | X | O | X | O | • | 84.00 | ||||||||||||||||||||||||||||||||||||||||||||||
| 83.00 | 5 | X | O | X | B | O | X | • | O | X | O | • | 83.00 | |||||||||||||||||||||||||||||||||||||||||
| 82.00 | X | O | X | O | X | X | O | X | O | X | • | O | O | • | 82.00 | |||||||||||||||||||||||||||||||||||||||
| 81.00 | X | O | X | O | X | O | X | O | X | O | • | O | • | 81.00 | ||||||||||||||||||||||||||||||||||||||||
| 80.00 | 3 | 4 | O | X | O | X | O | X | O | • | O | • | 80.00 | |||||||||||||||||||||||||||||||||||||||||
| 79.00 | O | X | O | X | O | X | 7 | X | X | A | • | O | • | 79.00 | ||||||||||||||||||||||||||||||||||||||||
| 78.00 | O | X | O | X | 6 | X | 8 | X | O | X | 9 | • | O | • | 78.00 | |||||||||||||||||||||||||||||||||||||||
| 77.00 | O | O | O | O | X | O | X | O | X | • | O | • | 77.00 | |||||||||||||||||||||||||||||||||||||||||
| 76.00 | O | O | X | O | X | • | O | • | 76.00 | |||||||||||||||||||||||||||||||||||||||||||||
| 75.00 | O | • | O | • | O | X | • | 75.00 | ||||||||||||||||||||||||||||||||||||||||||||||
| 74.00 | • | • | • | O | X | O | • | 74.00 | ||||||||||||||||||||||||||||||||||||||||||||||
| 73.00 | • | O | X | O | • | 73.00 | ||||||||||||||||||||||||||||||||||||||||||||||||
| 72.00 | • | O | X | O | X | • | 72.00 | |||||||||||||||||||||||||||||||||||||||||||||||
| 71.00 | • | O | X | O | X | O | • | X | x | 71.00 | ||||||||||||||||||||||||||||||||||||||||||||
| 70.00 | • | O | O | X | O | • | X | X | O | x | 70.00 | |||||||||||||||||||||||||||||||||||||||||||
| 69.00 | • | O | X | O | X | O | X | O | x | 69.00 | ||||||||||||||||||||||||||||||||||||||||||||
| 68.00 | • | O | X | O | X | X | O | X | O | 68.00 | ||||||||||||||||||||||||||||||||||||||||||||
| 67.00 | • | O | X | O | X | O | X | O | 67.00 | |||||||||||||||||||||||||||||||||||||||||||||
| 66.00 | O | X | O | X | O | X | 66.00 | |||||||||||||||||||||||||||||||||||||||||||||||
| 65.00 | O | X | O | X | O | X | 65.00 | |||||||||||||||||||||||||||||||||||||||||||||||
| 64.00 | O | X | O | O | X | 64.00 | ||||||||||||||||||||||||||||||||||||||||||||||||
| 63.00 | O | X | O | X | 63.00 | |||||||||||||||||||||||||||||||||||||||||||||||||
| 62.00 | O | X | O | X | 62.00 | |||||||||||||||||||||||||||||||||||||||||||||||||
| 61.00 | O | X | X | O | X | 61.00 | ||||||||||||||||||||||||||||||||||||||||||||||||
| 60.00 | O | X | O | X | O | X | 60.00 | |||||||||||||||||||||||||||||||||||||||||||||||
| 59.00 | O | X | X | O | X | O | X | 59.00 | ||||||||||||||||||||||||||||||||||||||||||||||
| 58.00 | O | X | O | X | O | X | O | X | Mid | 58.00 | ||||||||||||||||||||||||||||||||||||||||||||
| 57.00 | O | X | O | X | O | X | X | O | 57.00 | |||||||||||||||||||||||||||||||||||||||||||||
| 56.00 | O | X | O | X | O | X | O | X | 56.00 | |||||||||||||||||||||||||||||||||||||||||||||
| 55.00 | O | X | O | X | 5 | X | O | X | 55.00 | |||||||||||||||||||||||||||||||||||||||||||||
| 54.00 | O | X | O | X | O | X | O | • | 54.00 | |||||||||||||||||||||||||||||||||||||||||||||
| 53.00 | O | X | O | X | X | X | X | O | X | • | 53.00 | |||||||||||||||||||||||||||||||||||||||||||
| 52.00 | O | X | O | X | O | X | O | X | O | X | O | • | 52.00 | |||||||||||||||||||||||||||||||||||||||||
| 51.00 | O | X | O | X | O | X | O | X | O | X | X | • | 51.00 | |||||||||||||||||||||||||||||||||||||||||
| 50.00 | O | X | O | X | 4 | X | O | X | X | O | X | O | X | • | 50.00 | |||||||||||||||||||||||||||||||||||||||
| 49.00 | O | X | O | X | O | X | O | X | O | X | O | X | O | X | • | 49.00 | ||||||||||||||||||||||||||||||||||||||
| 48.00 | O | X | O | X | O | X | O | X | O | X | O | O | • | 48.00 | ||||||||||||||||||||||||||||||||||||||||
| 47.00 | O | X | X | O | X | O | X | O | X | O | X | • | 47.00 | |||||||||||||||||||||||||||||||||||||||||
| 46.00 | O | X | O | X | O | O | X | O | O | X | • | 46.00 | ||||||||||||||||||||||||||||||||||||||||||
| 45.00 | O | X | O | X | O | X | O | • | 45.00 | |||||||||||||||||||||||||||||||||||||||||||||
| 44.00 | O | X | O | X | O | X | • | 44.00 | ||||||||||||||||||||||||||||||||||||||||||||||
| 43.00 | O | X | O | X | O | X | • | 43.00 | ||||||||||||||||||||||||||||||||||||||||||||||
| 42.00 | O | X | O | X | O | X | • | 42.00 | ||||||||||||||||||||||||||||||||||||||||||||||
| 41.00 | O | X | O | X | O | X | • | 41.00 | ||||||||||||||||||||||||||||||||||||||||||||||
| 40.00 | O | X | O | X | O | X | • | 40.00 | ||||||||||||||||||||||||||||||||||||||||||||||
| 39.00 | O | X | O | X | O | X | • | 39.00 | ||||||||||||||||||||||||||||||||||||||||||||||
| 38.00 | O | X | O | X | O | X | • | 38.00 | ||||||||||||||||||||||||||||||||||||||||||||||
| 37.00 | O | O | X | O | • | 37.00 | ||||||||||||||||||||||||||||||||||||||||||||||||
| 36.00 | O | X | • | 36.00 | ||||||||||||||||||||||||||||||||||||||||||||||||||
| 35.00 | O | X | • | 35.00 | ||||||||||||||||||||||||||||||||||||||||||||||||||
| 34.00 | O | X | • | 34.00 | ||||||||||||||||||||||||||||||||||||||||||||||||||
| 33.00 | O | X | • | 33.00 | ||||||||||||||||||||||||||||||||||||||||||||||||||
| 32.00 | O | X | • | 32.00 | ||||||||||||||||||||||||||||||||||||||||||||||||||
| 31.00 | O | • | 31.00 | |||||||||||||||||||||||||||||||||||||||||||||||||||
| 20 |
| AAP Advance Auto Parts, Inc. ($139.63) - Autos and Parts - Advance Auto Parts completed a bullish catapult with a break at $142 today, marking a fifth consecutive buy signal. This 3 for 5'er returned to a positive trend in late April and ranks in the top quartile of the favored autos and parts sector RS matrix. Overall, the weight of the evidence is positive here and long exposure may be added. Note that support is offered at $132. |
| ABC AmerisourceBergen Corporation ($96.12) - Drugs - ABC broke a double top at $96 on Thursday, marking the second consecutive buy signal on the chart. This stock is a solid 4 for 5’er within the favored drugs sector that moved back into a positive trend earlier this month. From here, initial sits at $91 while overhead resistance is at $97. ABC offers a yield of 1.75%. |
| AMT American Tower REIT ($254.80) - Real Estate - American Tower shares returned to a buy signal with a bearish signal reversal today at $256. This 4 for 5'er returned to a positive trend in late March and has maintained a market RS buy signal since 2002, confirming long-term strength. AMT also ranks in the top half of the favored real estate sector RS matrix and displays a low rRisk of 1.01 (relative the S&P 500 Index benchmark reading of 1.00). Okay to add long exposure here as demand is in control. Note that support is offered at $224 and that AMT carries a yield of 1.73%. |
| ANSS Ansys Inc ($277.10) - Software - Ansys shares reversed up today, breaking a double top at $276 to mark a second consecutive buy signal. This 4 for 5'er has maintained a positive trend and long-term market RS buy signal since January of 2019 and August of 2011, respectively. The weight of the evidence is positive and long exposure may be added here on the breakout. Note that support is offered at $260 and that the bullish support line is found at $256. |
| BL Blackline Inc ($73.75) - Software - BL is a solid 4 for 5’er within the favored software sector that is trading in a positive trend. With action on Thursday, BL broke a double top at $72 before moving higher to $73. From here, BL faces resistance at $74. From here, initial support now sits at $67. |
| CDAY Ceridian HCM Holding, Inc. ($70.24) - Software - Ceridian Holdings completed a bullish triangle with today's break at $68, marking a third consecutive buy signal before advancing further past resistance to $70. This 4 for 5'er returned to a positive trend in late April and has maintained a market RS buy signal since September of 2018, confirming long-term strength. CDAY also ranks in the top half of the favored software sector RS matrix. Demand is in control and long exposure may be added here. Note that support is offered at $63. |
| EQIX Equinix, Inc. ($680.77) - Real Estate - EQIX returned to a buy signal on Thursday with a quadruple top breakout at $688. This stock is a perfect 5 for 5’er that moved back into a positive trend in late March and has maintained a long-term market RS buy signal since February 2009. Additionally, EQIX ranks in the top half of the favored real estate sector RS matrix and has experienced two months of positive monthly momentum. From here, support sits at $640, the bullish support line. EQIX faces resistance at the $696 level. |
| HD Home Depot, Inc. ($250.91) - Building - HD broke a double top at $252 on Thursday and is now trading at new all-time highs. This recent breakout marks the fourth consecutive buy signal for the 5 for 5’er within the favored building sector. HD has maintained long-term strength versus the broader market since January 2012 and just experienced a flip to positive monthly momentum. From here, initial support is offered at $236. HD offers a yield of 2.38%. |
| TYL Tyler Technologies, Inc. ($377.95) - Software - TYL broke a double top at $368 on Thursday before rallying to $376, a new all-time high. This stock is a perfect 5 for 5’er within the favored software sector that has maintained a long-term market RS buy signal since August 2011. Additionally, monthly momentum just flipped positive, suggesting the potential for higher prices. From here, initial support is offered at $344. |
| ZEN Zendesk Inc ($85.15) - Software - ZEN broke a double top at $84 before moving higher to $85 on Thursday. This marks the second consecutive buy signal on the chart for this 4 for 5’er within the favored software sector. ZEN faces resistance at current levels with additional resistance at the $91 level. Initial support sits at $78. |
| Name | Option Symbol | Action | Stop Loss |
|---|---|---|---|
| ConocoPhillips - $43.01 | COP2021H40 | Buy the August 40.00 calls at 5.95 | 37.00 |
| Name | Option | Action |
|---|---|---|
| The Walt Disney Company ( DIS) | Sep. 105.00 Calls | Stopped at 18.30 (CP: 16.60) |
| Electronic Arts Inc. ( EA) | Sep. 115.00 Calls | Initiate an option stop loss of 13.45 (CP: 15.45) |
| Name | Option Symbol | Action | Stop Loss |
|---|---|---|---|
| Newell Brands Inc. - $13.58 | NWL2018U15 | Buy the September 15.00 puts at 2.55 | 15.00 |
| Name | Option | Action |
|---|---|---|
|
|
||
| Name | Option Sym. | Call to Sell | Call Price | Investment for 500 Shares | Annual Called Rtn. | Annual Static Rtn. | Downside Protection |
|---|---|---|---|---|---|---|---|
| The Walt Disney Company $121.53 | DIS2018I120 | Sep. 120.00 | 7.65 | $55,172.00 | 24.85% | 18.75% | 5.49% |
| Name | Action |
|---|---|
| Micron Technology, Inc. (MU) - 49.45 | Sell the October 50.00 Calls. |
| Chevron Corporation (CVX) - 93.90 | Sell the September 95.00 Calls. |
| Intel Corporation (INTC) - 63.56 | Sell the September 65.00 Calls. |
| J.P. Morgan Chase & Co. (JPM) - 101.37 | Sell the September 105.00 Calls. |
| Name | Covered Write |
|---|---|
|
|
|
Daily Equity & Market Analysis
Loading, Please Wait...
