Broad equity markets enjoyed a nice start to the third week of May, as major indices recovered from a negative performance last week.
Applying the Fund Score Method through FSM Models: Join us on Thursday, May 21st at 1pm ET for a live webinar on the application of fund scores in a systematic, rules-based model. This webinar will feature an overview of the various FSM strategies and potential implementation ideas. Click here to register!
Replay for Fund Scores and Asset Class Group Scores Webinar: We have a replay available for our latest webinar on Fund Scores and the Asset Class Group Scores page that took place on Thursday, May 14th. In this webinar, we explore the concepts and methodology used to calculate the Fund Score that is assigned to ETFs and Mutual Funds across the NDW Research Platform. Click here to view the replay!
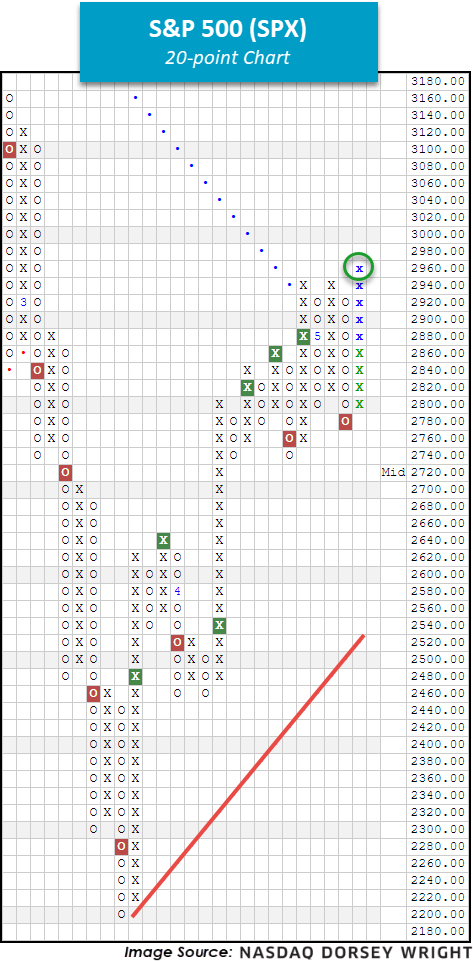
Investors started their weeks on Monday morning (5/18) to the Dow Jones Industrial Average DJIA, S&P 500 SPX and Nasdaq Composite NASD each rallying in excess of 3%. The gap higher diluted the losses posted last week (ending 5/15) in which the major equity indices fell in the neighborhood of -2%, their worst week in almost two months (source: wsj.com). With today’s movement upward the 20-point chart for SPX (pictured below) returned to a buy signal with a triple top break at 2960, continuing its relatively steep ascent well-above the bullish support line. Additionally, the bullish percent indicator for the S&P 500 BPSPX will return to a column of Xs near the 50-yard line (based on intraday readings), meaning that approximately 50% of stocks in the S&P 500 will be trading on a Point and Figure buy signal on their trend chart. This increase in participation signaled by the reversal up into Xs is especially notable and welcomed given the fact that only 89 stocks in the S&P 500 have posted positive returns year-to-date (through 5/15) while 99 stocks in the index are down -40% or more.
To further pile on the generally bullish statistics we find the S&P 500 roughly 9% above its 50-day moving average, and perhaps to a surprise, this has historically been a positive event. If able to surpass the 10% threshold, the data point would align with lows hit in 2009, 1998, 1991, 1982, and 1975. Recognizing that elevated levels of volatility remain present, investors should remain cautious and highly conscious of their underlying holdings / risk tolerance. To receive intraday alerts on further action, consider using the blue “Set Alert” button located near the top of each chart page.

