With summer right around the corner, it's time for "Summertime Blues." Today we take a look at how the summer months perform relative to other seasons historically. Unfortunately, the summer months tend to provide lackluster performance providing further evidence of, "Sell in May and go away."
Although summer doesn’t officially begin for three more weeks, many Americans recognize Memorial Day as the unofficial start of the season. While this summer is likely to be far from normal, we typically associate the season with warm weather, beach vacations, and longer days; however, in the investment world, the summer months are associated with lackluster returns, also known as the "Summertime Blues." This year, we enter the summer months coming off one of the most volatile starts to a year ever. However, the major indices have rebounded strongly off their March bottoms with the S&P 500 SPX and DOW DJIA now down -6.03% and -10.48% for the year, respectively (through 5/27). Meanwhile, the Nasdaq NASD is actually in positive territory for the year with a return of 4.9%. While the Bullish Percent for the NYSE BPNYSE currently sits in Xs, domestic equities currently rank third in the DALI asset class rankings as we head into the historically sluggish summer months. Of course, there is no way to know how the next three months will unfold, especially given the uncertainty around COVID-19 and the reopening of maxim of the Summertime Blues came to be.
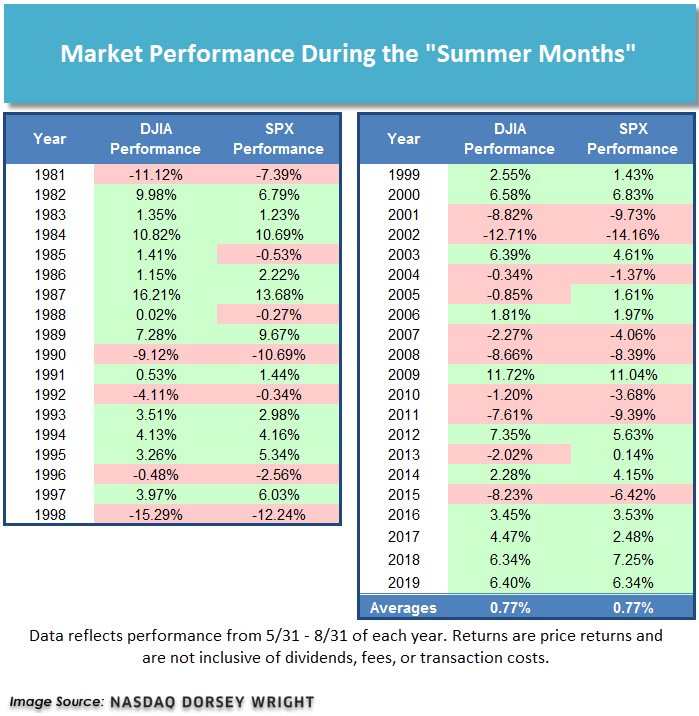
The table below shows the returns of both the Dow Jones Industrial Average and the S&P 500 during the summer months (May 31st to August 31st) back to 1981. The S&P 500 and the Dow Jones Industrial Average have each finished in negative territory in 15 of the past 39 summers (or about 38.5% of the time). Of those 15 down summers, there were 13 summers in which SPX and DJIA were both down at the same time. While less than half of the summers have been negative for these benchmarks, the bad summers were indeed bad, with some down double digits over the three-month period. For instance, in the summer of 1990, the SPX fell -10.69%. In 1998, it saw a drop of -12.24%; but the worst summer came in 2002 during the tech crash when the index declined -14.16%. During the summer of 2008, which began a famously longer slide, SPX fell -8.39%. The market has bucked the trend recently, however, as both indices have posted gains during the most recent four summers.
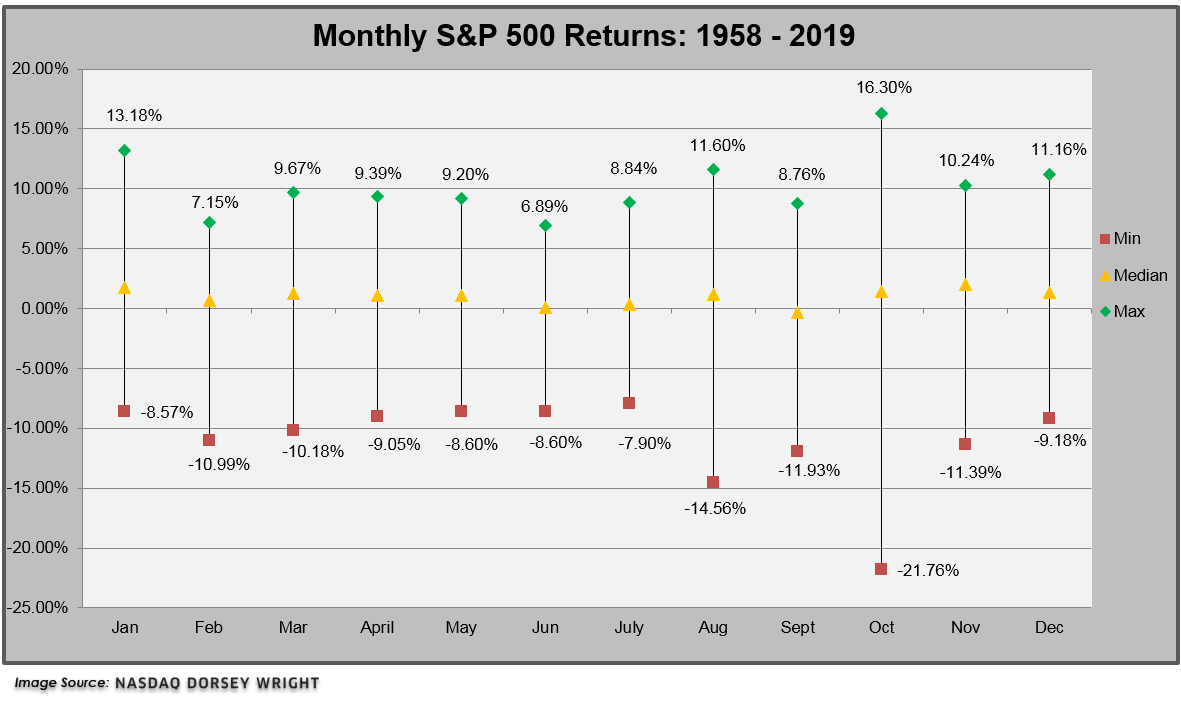
In an effort to determine if there is one month that tends to have an outsized effect on summer returns as a whole, we compiled a monthly summary of S&P 500 returns going back to 1958. What we found is that the summer months tend to have a lower median return than most of the other months of the year. It is actually the month of September that has historically provided the lowest median return at -0.30%, but it is followed closely by June which has a median return of just 0.05%. Notice too that the spread, i.e. the max return in a given month versus the minimum return in a given month, is relatively low for the summer months (namely June and July). A closer look at the month of June reveals a max return of 6.89% in the last 60 years, which it posted last year, and also followed a May return of -6.58%. Every other month, except February, had a maximum return in excess of 8%. Clearly, June has historically been one of the weaker months for SPX returns. However, we can't blame the Summertime Blues on June alone. August has experienced the second-largest drawdown (after October) at -14.56%, which compares unfavorably to the other months' minimums which seem to hover around -10%. The data below indicates that the Summertime Blues cannot be traced back to just one month.
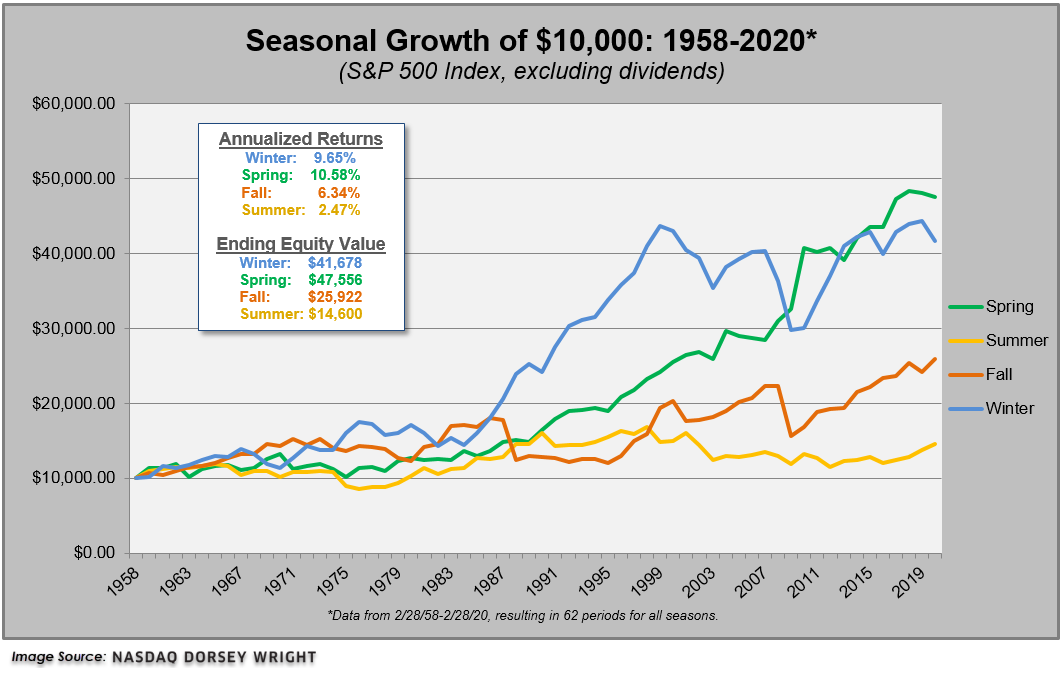
To take this concept one step further, we looked at four hypothetical portfolios specific to each of the four seasons. Defined as follows:
Winter Portfolio Dates: 11/30 - 2/28
Spring Portfolio Dates: 2/28 - 5/31
Summer Portfolio Dates: 5/31 - 8/31
Fall Portfolio Dates: 8/31 – 11/30
The end result? The summer portfolio greatly underperformed the other three seasons - fall, winter, and spring. If you were to invest only during the spring months (March through May), the initial investment would have had a cumulative return of 375% from 1958 through 2019, with an average annualized return of 10.58%, making it the best performing seasonal portfolio. The summer months pale in comparison to the others, gaining a measly 46% since 1958 years! That results in an average annualized rate of return of only 2.47%.


