The Us Equity Core Percentile Rank moves higher while the Money Market Percentile Rank continues lower.
Broad domestic equity markets have continued to rally over the past week, as we can see through the S&P 500 Index funds group moving higher to possess an average score of about 4.00. This group recently moved above precious metals and a few fixed income-related areas, as the “risk-on” market environment has led to more domestic equity-related groups dominating the top end of the Asset Class Group Scores (ACGS) page. On that end, there is only one fixed income group left with a group score above 4.00, namely US Government Agency with an average score of 4.31.
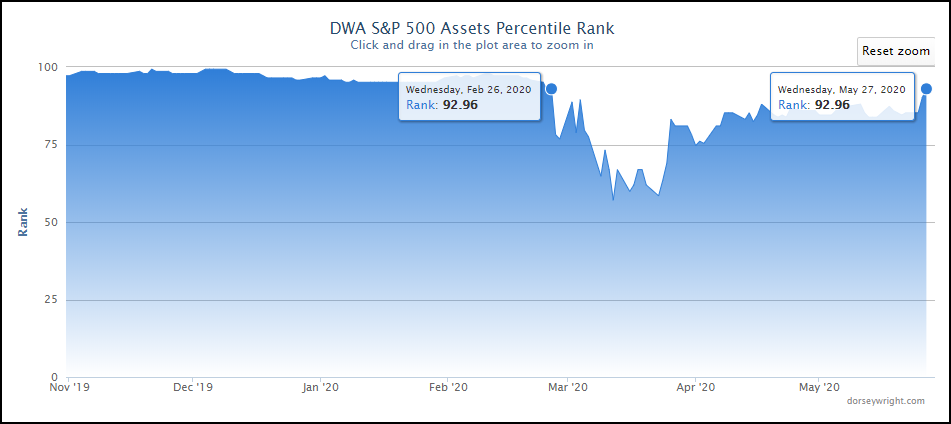
The further push we have seen from the S&P 500 Index funds group has also led the US Equity Core Percentile Rank (CorePR) to cross back above the 90% threshold with a recent posting of 92.96%. As a refresher, this reading tracks the percentage of names our core equity market representative, the S&P 500 Index funds group, is beating out of all the groups we track on the system. We saw the CorePR move as low as 57% in March, after maintaining a reading north of 90% since June of 2019. This latest move to the upside marks the first time the CorePR has been above 90% since February 26th of this year and is certainly a sign of broad strength across the large-cap space that has led the market higher after the recent drawdown.

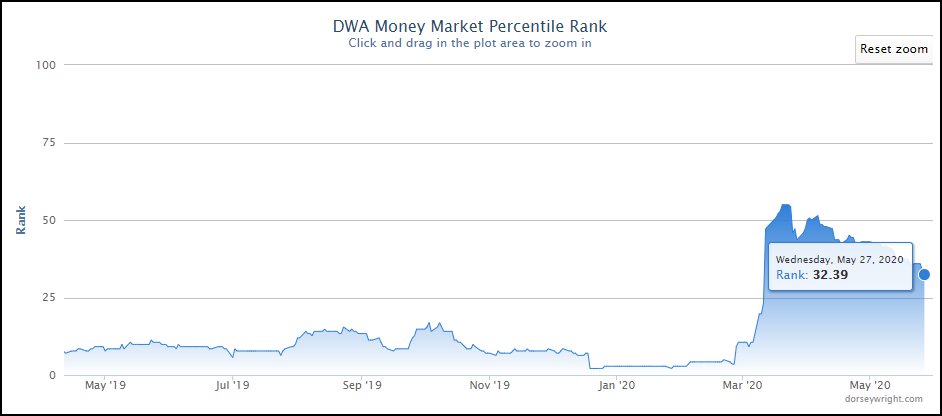
On the other end of the group rankings, we have continued to see the US Money Market group fall in its score, with a recent posting of 2.38 leading to a Money Market Percentile Rank (MMPR) reading of 32.39%. This reading has generally been moving lower since its near-term high of 54.93% on March 23rd; however, much of this movement can be attributed to the improvement of other groups and not necessarily the declining score of US money market. This has begun to change over the past few weeks, as the score of money market has deteriorated alongside further improvement from some laggard equity areas, specifically looking towards US Large Cap Value and US Micro Cap, which each moved above money market this past week. The combination of score deterioration with further laggard improvement has pushed the MMPR to its lowest level since March 11th, as the reading has fallen more than 10% in May alone.

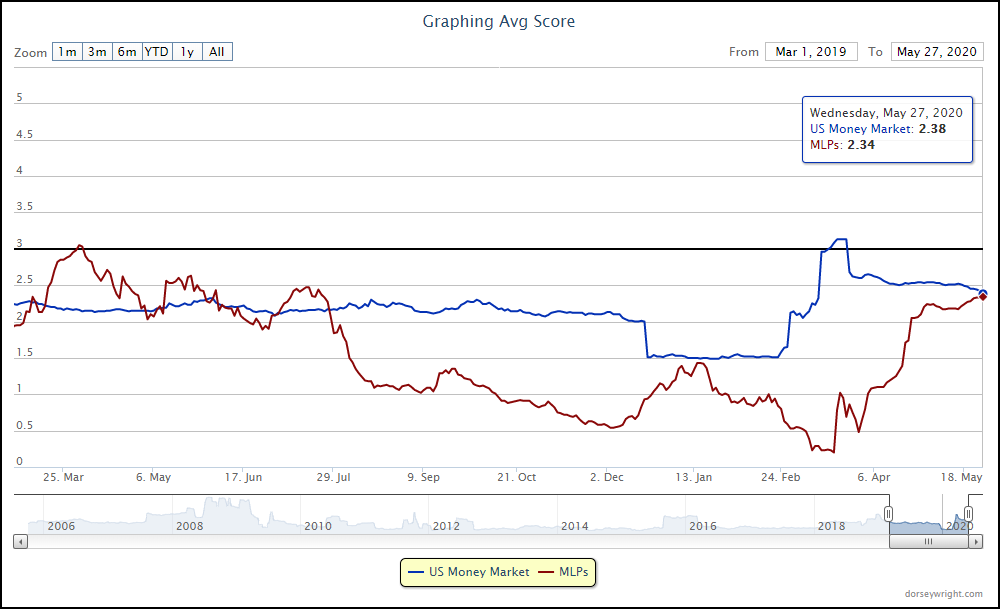
Although the MMPR has fallen significantly, it is still quite a bit above what have been “normal” levels for strong equity markets, which we see typically stay south of 20%. As we await the further decline of the MMPR, we see a number of groups that have shown near-term score improvement to sit just beneath US money market on the ACGS rankings, with a specific focus on energy-related areas such as MLPs, which possess a recent score posting of 2.34 (through 5/27). In looking at the score history of these two groups, we can see that MLPs have ranked beneath US money market since July of last year. These two areas moved quite close in score in January of this year before the enhanced market volatility drove them apart, with MLPs falling to a low score posting of only 0.20 on March 18th, one day before money market reached its recent score high of 3.13. Given their close proximity in recent scores, we would look towards this group and others nearby as places to monitor for the further dampening of the MMPR reading.

