Most Requested Symbols

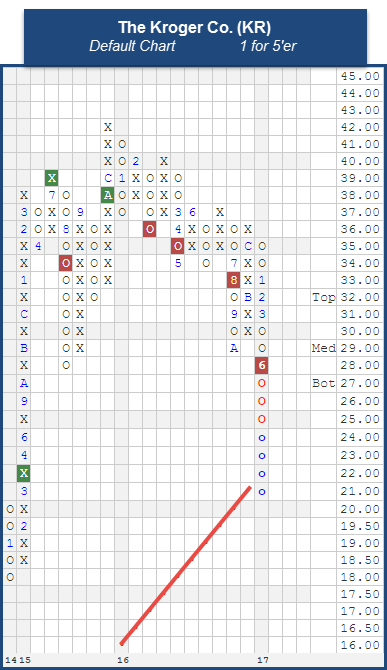
On Friday, we learned that not even grocery giants are immune to a disruption from the technology sector. Prior to market open, it was announced that premium grocer Whole Foods Market, Inc. WFM would be acquired by online retail giant Amazon Inc. AMZN for roughly $14 billion. As a result of the unanticipated deal announcement, the already-struggling retail sector took a hit right out of the gate, with a handful of grocery competitors down double digits. Retailers such as Target Corporation TGT, Costco Wholesale Corporation COST, and The Kroger Co. KR saw shares slide with the looming fear that AMZN will continue to disrupt traditional brick-and-mortar stores and traditional ways of business. One name in particular that was hit hard was Kroger. KR, already down on less than favorable earnings from Thursday, slid over 12% on Friday. Over the past year, shares of KR have virtually been cut in half. Looking at the default chart below, KR broke a double bottom at $28 intraday on Thursday and with Friday’s action, fell further to $21, a low level not seen on the chart since March of 2014. This sell-off violated the bullish support line that had been in tact since May of 2011, flipping the overall trend negative and downticking KR to a weak 1 for 5'er. Additionally, weekly momentum just flipped negative, suggesting the potential for further price deterioration from here. At this juncture, we would avoid exposure to Kroger and the unfavored retail sector in general. Only time will tell what long-term affect this acquisition will have on the retail sector.
The performance numbers above a price return is not inclusive of dividends or all transaction costs. Past performance is not indicative of future results. Potential for profits is accompanied by possibility of loss.

Over the course of the past week, we have been talking about the tremors surrounding the broad Technology sector. The Were You Aware...? from yesterday (6/15) discussed what is occurring on an indicator level (Bullish Percents, Positive Trends, Volatility). In addition, the ETF Spotlight from Tuesday (6/13) discussed whether recent events have been an epidemic or a reversion by looking into performance, bell curves, and addressing the technical picture of various Technology based ETFs. Today we will expand on these topics by providing an overview of the PowerShares QQQ Trust QQQ and pop the hood (or bonnet for our British friends) by analyzing correlation, drawdowns, and eight stocks which all present varied technical pictures. These pieces offer additional color and a chance for us to elaborate and evaluate the trading action experienced within the index over the past week.
For those that may be unfamiliar, the PowerShares QQQ Trust QQQ seeks excess return by tracking the Nasdaq 100 Index NDX, which owns roughly 100 of the largest domestic and international non-financial companies listed on the Nasdaq stock market based upon market capitalization. The fund is then rebalanced and reconstituted each year. It may be no surprise that QQQ is tech heavy, offering roughly 60% exposure across both the top 10 holdings and the entire portfolio. Not only is the fund overweight Technology, but also to Large Cap Growth. Those that have attended our broker institutes, roadshows, or been avid readers of our Daily Equity Report will be familiar with our research supporting the benefits of overweighting this style box and understand the frustrations of being underweight over the past five years. You can view one report on this topic from our Money Managers by clicking here. This one, two punch combination has helped the Q's outpace the market by more than double thus far in 2017 (through 6/15) in addition to outperforming the market on a 1, 3, and 5 year annualized basis as shown below. Thanks to these facts, the Q's rank within the 93rd percentile of all funds year-to-date, up 17.43% and the 96th percentile on a rolling one year basis, up 29.16%. Its impressive fund score, 5.76, speaks positively to its trending and relative strength metrics. It also handily takes care of its benchmarks' average scores: Domestic Growth (3.89), All US (3.51), and Large Cap Growth (3.87). QQQ's fund score has also not seen a level below 3.0 since 2009. The default trend chart shows a notable breakout in August 2016 at $116, breaking a spread triple top and taking out resistance dating back to July 2015. The fund has been able to better those highs over the past ten months, currently trading in the $140's. The chart pattern has made it difficult to find entry points and establish support since it has been in a column of X's since July last year which some refer to as a "flagpole" or "stem." However, if we look at the 1 point per box chart, we are able to locate a more recent breakout in December 2016 at $120, a spread quadruple top break. QQQ was able to make a higher bottom in May at $136, which can be used as support. With last week's trading action, the fund pulled back to the $138 level, which may be used to initiate new positions. The first sign of trouble comes with a move to $135, a double bottom break.

It’s important to remember that the Nasdaq 100 Index NDX and the S&P 500 SPX are different in their exposure styles which is why you’ll see different return patterns between the two over time. As you saw in the image above, the Nasdaq 100 is essentially a Technology (58%) and Consumer Cyclical (22%) index with a little Healthcare and Consumer Staples mixed in as well. The S&P 500 on the other hand is 23% Technology, then spread out among Financials (14%), Healthcare (14%), and Consumer Cyclical (12%). Industrials and Consumer Staples also account for 10% and 9%, respectively. The difference in sector exposure explains much of why the returns will vary and also explains why the Nasdaq 100 experienced a more volatile week than the S&P 500 (See: correction in Growth and Technology).
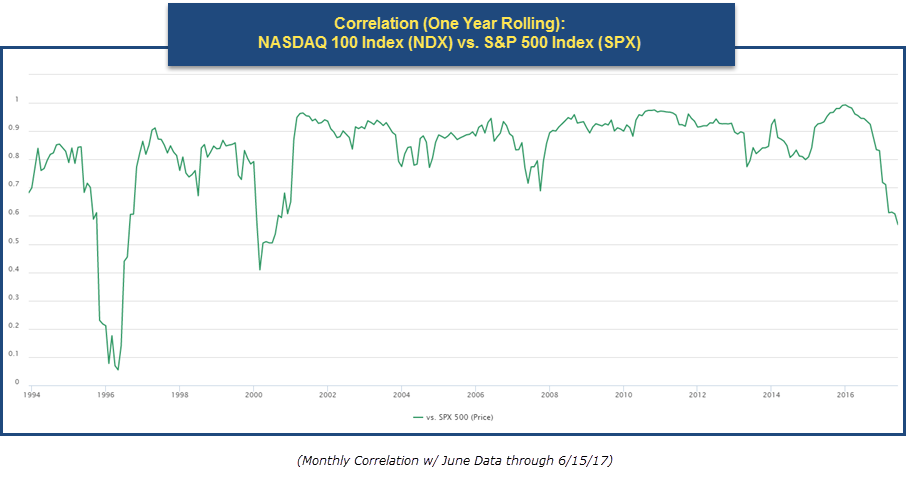
In addition to differences in sector exposure, one can see how there has been divergence between the two from a correlation standpoint, as the correlation between the Nasdaq 100 and the S&P 500 has been weaker in recent months. Correlation is a statistical measurement that describes the relationship between two variables (in this case, Nasdaq 100 vs. S&P 500). A correlation reading of 0.0 means there is no stable relationship, which in our case means that the two indices move independently of one another. A correlation of -1.0 (perfectly negative) suggests the indices move opposite of each other. Conversely, a correlation of +1.0 (perfectly positive) suggests the two investments move in the same direction at the same time.
In the graph below, we have plotted the trailing 12-month correlation of the Nasdaq 100 versus the S&P 500. There have been times when the two indexes were highly correlated and times then they were extremely uncorrelated. After a stretch between 2001 and 2016 when the correlation between the two was fairly high (ranging between 0.9 to 1), the relationship between the two indexes has become weaker here recently. Notice how the correlation has just fallen down below 0.60; the lowest reading since right after the Tech Crash in the early 2000’s. The fall in correlation is an indication the Nasdaq 100 and the S&P 500 are beginning to move more independently from each other, which probably doesn’t come as a surprise after the recent trading action that has transpired over the past couple of weeks and the excess returns we have witnessed.
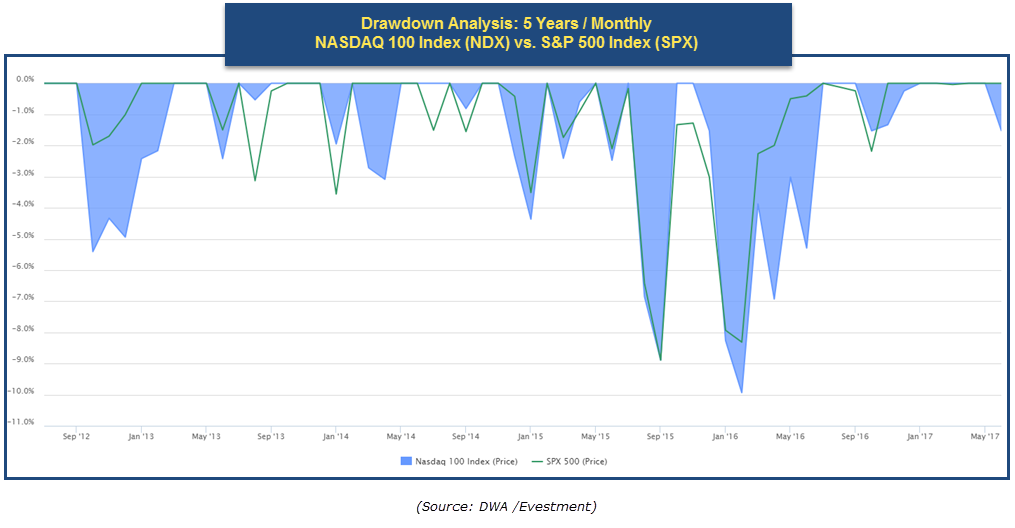
Through the first half of June, the NDX has fallen -1.53% while the average Nasdaq-100 stock fell -1.13%. While not a severe “correction,” it appears worse on a relative basis, as the S&P 500 is up 0.86% and the S&P 500 Equal Weighted Index SPXEWI is up 1.26% over that same time period. What’s interesting about the recent dip in the Nasdaq 100 is that this is the first time since June 2016 since the Nasdaq 100 is down for the month while the S&P 500 is up. However, we still have the second half of June to see if this 12-month record is broken. Going back over the last five years, one can see that the recent volatility in the Nasdaq 100 is roughly equivalent to that of August – September 2016 dip. We have yet to see anything like the early 2016 drawdown (nearly -10%) though. For now, we’ll continue to monitor the developments taking place on the chart of the Q's as well as its 100 plus constituents, some of which we have spotlighted below.
Now we will dive into the technical pictures of a few stocks and provide a list of stocks that look similar to the examples listed below. These ideas were chosen by the analysts after scrolling through the thumbnail charts and do not result from any queries.
| Symbol | Name | Price | Tech Attrib | Broad Sector | Overbought/Oversold | Yield | YTD Performance | Reason For Inclusion | ||
| AAPL | Apple Inc. | 144.29 | 4 |
Technology |
|
1.75 | 24.581 | Stem/Pullback | ||
| AVGO | Broadcom Ltd | 237.99 | 5 |
Technology |
|
1.71 | 34.633 | Constructive Pullback Close To Support, Lower OBOS | ||
| CTXS | Citrix Systems, Inc. | 79.26 | 4 |
Technology |
|
0.00 | 11.451 | Shakeout Pattern Initiated | ||
| DISCK | Discovery Communications Inc. 'C' | 25.52 | 0 |
Consumer Cyclical |
|
0.00 | -4.705 | Weak Before the Correction Last Week | ||
| DLTR | Dollar Tree, Inc. | 72.73 | 2 |
Consumer Cyclical |
|
0.00 | -5.766 | Deteriorated With Last Week's Action | ||
| GOOGL | Alphabet Inc. Class A | 960.18 | 4 |
Technology |
|
0.00 | 21.166 | Near-Term Breakdown, Long-Term Picture Positive | ||
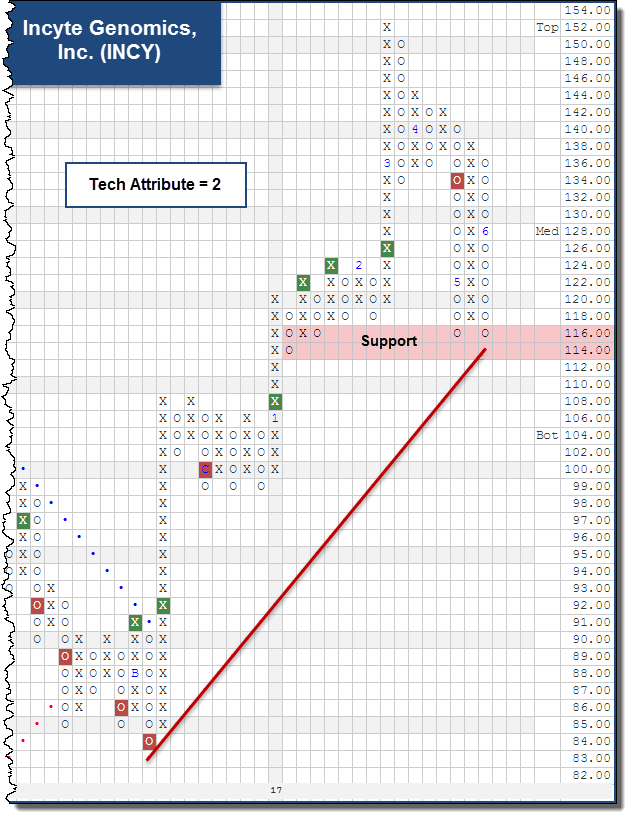
| INCY | Incyte Genomics, Inc. | 120.37 | 2 |
Healthcare |
|
0.00 | 20.046 | Testing Important Support | ||
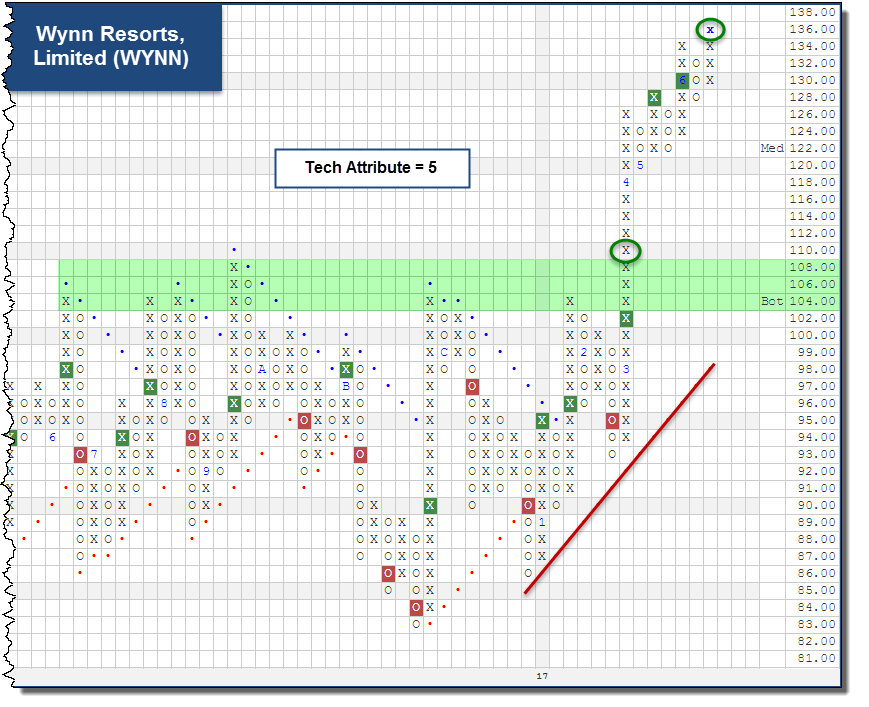
| WYNN | Wynn Resorts, Limited | 134.04 | 5 |
Consumer Cyclical |
|
1.49 | 54.942 | Not Bothered by Recent Volatility |
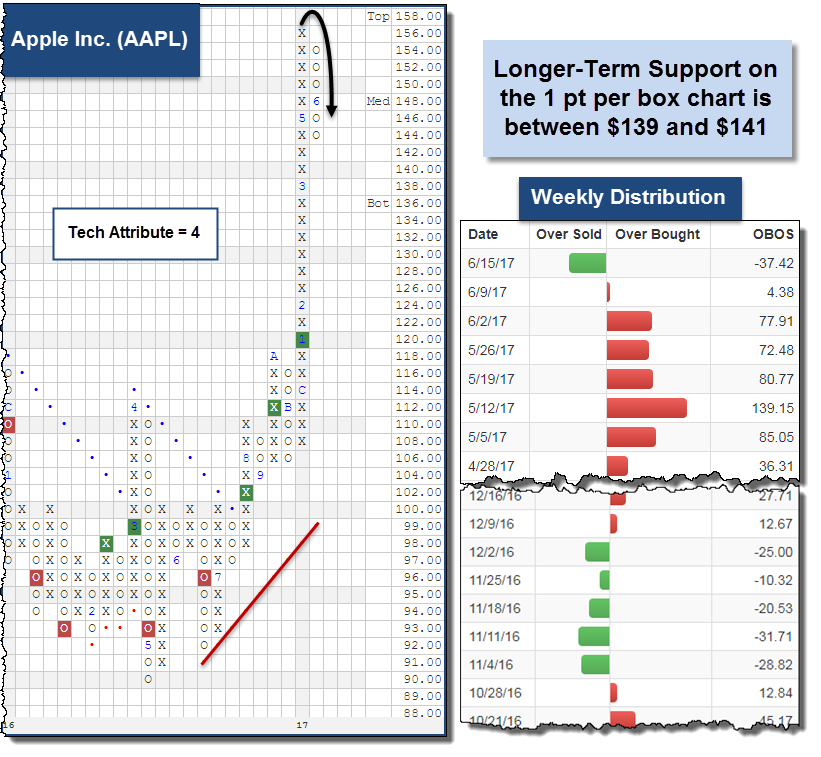
AAPL Apple Inc. ($143.90) - Computers - (11.52 weighting) AAPL is a 4 for 5’er ranking in the top quartile of the favored Computers sector matrix. Looking to its trend chart, we can see it was trading up on a stem before last week’s volatility. It has since pulled back to $144 and is -37% oversold. This is the first oversold reading we have seen for AAPL since November 2016. The stock remains on a buy signal and trading well above its bullish support line. Looking to its one point per box chart, we can see the stock is resting against support at $143 and has further support between $139 and $141. Those long may continue to hold. From here, a move to $148 would put the stock back on a Point and Figure buy signal.
Other Stem & Pullback Examples:
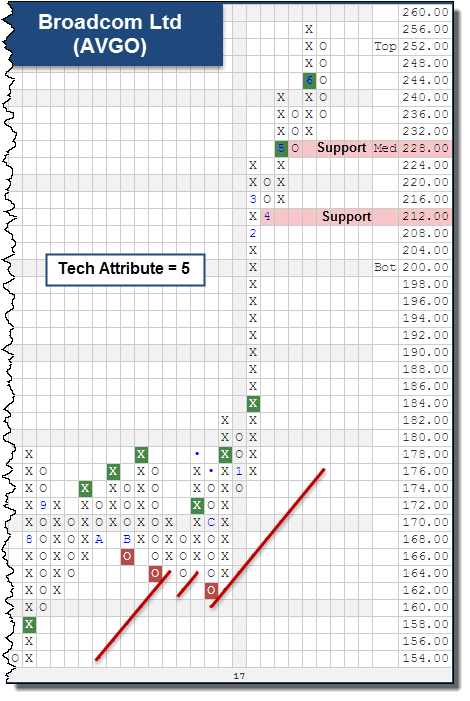
AVGO Broadcom Ltd ($237.92) - Semiconductors - (1.45 weighting) AVGO qualifies as one of our “constructive pullbacks.” The stock had broken four consecutive double tops while forming a pattern of higher tops and bottoms. AVGO then traded above the top of its 10-week trading band at +115% overbought in early June. It has since pulled back to $236 since that high of $256. The 5 for 5’er which ranks in the top half of the favored Semiconductors sector matrix may be considered for new entries on this pullback as it lowers your cost basis and puts you closer to support at $228 and $212 from here.
Other Constructive Pullbacks:
* Two charts are in the process of forming triangle patterns: Intuitive Surgical, Inc. ISRG and NVIDIA Corporation NVDA. Add these to your watch list and see if they are able to become bullish triangles ($920 and $156 respectively) or if they flip negative and become bearish triangles ($892 and $146).
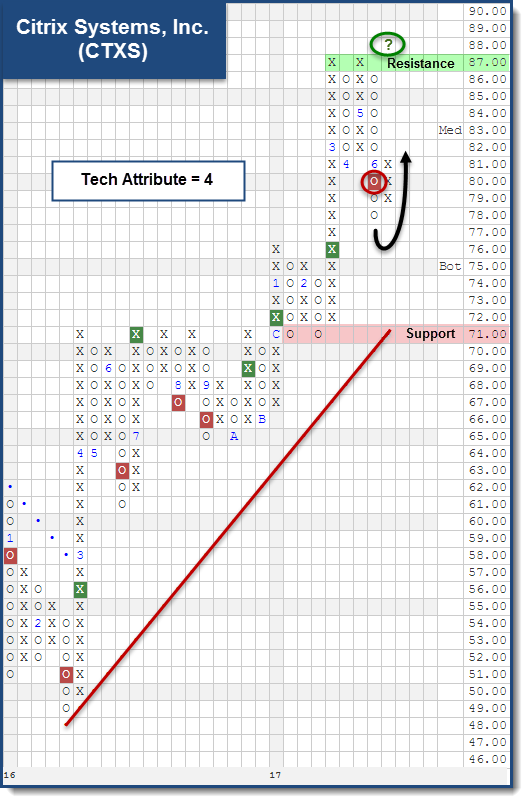
CTXS Citrix Systems, Inc. ($79.24) - Software - (0.19 weighting) After forming a double top at $87, but not breaking it, CTXS broke a double bottom at $80 and fell further to $78. This set up a potential shakeout pattern. The shakeout is a bullish pattern designed to eliminate the weaker holders of the stock. The pattern is initiated upon a reversal into X’s and completed upon a potential triple top break. The shakeout for CTXS has been initiated after reversing up into X’s at $81, but will not be completed unless it moves to $88, a new high. The 4 for 5’er may be considered for new entry on this reversal up or upon a potential triple top break. From here, support is at $78 and in the lower $70’s.
Other Shakeouts or Potential Shakeouts:
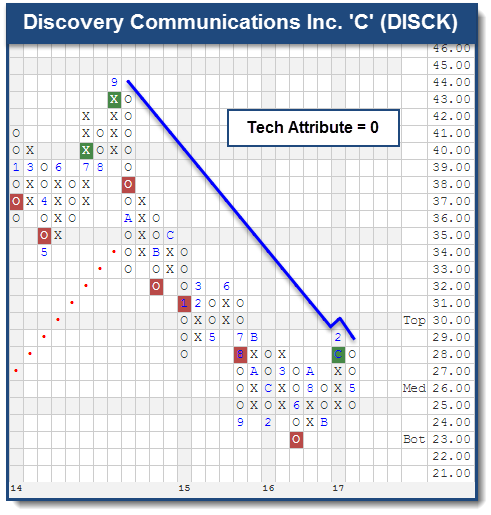
DISCK Discovery Communications Inc. 'C' ($25.39) - Media - (.09 weighting) DISCK has been in a negative trend since October 2014 and it has no positive technical attributes. The chart has managed to find some support in the mid $20's and is currently testing its bearish resistance line. If DISCK can make a higher bottom and move to $30, it will penetrate the bearish resistance line and give a second consecutive buy signal. Otherwise, until the chart can show some signs that demand is in control we would continue to avoid DISCK.
Other Weak Stocks Before Correction:
DLTR Dollar Tree, Inc. ($69.88) - Retailing - (0.26 weighting) DLTR traded in an overall range bound pattern for the past 18 months with the exception of a brief stint in June – August 2016. The stock fell to support in the lower $70’s with last week’s volatility but was unable to hold that level. With today’s action (6/16) the stock fell to $66. DLTR only offers two positive technical attributes and ranks in the bottom half of its sector matrix. This adds to the weight of evidence for the unfavored Retailing sector as many of those charts have broken down. Those long may exit positions here or on a reversal into X’s and avoid DLTR moving forward.

Other Stocks That Deteriorated With Last Week's Action:
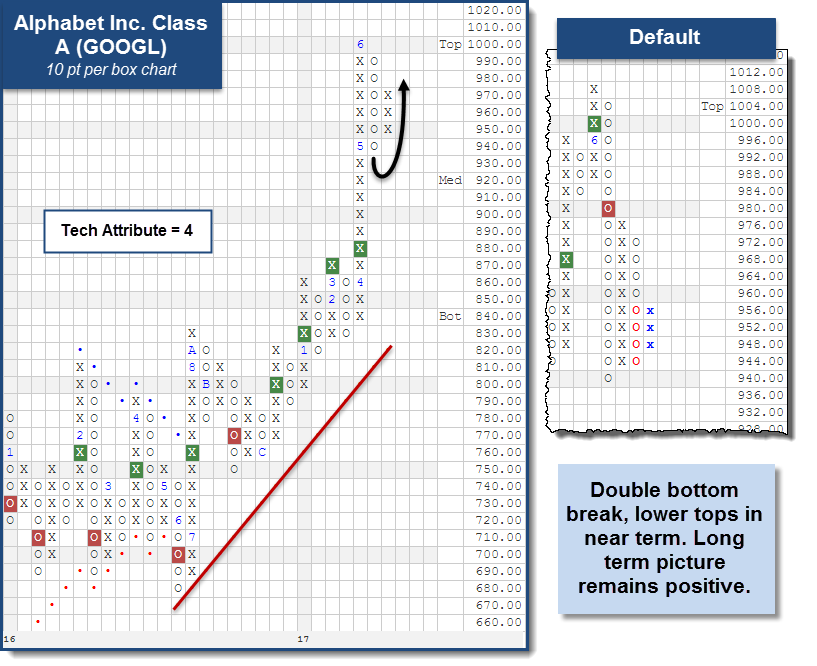
GOOGL Alphabet Inc. Class A ($950.31) - Internet - (4.34 weighting) Year-to-date (through 6/15) this stock is up over 21%. In June, GOOGL crossed the $1000 mark reaching $1008 on its chart. Interestingly, the stock is only a 4 for 5’er as it has not been able to reverse up into X's on its peer RS chart. Since reaching the high mark in June, the chart moved to a sell signal (default scale) when it broke a double bottom at $980 as it fell to a low of $940. The default scale shows a lot of activity and is appropriate for aggressive traders or those looking to maintain tight stop loss points. However, for those wanting to take a longer term view if the supply and demand relationship of GOOGL we have looked to the 10 point scale. This larger scale reduces the sensitivity of the chart and we see a much more orderly chart pattern. GOOGL moved to a positive trend in July 2016 and after giving one sell signal above the bullish support line last November it has given four consecutive buy signals. Currently, this chart shows support at $940 (also seen on the default chart) and reversed back into X's to $970. This sets up a potential double bottom break at $930. Under this level, the next support is not until $830, the bullish support line.
Other Stocks with Near Term Breakdowns:
INCY Incyte Genomics, Inc. ($118.17) - Biomedics/Genetics - (0.35 weighting) This biotech stock has been trading above its bullish support line since November 2016 and reached a high on its chart at $152 in March 2017. Since that high, INCY broke a double bottom at $134 and pulled back all the way to its bullish support line. Currently, the chart has formed a spread triple bottom at $116, just above its bullish support line. This pullback from the high caused the market and peer RS charts to reverse to O's thus lowering the technical attribute score from 4 to 2. A move to $114 would mark a second consecutive sell signal while a move to $112 would violate the bullish support line leaving the stock with only 1 positive technical attribute. We would not initiate positions here and if long would watch this stock closely. If the support line is broken the next support on the chart is at $99.
Other Stocks Testing Support:
WYNN Wynn Resorts, Limited ($135.23) - Gaming - (0.21 weighting) This stock is in the gaming sector and its trend chart shows demand is clearly in control. Since the first quarter of 2016 the stock has traded sideways (clearly seen on the 4pt. scale). In 2017 it was able to break out of this base at $110 (default chart) and become a 3 for 5’er in January. Since then, the stock has given four consecutive buy signals. The most recent was with today's intraday action at $136. Along with these signals the chart created higher bottoms. This tells us supply is getting weaker and also sets up tighter stop loss points. Currently, WYNN possesses all 5 positive technical attributes and positions may be considered here. A stop loss may be implemented with a move to $118, a spread double bottom break. After that, the next support on the chart would be the bullish support line at $99.
Other Stocks Not Bothered By Volatility:
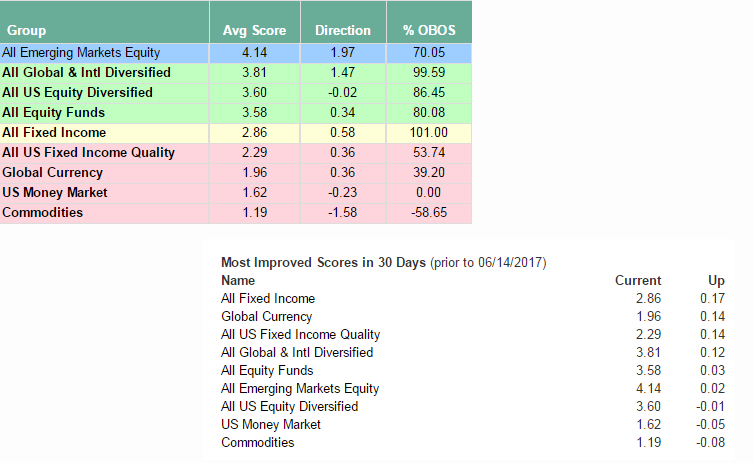
The Big Macro Landscape continue to show a score lead for International assets. On average, funds from both Emerging Market’s as well as some more Developed areas are showing stronger scores than the average equity fund of any kind, but more importantly than the US Diversified equity fund average. This alignment is now over a month old and holding. Early May was the time frame we saw these two groups (Emerging Markets and the All Global and International) take the #1 and #2 slots in this view. This makes this action very fresh, as well as very intriguing. The impact on an allocation that exposes to Non-US assets when Non-US asset are relative leaders is significant. The first part of the 2000’s was such a time-frame that you may want to go back and review. In the short term we also see some up-ticking in the relative strength of Fixed Income. On the 30 day roll, they have up-ticked the most and this silent cross current may be important to monitor as well. In any case it appears the US, Non-US and Fixed Income each have positives that you can use in your overall allocation for this summer.
If deference to “Extend” the Core Solution universe to be able to access some important parts of the International landscape, there is a need to expand the ETF universe to reach into the more stable of consistent parts that exist outside the US Core of the S&P 500 stocks. I am working on the premise of the few, the broad, and the meaningful. In the case of the International exposure, these few include basic global, core emerging markets and core developed markets. And in additional to that, a low volatility version of those cores. Though there are an enormous headcount of other funds you could use, I typically find that simple exposure from a few moving pieces works more consistently than a huge barrel of exposures flying around in an erratic cloud. If the goal is to keep risks relatively under control and keep the consistency of your score readings relatively smooth, than you should be cautious on buying individual country or regional funds. Sure, niche areas can work for you by hand or in hindsight evaluation, but concerning a computer model, your main goal should be that the evaluation system does not get overwhelmed by noise or by cross currents among a slew of asset choices. Yet still, I would like to hear your opinion on International ETFs that you have found very valuable in the thematic investing style that you use.


Investments continue to become increasingly more complicated as companies expand global reach and new alphabet soup strategies are being released that have the latest portfolio tilt. Investing in real estate is one of the longest standing investment traditions in the US and continues to be one of the most popular, because it is simple. Buy a building(s) hopefully at a fair price and hold them until you are ready to sell and collect rents along the way. No matter if it is one building or multiple, the concept stays the same. If you own Simon Property Group (SPG) one of the largest operators of malls in the US, a quick drive from our Pasadena office will take you to one of four malls they have in the area. Last weekend I had to venture to the mall for the first time in several months for a last minute gift. I along with 80 million other Americans have Amazon prime, allowing us to forgo the dreaded Saturday mall trip in exchange for the warm glow of a screen when gift shopping.
Malls and large shopping centers are feeling the effects of this change and are in a moment of flux as technology continues to shape the landscape of retail. JC Penny, Sears and Macy's have continued to announce store closures as consumers utilize large department stores less and online shopping continues to grow. A quick Google search shows numerous articles back to 2014 predicting the death of the American mall. While hundreds of malls have closed over the past decade many have continued to take steps to ensure their survival. In response to the growing vacancies mall owners are adapting and changing the landscape of the once vibrant centers of commerce and teenage angst. Large vacated space are getting new life as entertainment centers, grocery stores and fitness centers among other mixed use development.
“Sales of apparel tenants at GGP’s properties declined by 1.8% in the most recent quarter, compared with gains in electronics, food, home furnishing, health and personal care segments. Theaters, mall entertainment, supermarkets and other categories GGP counts under "miscellaneous" were among the top performers, with sales up 6.7%.”
Source: https://retail.emarketer.com/article/changing-face-of-american-malls/590ce365ebd400097ccd5f99
One of the more surprising additions has been the addition office space and medical offices. The Wall street Journal profiled a mall in Michigan that has a new tenant, Ford Motor Company.
“In April, Ford moved its entire engineering and purchasing staff into space once inhabited by department-store chain Lord & Taylor. Ford is now the mall’s largest tenant, with 240,000 square feet of space.”
As retail continues to adjust to the new norm of higher online sales and lower foot traffic to brick and mortar stores, the question for public and private REITs will be, what category do you fit in? Are malls that are introducing office space no longer classified as retail or are we entering an era of a new hybrid? If like most advisors real estate is a part of your allocations this may be a time to reexamine your holdings.
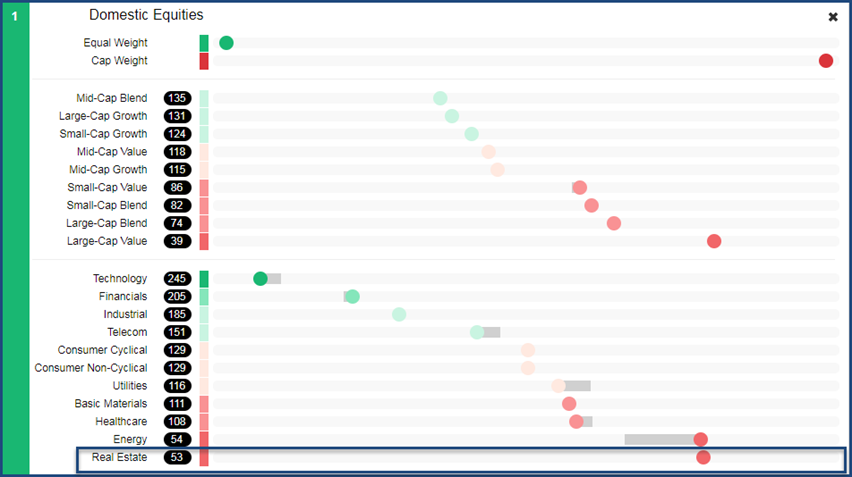
While in D.A.L.I. Domestic Equities are still in the number one position, real estate possesses the weakest relative strength compared to the other ten broad sectors.
However as changes continue to take place in the retail space we may see new life from names that have been beaten up over the past few years. Below is the RS chart for the retail REIT giant Simon Property Group SPG and the office space focused City Office REIT CIO vs the broad REIT sector (Real Estate Select Sector SPDR Fund XLRE).
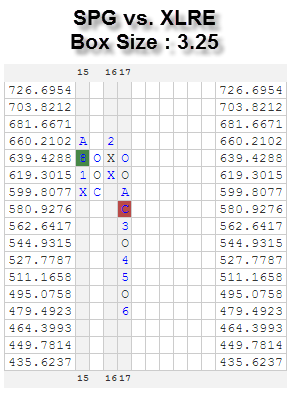
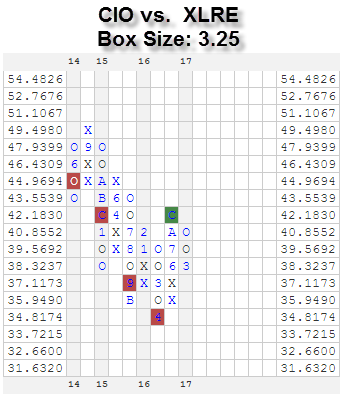
While both have had a hard time over the last couple of years, SPG continues to be on a sell signal while CIO has returned to a buy signal last December. While the chart is not particularly compelling, it shows what many investors have seen coming for the past several years, retail is in trouble.
We wrote several weeks ago about the importance of having a well-defined universe and knowing the role that each security has in the portfolio. If you still view real estate as a source of continued positive performance and healthy dividends in this low rate environment, this may be the time to do a checkup on your holdings. We looked at several real estate ETF’s including IYR, RWR and VNQ. We found that all have a significant holding in retail REIT’s. If you are concerned with exposure to retail and are looking for an ETF that does not have exposure to retail you may want to consider REZ. While in our Global Macro strategy we have the ability to own REITS, we currently do not have exposure to the asset class. We instead are looking to other US and International equities to drive the portfolio forward.
For more information on any of our SMA strategies please contact Andy Hyer, Andyh@dorseymm.com
Each investor should carefully consider the investment objectives, risks and expenses of any Exchange-Traded Fund (“ETF”) prior to investing. Before investing in an ETF investors should obtain and carefully read the relevant prospectus and documents the issuer has filed with the SEC. ETFs may result in the layering of fees as ETFs impose their own advisory and other fees. To obtain more complete information about the product the documents are publicly available for free via EDGAR on the SEC website (http://www.sec.gov) There are risks inherent in international investments, which may make such investments unsuitable for certain clients. These include, for example, economic, political, currency exchange, rate fluctuations, and limited availability of information on international securities. Past performance does not guarantee future results. In all securities trading, there is a potential for loss as well as profit. It should not be assumed that recommendations made in the future will be profitable or will equal the performance as shown. Investors should have long-term financial objectives when working with Dorsey, Wright & Associates.
The Distribution Report below places Major Market ETFs and Indices into a bell curve style table based upon their current location on their 10-week trading band. The middle of the bell curve represents areas of the market that are "normally" distributed, with the far right being 100% overbought on a weekly distribution and the far left being 100% oversold on a weekly distribution. The weekly distribution ranges are calculated at the end of each week, while the placement within that range will fluctuate during the week. In addition to information regarding the statistical distribution of these market indexes, a symbol that is in UPPER CASE indicates that the RS chart is on a Buy Signal. If the symbol is dark Green then the stock is on a Point & Figure buy signal, and if the symbol is bright Red then it is on a Point & Figure sell signal.
The average Bullish Percent reading this week is 57.35% up 0.25% from the previous week
| <--100 | -100--80 | -80--60 | -60--40 | -40--20 | -20-0 | 0-20 | 20-40 | 40-60 | 60-80 | 80-100 | 100-> | |||
 |
||||||||||||||
| Symbol | Name | Symbol | Name |
| AGG | iShares US Core Bond ETF | NASD | Nasdaq Composite |
| CL/ | Crude Oil Continuous | NDX | NASDAQ-100 Index |
| DJIA | Dow Jones Industrial Average | RSP | Guggenheim S&P 500 Equal Weight ETF |
| DVY | iShares Dow Jones Select Dividend Index | RUT | Russell 2000 Index |
| DX/Y | NYCE U.S.Dollar Index Spot | SHY | iShares Barclays 1-3 Year Tres. Bond Fund |
| EFA | iSharesMSCI EAFE Index Fund | SML | S&P 600 Small Cap Index |
| FXE | CurrencyShares Euro Trust | SPX | S & P 500 Index |
| GC/ | Gold Continuous | TLT | iShares Barclays 20+ Year Treasury Bond Fund |
| GSG | iShares S&P GSCI Commodity-Indexed Trust | UV/Y | Continuous Commodity Index |
| HYG | iShares iBoxx $ High Yield Corporate Bond ETF | VOOG | Vanguard S&P 500 Growth ETF |
| ICF | iShares Cohen & Steers Realty Index | VOOV | Vanguard S&P 500 Value ETF |
| IEF | iShares Barclays 7-10 Yr. Tres. Bond Fund | VWO | Vanguard FTSE Emerging Markets ETF |
| LQD | iShares iBoxx $ Investment Grade Corp. | XLG | Guggenheim S&P 500 Top 50 ETF |
| MID | S&P 400 MidCap Index |

| Stock | Symbol | Sector | Current Price | Action Price | Target | Stop | Notes |
|---|---|---|---|---|---|---|---|
| Synopsys Inc | SNPS | Software | $74.02 | mid 70s | 106 | 68 | 4 for 5'er, favored Software sector, R-R > 5-to-1 |
| Skyworks Solutions, Inc. | SWKS | Semiconductors | $102.28 | 104-108 | 133 | 93/87 | 5 for 5'er, leader in favored SEMI sector, pos wkly mom change, consistent higher tops and higher bottoms |
| j2 Global Communications, Inc. | JCOM | Internet | $87.22 | 85-89 | 112 | 80 | 5/5'er, Long-term market leaders, "90 to 100" opportunity in strong sector (INET). |
| Owens Corning Inc. | OC | Building | $64.73 | 62-65 | 72 (inc) | 59/55 | 3 for 5'er, leader in favored Building Sector, positive wkly and monthly mom, bullish pattern |
| Wynn Resorts, Limited | WYNN | Gaming | $134.04 | 126-134 | 193 | 118/96 | 5/5'er, Big Base Breakout, Potential Covered Write candidate (Sept 135.00 calls). |
| Zions Bancorporation | ZION | Banks | $42.87 | lo-40s | 97 | 38 | 5/5'er, PB to middle of 10-week Trading Bank, Top 15 Rank in Banks matrix. |
| Becton, Dickinson and Company | BDX | Healthcare | $191.85 | low 190's | 236 | 174 | 4 for 5'er, favored Healthcare sector, good R-R, bullish pattern |
| Corning Incorporated | GLW | Telephone | $29.39 | hi-20s | 36 | 26/24 | 5/5'er, New RS Buy signal, Return to market leadership |
| Digital Realty Trust, Inc. | DLR | Real Estate | $117.75 | 112-118 | 158 | 99 | 4 for 5'er, Favored Real Estate Sector, High Peer RS, yield 3.19% |
| Stock | Symbol | Sector | Current Price | Action Price | Target | Stop | Notes |
|---|---|---|---|---|---|---|---|
| Genesee & Wyoming Inc | GWR | Transports/Non Air | $66.94 | (mid-60s) | 51 | 72 | 0 for 5'er, bottom of unfavored Non Air Transport sector matrix, bearish R-R > 2, negative diverger. |
| Bristol-Myers Squibb Company | BMY | Drugs | $54.28 | (53-56) | 22 | 61 | 1 for 5'er, negative diverger, bearish triangle, negative weekly mom change |
| Stock | Symbol | Sector | Current Price | Action Price | Target | Stop | Notes |
|---|---|---|---|---|---|---|---|
| Manpower Inc | MAN | Business Products | $106.59 | 102-108 | 146 | 97/91 | MAN remains actionable for new money in the $102 to $108 range. Traders can continue to utilize a stop at $97 while long term investors can look at $91 as an exit point. |
| Comment |
|---|
| IR Ingersoll-Rand PLC ($92.34) - Machinery and Tools - IR was recommended as a long candidate back in February about 10 points lower. Over the last few months, IR has continued to trend higher, completing an orderly pattern of higher tops and higher bottoms. With the most recent action, IR completed its fifth consecutive buy signal with the breakout at $91. We will raise our recommended stop loss points from $74 to $81, which would violate trend on the half point chart. |
| EXP Eagle Materials, Inc. ($93.66) - Building - EXP broke a spread quintuple bottom at $93 on Friday, which is another sell signal for EXP while it trades in an overall negative trend longer-term. As a result of this break, EXP has hit our stop loss level, so we would look to sell or hedge from here. |
DLR Digital Realty Trust, Inc. ($116.61) - Real Estate - Since initially breaking out in November 2016 at $93, DLR has continued higher in a consistent bullish pattern of higher tops and higher bottoms, which is evidence of positive absolute strength. DLR is also a 4 for 5'er and has been on a RS buy signal versus the favored Real Estate sector, providing evidence of relative strength as well. This stock also has an attractive dividend yield of 3.19%, making it a candidate for income investors. DLR is actionable anywhere between $112 and $118. We will use a stop of $99, which would violate the bullish support line from here.
| 16 | 17 | ||||||||||||||||||||||||||||||||||||||||||||||||||||
| 120.00 | 6 | 120.00 | |||||||||||||||||||||||||||||||||||||||||||||||||||
| 118.00 | X | O | X | 118.00 | |||||||||||||||||||||||||||||||||||||||||||||||||
| 116.00 | 5 | O | X | 116.00 | |||||||||||||||||||||||||||||||||||||||||||||||||
| 114.00 | X | O | X | 114.00 | |||||||||||||||||||||||||||||||||||||||||||||||||
| 112.00 | X | X | O | Med | 112.00 | ||||||||||||||||||||||||||||||||||||||||||||||||
| 110.00 | 7 | O | X | 110.00 | |||||||||||||||||||||||||||||||||||||||||||||||||
| 108.00 | X | O | X | X | X | 4 | 108.00 | ||||||||||||||||||||||||||||||||||||||||||||||
| 106.00 | X | O | X | O | X | O | X | O | X | 106.00 | |||||||||||||||||||||||||||||||||||||||||||
| 104.00 | X | O | X | O | X | O | X | O | X | 104.00 | |||||||||||||||||||||||||||||||||||||||||||
| 102.00 | X | O | O | X | 2 | 3 | Bot | 102.00 | |||||||||||||||||||||||||||||||||||||||||||||
| 100.00 | X | 8 | X | 100.00 | |||||||||||||||||||||||||||||||||||||||||||||||||
| 99.00 | X | O | X | 1 | • | 99.00 | |||||||||||||||||||||||||||||||||||||||||||||||
| 98.00 | X | X | 9 | X | O | X | X | • | 98.00 | ||||||||||||||||||||||||||||||||||||||||||||
| 97.00 | X | O | X | O | X | O | X | X | X | O | X | • | 97.00 | ||||||||||||||||||||||||||||||||||||||||
| 96.00 | X | O | 6 | O | X | A | X | O | X | O | X | O | X | • | 96.00 | ||||||||||||||||||||||||||||||||||||||
| 95.00 | X | O | X | O | X | O | X | O | X | X | O | X | O | • | 95.00 | ||||||||||||||||||||||||||||||||||||||
| 94.00 | X | O | X | O | X | O | X | O | X | O | X | X | O | • | 94.00 | ||||||||||||||||||||||||||||||||||||||
| 93.00 | X | O | X | O | X | O | X | O | X | O | X | O | X | • | 93.00 | ||||||||||||||||||||||||||||||||||||||
| 92.00 | 5 | O | X | O | O | X | O | X | O | X | X | O | X | • | 92.00 | ||||||||||||||||||||||||||||||||||||||
| 91.00 | X | X | O | O | X | O | X | O | X | O | X | C | X | • | 91.00 | ||||||||||||||||||||||||||||||||||||||
| 90.00 | 4 | O | X | O | B | X | O | X | O | X | O | X | • | 90.00 | |||||||||||||||||||||||||||||||||||||||
| 89.00 | X | O | X | O | X | O | X | O | X | O | • | 89.00 | |||||||||||||||||||||||||||||||||||||||||
| 88.00 | X | O | X | O | X | O | X | O | X | • | 88.00 | ||||||||||||||||||||||||||||||||||||||||||
| 87.00 | X | O | X | O | O | X | O | • | 87.00 | ||||||||||||||||||||||||||||||||||||||||||||
| 86.00 | X | O | O | • | 86.00 | ||||||||||||||||||||||||||||||||||||||||||||||||
| 85.00 | X | • | 85.00 | ||||||||||||||||||||||||||||||||||||||||||||||||||
| 84.00 | X | • | 84.00 | ||||||||||||||||||||||||||||||||||||||||||||||||||
| 83.00 | X | • | 83.00 | ||||||||||||||||||||||||||||||||||||||||||||||||||
| 82.00 | X | X | X | X | • | 82.00 | |||||||||||||||||||||||||||||||||||||||||||||||
| 81.00 | 2 | O | X | O | X | O | X | • | 81.00 | ||||||||||||||||||||||||||||||||||||||||||||
| 80.00 | X | O | X | O | X | O | 3 | • | 80.00 | ||||||||||||||||||||||||||||||||||||||||||||
| 79.00 | X | X | O | X | O | O | X | • | 79.00 | ||||||||||||||||||||||||||||||||||||||||||||
| 78.00 | 1 | O | X | O | X | O | X | • | 78.00 | ||||||||||||||||||||||||||||||||||||||||||||
| 77.00 | X | O | X | O | O | • | 77.00 | ||||||||||||||||||||||||||||||||||||||||||||||
| 76.00 | X | O | X | • | 76.00 | ||||||||||||||||||||||||||||||||||||||||||||||||
| 75.00 | B | X | O | X | • | 75.00 | |||||||||||||||||||||||||||||||||||||||||||||||
| 74.00 | • | X | O | X | O | X | • | 74.00 | |||||||||||||||||||||||||||||||||||||||||||||
| 73.00 | • | X | O | X | O | X | • | 73.00 | |||||||||||||||||||||||||||||||||||||||||||||
| 72.00 | • | X | O | X | O | X | • | 72.00 | |||||||||||||||||||||||||||||||||||||||||||||
| 71.00 | • | X | O | X | O | X | • | 71.00 | |||||||||||||||||||||||||||||||||||||||||||||
| 70.00 | • | • | X | C | X | O | • | 70.00 | |||||||||||||||||||||||||||||||||||||||||||||
| 69.00 | X | • | 7 | • | X | O | • | 69.00 | |||||||||||||||||||||||||||||||||||||||||||||
| 68.00 | X | X | O | X | O | • | X | • | 68.00 | ||||||||||||||||||||||||||||||||||||||||||||
| 67.00 | X | O | X | X | O | X | O | 8 | • | X | • | 67.00 | |||||||||||||||||||||||||||||||||||||||||
| 66.00 | X | O | 5 | O | X | O | O | X | O | • | A | • | 66.00 | ||||||||||||||||||||||||||||||||||||||||
| 65.00 | X | 4 | X | O | X | O | X | O | X | • | X | • | 65.00 | ||||||||||||||||||||||||||||||||||||||||
| 64.00 | O | X | 6 | • | O | O | X | O | X | • | 64.00 | ||||||||||||||||||||||||||||||||||||||||||
| 63.00 | O | • | O | X | O | X | • | 63.00 | |||||||||||||||||||||||||||||||||||||||||||||
| 62.00 | • | O | 9 | X | • | 62.00 | |||||||||||||||||||||||||||||||||||||||||||||||
| 61.00 | • | O | • | 61.00 | |||||||||||||||||||||||||||||||||||||||||||||||||
| 16 | 17 |
| Comments |
|---|
| AA Alcoa Inc. ($30.05) - Metals Non Ferrous - AA broke a triple bottom at $30. The stock is still a 4 for 5'er and has further support at $29 and $27 so investors may hold here however we do not advise any new positions at this time. |
| ADS Alliance Data Systems Corporation ($252.58) - Business Products - After developing support at $236, keeping its positive trend in tact, ADS broke a double top at $252. The stock offers four positive technical attributes and ranks in the top half of the business products sector matrix. New positions may be initiated here while a move to $232 would constitute a stop loss. |
| AFG American Financial Group Inc ($102.09) - Insurance - AFG broke a double top at $102, a new all-time high. This stock is a perfect 5 for 5’er that has been trading in a positive trend since May 2009. Weekly momentum just flipped positive, suggesting the potential for further upside from here. Okay to hold here or buy on a pullback as the stock is in overbought territory here. The first sell signal from here comes with a move to $95, a double bottom sell signal. |
| AZO Autozone, Inc. ($593.65) - Autos and Parts - AZO broke a double bottom at $592 on Friday. This stock is a weak 2 for 5’er within the Autos and Parts sector that ranks 52nd out of 53 names in the sector RS matrix. Additionally, weekly momentum has been negative for four weeks, suggesting the potential for further downside from here. The bearish price objective is $564, adding to the negative technical picture. Avoid as supply is in control. The final level of support is at $576 while resistance is at $620. |
| BGS B&G Foods, Inc. ($37.63) - Food Beverages/Soap - BGS broke a double bottom at $38, which completes a bearish catapult formation following the spread triple bottom break in March at $39. The stock still offers three attributes and comes with an impressive yield of almost 5%. Traders may exit positions on this breakdown. Investors may do the same or look to $32 for further support. No new positions here. |
| CTAS Cintas Corporation ($129.88) - Textiles/Apparel - With Friday’s intraday action, CTAS broke a double top at $130. CTAS is trading well above the bullish support line and is a strong 5 for 5’er within the favored Textiles/Apparel sector. In fact, this stock ranks in the top quartile of the sector RS matrix. Okay to hold here or buy on a pullback as CTAS is slightly overbought here. The first sign of trouble comes with a move to $118, a double bottom sell signal. |
| IR Ingersoll-Rand PLC ($91.90) - Machinery and Tools - IR gave its fifth consecutive buy signal by breaking a double top at $91 and continuing higher to $92 intraday. This breakout is notable since it marks a new all-time high. The 5 for 5'er may be considered for new positions here or on a pullback. The first sign of trouble comes with a move to $86, a double bottom break. |
| PAYC Paycom Software Inc ($69.48) - Software - PAYC rallied to $69, its previous high, by breaking a double top. This breakout also completes a bullish triangle pattern. The stock ranks within the top five of the favored Software sector matrix and boasts 5 for 5'er status. In addition, it comes with a bullish price objective of $86. New positions may be initiated here. Support is offered in the mid $60's. |
| SFS Smart & Final Stores, Inc. ($9.33) - Retailing - With the most recent action, SFS broke a double bottom at $10.50 and fell further to $9.50, a new all-time low on the chart. This stock is trading in a negative trend and is an unacceptable 1 for 5’er within the unfavored Retailing sector. Weekly and monthly momentum just flipped negative, suggesting the potential for further downside from here. Avoid as supply is in control and there is no remaining support on the chart. From here, resistance lies at $13.50, the bearish resistance line. |
| TGT Target Corporation ($52.21) - Retailing - After the AMZN/WFM acquisition was announced, shares of TGT slid to a new 52 week low of $49, breaking a double bottom at $53 on the way. This stock is an unacceptable 0 for 5’er as it is trading in a negative trend and is showing significant weakness relative to both the market and its peers in the Retailing group. Supply is in control and the weight of the evidence is negative. Avoid. Note resistance at $58. |
| Name | Option Symbol | Action | Stop Loss |
|---|---|---|---|
| Digital Realty Trust, Inc. - $116.60 | O:DLR 17J110.00D20 | Buy the October 110.00 calls at 9.60 | 110.00 |
| Name | Option | Action |
|---|---|---|
| Newmont Mining Corporation ( NEM) | Jun. 33.00 Calls | Expired at 0.14 |
| Eastman Chemical Company ( EMN) | Jun. 75.00 Calls | Expired at 8.04 |
| CME Group, Inc. ( CME) | Jun. 120.00 Calls | Expired at 6.18 |
| Ingersoll-Rand PLC ( IR) | Sep. 77.50 Calls | Raise the option stop loss to 13.10 (CP: 15.10) |
| Alcoa Inc. ( AA) | Jul. 32.00 Calls | Stopped at 30.00 (CP: 29.91) |
| CSX Corporation ( CSX) | Aug. 45.00 Calls | Stopped at 8.15 (CP: 8.10) |
| Eagle Materials, Inc. ( EXP) | Oct. 97.50 Calls | Stopped at 93.00 (CP: 93.16) |
| Manpower Inc ( MAN) | Sep. 100.00 Calls | Raise the option stop loss to 7.90 (CP: 9.90) |
| Northern Trust Corporation ( NTRS) | Oct. 85.00 Calls | Raise the option stop loss to 8.80 (CP: 10.80) |
| Name | Option Symbol | Action | Stop Loss |
|---|---|---|---|
| Apache Corporation - $49.55 | O:APA 17V55.00D20 | Buy the October 55.00 puts at 7.10 | 53.00 |
| Name | Option | Action |
|---|---|---|
| Dollar Tree, Inc. (DLTR) | Aug. 82.50 Puts | Raise the option stop loss to 10.40 (CP: 12.40) |
| The Hain Celestial Group, Inc. (HAIN) | Aug. 42.00 Puts | Initiate a stock price stop of 39.00 (CP: 33.78) |
| The Hain Celestial Group, Inc. (HAIN) | Nov. 39.00 Puts | Initiate a stock price stop of 39.00 (CP: 33.78) |
| WESCO Internation, Inc. (WCC) | Oct. 65.00 Puts | Raise the option stop loss to 6.60 (CP: 8.60) |
| PriceSmart, Inc. (PSMT) | Oct. 95.00 Puts | Initiate an option stop loss of 7.80 (CP: 9.80) |
| Target Corporation (TGT) | Oct. 57.50 Puts | Initiate an option stop loss of 4.65 (CP: 6.65) |
| Name | Option Sym. | Call to Sell | Call Price | Investment for 500 Shares | Annual Called Rtn. | Annual Static Rtn. | Downside Protection |
|---|---|---|---|---|---|---|---|
| Exact Sciences Corporation $32.23 | O:EXAS 17J35.00D20 | Oct. 35.00 | 3.00 | $14,846.70 | 48.62% | 25.82% | 8.18% |
| Name | Action |
|---|---|
| Momo Inc (China) ADR (MOMO) - 36.32 | Sell the October 40.00 Calls. |
| Lumber Liquidators Holdings Inc (LL) - 24.94 | Sell the November 30.00 Calls. |
| Dish Network Corporation (DISH) - 65.28 | Sell the September 67.50 Calls. |
| MACOM Technology Solutions Holdings Inc. (MTSI) - 56.27 | Sell the November 60.00 Calls. |
| Micron Technology, Inc. (MU) - 30.56 | Sell the October 32.00 Calls. |
| Cabot Oil & Gas Corporation (COG) - 23.34 | Sell the October 25.00 Calls. |
| Weight Watchers International, Inc. (WTW) - 28.80 | Sell the October 28.00 Calls. |
| Cirrus Logic Inc (CRUS) - 62.97 | Sell the September 65.00 Calls. |
| Name | Covered Write |
|---|---|
|
|
|
Daily Equity & Market Analysis
Loading, Please Wait...
