Technology: An Epidemic or Reversion?
To borrow a literary element or two from Charles Dickens, “It was the best of years, it was the worst of days …” So it has been for the US Technology sector, the largest and most widely-held of which have far surpassed the returns of the broader market for many weeks, months and years. That, however, is not always a vaccine for the “Terrible, horrible, no good, very bad days” that impact every sector at one point or another. The two sessions that followed June 8th (last Thursday) were such an example for the US Tech sector, which absorbed a fundamental downgrade for Apple Inc. AAPL that quickly became a systemic event for the broad group. The Nasdaq Composite NASD posted its largest 2-day decline of 2017, falling 2.3% while the Nasdaq 100 Index NDX fell a bit more (3.0%) as the largest Tech stocks led the decline … just as they have the longer-term rally.

The 15 largest Technology stocks (by market cap) had, on average, tripled the return of the average S&P 500 stock this year thru last Thursday (6/8). Only two were in negative territory for the year at that point, and most were up more than 20%. But this was not just a 2017 anomaly as these stocks have tripled the return of the S&P Equal-Weighted Index SPXEWI over the past 3 years as well. However, the period following June 8th provided a dose of mean reversion as these same stocks lagged the market by more than 3.5%, on average, in just two days. Amidst these two volatile sessions for the Tech sector, Amazon AMZN fell nearly 90 points peak-to-trough and Priceline PCLN fell over 100 points. While those drawdowns still don’t reach 10% of the share price for the respective stock, it is still the type of move that rattles the nerves of investors. Dispassionately, however, many of these stocks were overdue for an exhale and the sector closed last Thursday very clearly overbought statistically. The two soft days for Technology resulted in a very different distribution for this sector, but one that we might call far more “normal.”
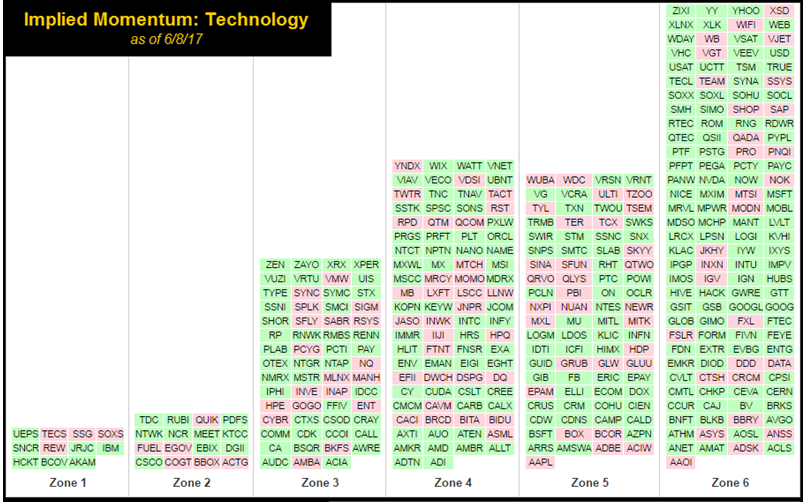
One way to gauge the overbought nature of Technology and how the current view appears to be more "normal" is via the Implied Momentum tool (found on your Dashboard via the Links of Interest widget). This tool was built around the "Zone Concept," developed and pioneered by the late Jim Yates. Jim used this as an options strategy by organizing the market into “zones” by placing each stock (by symbol) on a big bell curve upon where they resided on their individual distribution (shown below) in order to display a visual of the “market.” All six zones are equal in size to one another where the middle would be normally distributed data. Data skewed to the right would be overbought (Zones 5 and 6), and to the left oversold (Zones 1 and 2). We will borrow this tool for today to simply obtain a view of the overbought/oversold nature of the S&P 100 Index OEX versus the Technology sector on Thursday June 8th and Monday June 12th.

Based on the charts above and below, we gathered the following observations:
- The OEX was essentially “normally distributed” on both days (6/8 and 6/12)
- Technology was skewed to the right on 6/8 suggesting it was more overbought in Zones 5 and 6
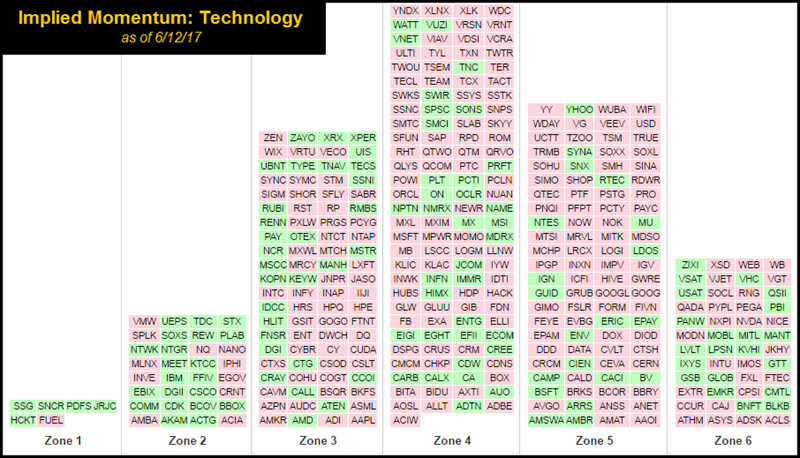
- On 6/12 Technology began to look more “normally distributed” with more names in Zone 4 than Zone 6 just two trading days prior
- The bell curve between Technology and the OEX look similar on 6/12 as both appear to be more “normally distributed”
- This view, in addition to the performance table we showed initially, presents a “reversion to mean” picture for Technology
This pullback is essentially creating an actionable opportunity within an overall longer term positive trend for Technology as a sector. The relative strength is still positive as seen on the DALI page, with Technology continuing to claim the number one spot with 245 buy signals. In addition, we can see the average score for Technology on the Asset Class Group Scores page is a staggering 5.17 out of a possible 6. One way we are able to find ideas within this space on an ETF front is to turn to the Technology Sector ETF Matrix (found under the Premade Matrices). Below we have provided the rankings of roughly the top half (15 out of a universe of 29).

The rankings here provide additional flavor to the story. The average score of these 15 funds is 5.68, which speaks highly of the funds' trend and relative strength metrics. In addition, we can see there are various types of Technology exposure at the top ranging from sub-sectors like Semiconductors, Nasdaq 100 Technology stocks, broad Technology exposure, Equal Weight, etc. That being said, let’s take a look at a few funds that stood out as actionable ideas. Each offer a different approach in their exposure.
Broad Exposure:
FXL First Trust Technology AlphaDEX Fund ($44.38) - Computers – FXL seeks to own the top 75% of Technology stocks within the Russell 1000 Index after ranking them based upon fundamental growth and value factors. The stocks are divided into quintiles where the higher ranked quintiles receive a higher weighting and the overall portfolio is rebalanced and reconstituted on a quarterly basis. That being said, notice how none of the “FANG” stocks in addition to the likes of Apple, Intel, Microsoft, IBM, etc. made their way into the top ten holdings unlike many other sector based funds. On a technical level, FXL offers a fund score of 5.61, which tops all of its benchmarks. Looking to its trend chart we can see the fund pulled back with yesterday’s action (6/12) to $43.50, which is one box above support from May this year. The fund has given six consecutive buy signals and is now just 36% overbought (compared to 102.06% last week). Those interested in gaining exposure may initiate positions at current levels. The first sign of trouble comes with a move to $42.50, a double bottom break.

Sub-Sector (Semiconductors):
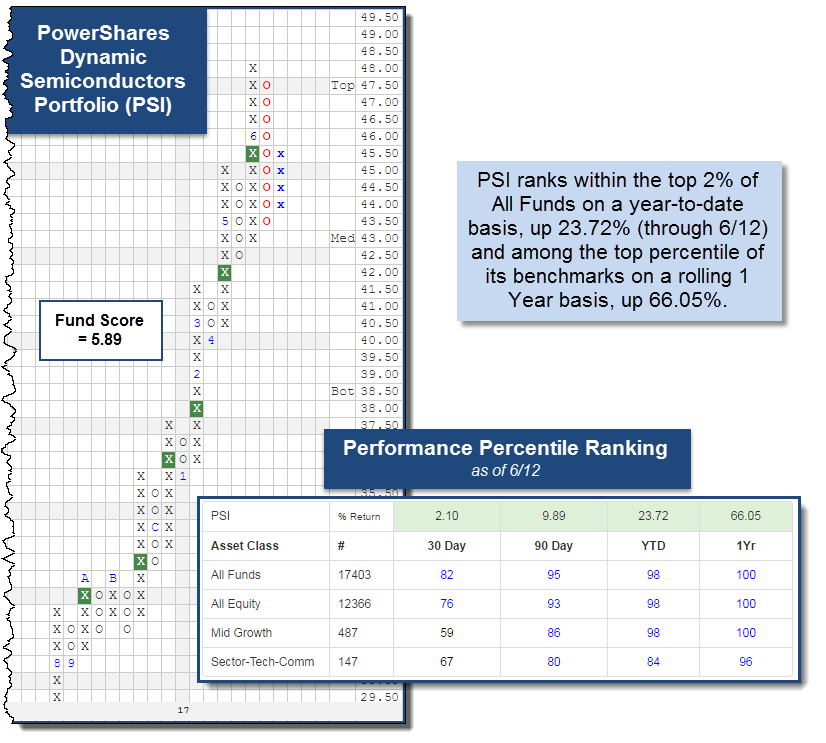
PSI PowerShares Dynamic Semiconductors Portfolio ($44.73) - Semiconductors – PSI boasts a fund score of 5.89, which is nearly 2.50 points higher than the average All US fund. The fund has given nine consecutive buy signals over the course of the past fifteen months and displayed a pattern of higher tops and bottoms for the better part of eight. We can see PSI was able to make a higher bottom at $43.50 yesterday and reversed back up into X’s today at $45.50. Semiconductors has been the strongest sub-sector within broad Technology based on the DWA Group Matrix rankings. This positive relative strength has helped PSI rank among the top 2% of all funds on a year-to-date basis, up 23.72% (through 6/12) and among the top percentile of its benchmarks on a rolling one year basis, up 66.05%. Those interested in gaining exposure to PSI may initiate at current levels and look to support between $42.50 and $43.50 moving forward. For those already long be aware of resistance at the $48 level, the fund’s previous high.
Small-Cap:
PSCT PowerShares S&P SmallCap Information Technology ETF ($75.57) - Computers – Small Caps have struggled this year, not that their performance has been negative, it has just lagged the broader Large Cap market. However, more recently we have seen some Small Cap funds rally to new highs. PSCT was able to rally to new highs as well this month at $78. When looking to the chart of PSCT, it makes it difficult to gripe with. Since developing support in February 2016 in the mid $40’s, the fund has been able to almost double its price in just sixteen months. With yesterday’s action it reversed down into a column of O’s similar to other Technology based securities. This pullback falls back near the last prior level of resistance from February 2017 in the mid $70’s. While not perfect, its weekly momentum has been a nice indicator to follow the performance of PSCT so far this year. It was relatively flat during its stint in negative territory from February 24th to May 5th this year, but since flipping positive at the beginning of May through present, PSCT has been able to post a gain of 2.68% compared to the S&P 500 Index SPX, up 1.25%. Those interested in gaining exposure to Small Cap Technology may consider the 5.47 scoring PSCT at current levels. From here, support comes at the $70 and $66 levels.

NASDAQ 100:
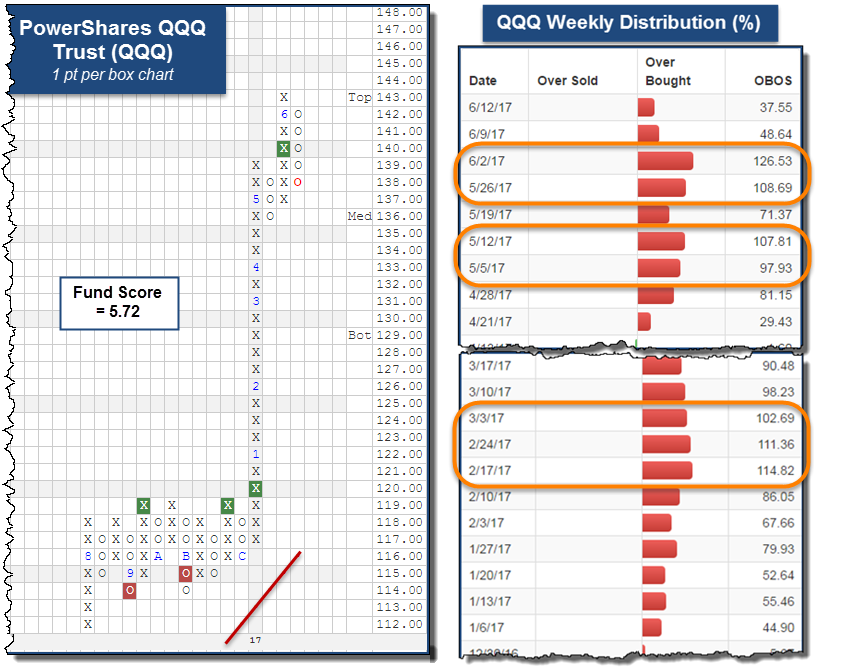
QQQ PowerShares QQQ Trust ($139.86) - QQQ has been one of the best performing index based funds on a year-to-date basis having more than doubled the performance of the S&P 500 Index SPX, up 17.51% compared to 8.51% through 6/12. The index it tracks, the NASDAQ 100 Index NDX, has benefited from having exposure to large cap stocks in addition to the fund offering nearly a 60% weighting to Technology (as of 6/12). QQQ offers a solid score of 5.72, which speaks positively to its positive trend and relative strength characteristics. By looking at the one point per box chart, we can see the Q’s reversed down into a column of O’s to the upper $130’s and is close to reversing back up into X’s at $141. The overbought nature of the fund comes with precedence when it has moved to new highs this year. It was able to make new highs with the rest of the market in March where it was more than 100% overbought. Similarly, it bettered those levels in May and June where it also surpassed being 100% overbought. The most recent volatility has brought the fund’s weekly distribution down from a high of +126% in June to just +37%. This pullback has not upset the technical picture of the fund, as it remains on a buy signal, but creates an actionable opportunity. Those interested in gaining exposure to the Q’s may do so at current levels. From here, resistance lies at $143 and further support may be created at $138 (if the fund is able to reverse up on the 1 pt. chart) in addition to existing support from May at $136.