A look into the Bullish Percent, Positive Trend, and Volatility indicators and what they mean for the NASDAQ 100 Index (NDX).
Join us Friday, June 16th at 2:00 pm ET for a live webinar exclusively for new or beginner DWA Platform users. The webinar will cover different aspects of the research as well as provide new users with the opportunity to ask questions. Click here to access the registration link. The password is pnfpnf. Registration is required.
Listen to DWA’s Tom Dorsey and John Lewis on Wednesday (6/21) at 1:00 pm EDT as they join the AdvisorShares Alpha All-Star Summit featuring other top ETF managers from Wilshire Funds Management and Newfleet Asset Management. It will be an interactive presentation that provides an all-access pass to better understand the right questions to ask when hiring an active manager, learn what potential red flags to recognize, and how to evaluate the best choices possible for your clients. Click here to register and to add it to your schedule!

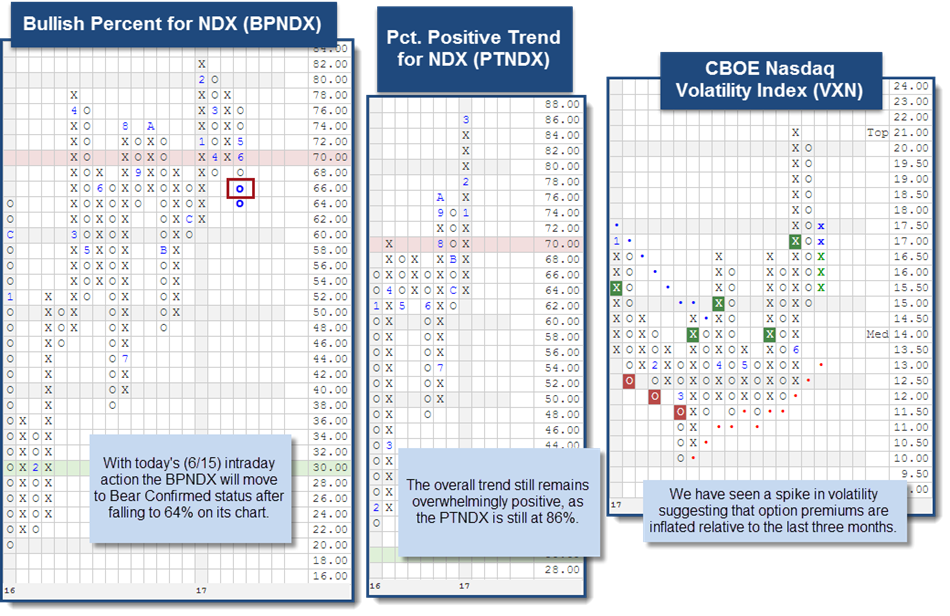
With today’s intraday action (6/15) the Bullish Percent for the NDX BPNDX will fall to 64% on its chart. This is notable because it moves the chart into Bear Confirmed status. The percent of stocks within the NDX that are on a Point and Figure buy signal is narrowing. Those with Technology exposure may want to review your positions and establish where support is located. You may need to lower the scale in order to obtain a suitable visual in some cases. Despite the BPNDX breaking down, the overall trend for Technology is still overwhelmingly positive. We are able to see this via the Percent Positive Trend for NDX PTNDX, as it measures the percent of stocks within the NDX that are trading above their bullish support lines. As you can see in the chart below, this figure is at 86%. Lastly, we have noticed increased volatility within the NDX by looking at the CBOE Nasdaq Volatility Index VXN. The added volatility is evidence of the recent tremors for the Technology sector, which implies option premiums have been inflated relative to the past three months. Overall, the Technology sector remains number one in our DALI Tool, more than half of the stocks within the NDX are still on a PnF buy signal, and 86% of those 100 stocks are trading in a positive trend. Our takeaways from these observations are to review your positions and identify support levels in case supply gets stronger from here. The chart of the NDX itself sits against support at 5640 with further support coming at 5580.