
International Paper
International markets have long been used by US investors to differentiate portfolio return streams, and buffer domestic volatility through diversification. Historically emerging markets have been less correlated to the US and international developed markets with the expectation of accelerated returns over global developed markets.
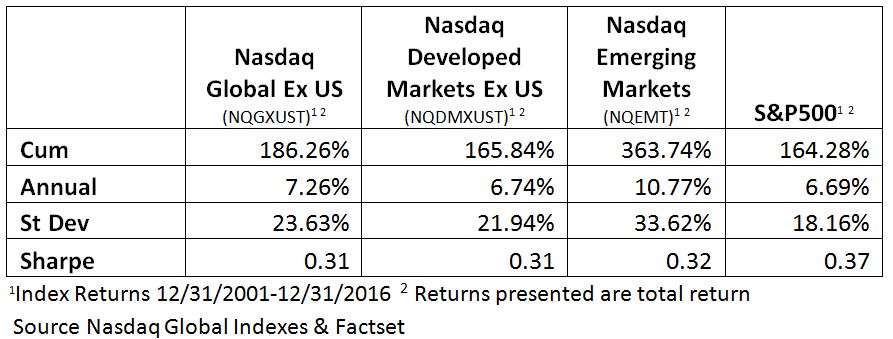
Over the past 15 years, global markets, as measured by the Nasdaq Global ex-US Index, have outperformed the US markets, as represented by the S&P 500 Index, on a total return basis. Emerging markets, as measured by the Nasdaq Emerging Markets Index, have more than doubled the return of the S&P 500, while the Nasdaq International Developed Index and the Global Ex US Index have generated returns slightly higher than the US. None of the international markets have had a higher risk adjusted return than the US over the time period, however. This is often one reason that people underweight international markets; they do not have the risk appetite for the higher volatility without outsized returns. For example, while emerging markets doubles the return of the S&P 500, it also increases the volatility by 85%.
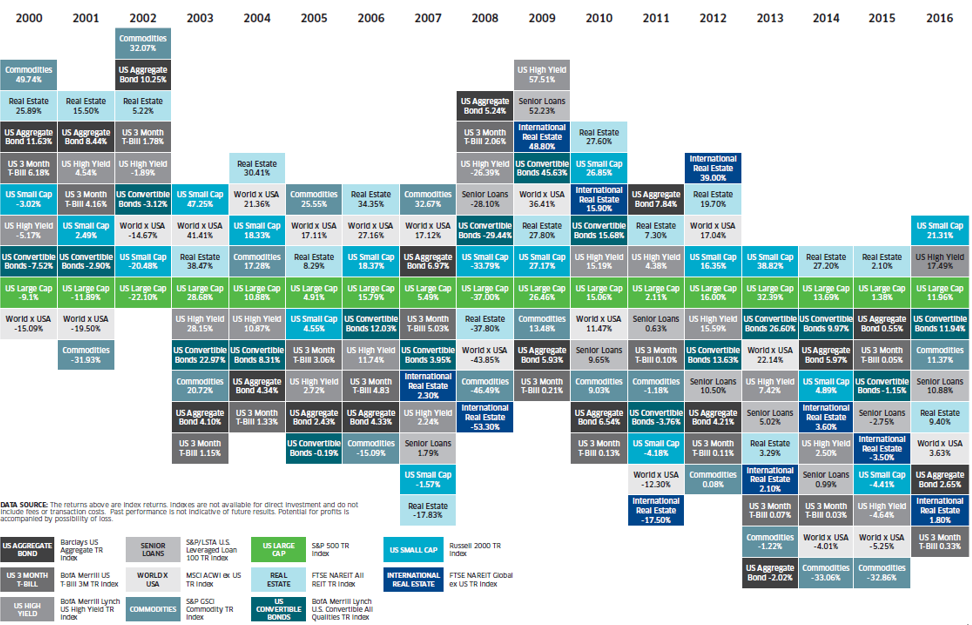
Increasingly investors are turning to low cost, passive ETFs to gain market exposure, allowing advisors to manage a macro portfolio rather than individual company names, as has been popular in the past. Diversified portfolios are prudent, and have been known to work well over longer cycles, however, they have an element of statement risk associated with them, as one asset class dominates multi-year stretches or underperforms the rest of the market. International markets have had this problem over the past three years, as US equities have dominated the majority of other asset classes.
While broad passive beta may be the current preferred investment vehicle, not all investable markets are created equal. The problem with allocating to broad indexes in global markets is the excess exposure to troubled countries and sectors. The majority of popular indexes are cap weighted, so as the portfolio is rebalanced, the index increases exposure to expensive, more developed countries, while underweighting smaller markets. Equal weighted versions of many indexes are also available, but cap weighted indexes continue to be the industry preference.
The indexes are constructed to get a broad market exposure, often holding countries that are in political or economic turmoil to meet the construction requirements, and these negatively performing markets have a drag on the performance of the index. During the 1980’s, the Japanese markets continued to climb to new heights, and as a result by 1987 Japan had an almost 40% allocation within the MSCI ACWI Ex US Indexi. This was positive for the Index, as the markets continue to trend upward. However, during the correction a few years later, Japan traded down over 70% and was a large negative position in the Index. Such an example illustrates the importance of country selection wherein countries that are underperforming or experiencing turmoil can be reduced or eliminated from the portfolio. A tactically managed portfolio can rotate away from a country experiencing underperformance, allowing it to reduce the negative exposure.
John Lewis, Senior Portfolio Manager at Nasdaq Dorsey Wright, has written several papers on relative strength and rotation models over the past 10 years that we were able to utilize as the basis for this study. We applied the same methodology used within his 2014 paper, “Sector Rotation with Point & Figure Matrices” that successfully implemented sector rotation models, and we applied it to countries; allowing us to own the countries with the highest relative strength characteristics.
Our model uses a ranking based on Point and Figure (PnF) relative strength to determine which securities have the best momentum. A PnF chart produces a series of columns across the page. A column of X’s indicates the security is performing better than the benchmark, so the ratio line is moving up. A column of O’s indicates the security is underperforming the benchmark, and the ratio line is falling. As columns move across the chart, a series of columns that consist of either X’s or O’s appear in an alternating fashion. When the top of a current column of X’s exceeds the top of the previous column of X’s it is considered a buy signal (see figure 1). When the current column of O’s exceeds the low of the pervious column of O’s that is considered a sell signal. In the most basic interpretation, a Point and Figure relative strength chart has four states:
- On a buy signal and in a column of X’s
- On a buy signal in a column of O’s
- On a sell signal in a column of X’s
- On a sell signal in a column of O’s
The Point and Figure column and signal give insight into the intermediate and long-term direction of momentum, respectively. Securities with the best relative strength pattern are those on a buy signal and in a column of X’s, while securities on a sell signal and in a column of O’s are securities investors would want to avoid.
We applied the model to developed markets (DM), emerging markets (EM) and a combined Global ex US portfolio (GXUS). For each universe we constructed a PnF matrix ranking the underlying countries versus each other. We used the Nasdaq classification of Emerging and Developed markets for the model construction. MSCI has the same country classification while the only change that FTSE makes is moving Korea from an emerging to developed country. The models held the top five holdings in the Developed (DM5) and Emerging (EM5) markets. The global portfolio (Global10) expanded the number of holdings to ten holdings to better capture the expanded country universe.
We found that by actively selecting countries based on their relative strength versus the rest of the index constituents, we are able to increase the total return and risk adjusted return versus the original index.
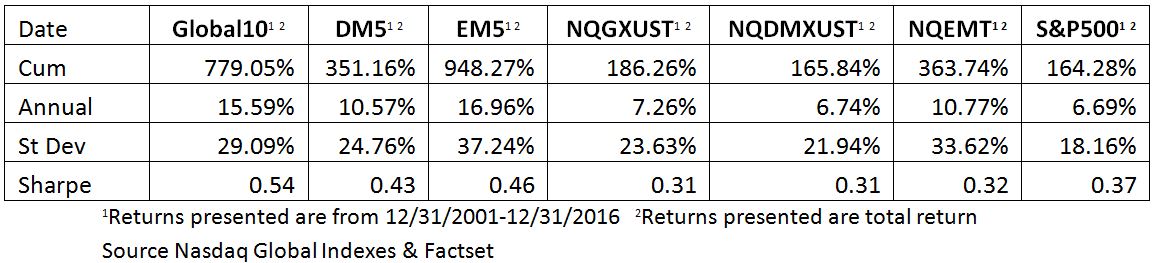
The table above shows that implementing country selection increases the returns of the index by 200%-400%, while only marginally increasing the volatility of the portfolio. Similar to the passive indexes, EM5 had the highest total return in the group over the 15 year time frame, but also with the highest level of volatility. In all of the models, the risk adjusted return was increased by more than 30% handily beating the index, as well as the US markets, as measured by the S&P 500 Index.
The Global10 model has a lower total return than the EM5 model but also had a notably better risk adjusted return. The Global10 portfolio is the best risk adjusted return out of the model portfolios and the comparable indexes including the S&P 500 Index. Unlike a traditional cap weighted Global ex US portfolio, the Global10 model has the ability to adjust, unconstrained, to areas of strength in both emerging and developed markets. During the testing period we found that the Global10 preferred EM to DM during most periods, at times allocating 100% of the portfolio to emerging markets.

*The graph above is based on a strategy back-test that utilizes uninvestable indexes. Please see the disclosures for important information regarding back-testing.
Removing the model’s allocation restraints allows it to find the highest strength countries indiscriminate of human emotion. The excess exposure to EM did not dramatically affect the volatility; however, it did increase the risk adjusted and total return. This is also true of developed markets at times when they may not be the ideal investable universe, such as Japan in the 1990s, Greece in 2014-2015, or Western Europe in 2016. In 2016, the back tested model had a low allocation to European countries during Brexit concerns, and was underweight emerging markets from 2013 to 2015 when emerging markets significantly underperformed developed markets.
In the relative strength Point and Figure chart below, we see that emerging markets and developed markets both have periods of strength and weakness.

Emerging markets, in this example, outperformed developed markets during the last 15 years, however developed markets did have periods of strength, most notably during 2008, and 2012-2014.
Exposure to international markets often comes at the price of higher volatility and periods of underperformance versus US markets. The enhanced return capabilities and portfolio diversification, however, are important considerations to keep in mind in portfolio construction. Through the use of tactical country selection, returns can be increased over a traditional broad index and volatility can be managed effectively to increase the risk adjusted return.
Allocating based on individual country exposure is more calculated than investing in a large market cap index. You can continue to drill down further into each country to make country specific sector bets; however, this can prove difficult in less liquid markets and requires a much larger trading department to trade on each local exchange. Exposure to individual countries is available on US exchanges through the use of ETFs and American Depository Receipts (ADRs). Exposure to the majority of the countries in developed and emerging markets can be garnered through investment in ETFs, some of which allow for broad exposure, while others implement a specific factor tilt.
Dorsey, Wright & Associates, LLC, a Nasdaq Company, is a registered investment advisory firm.
The relative strength strategy is NOT a guarantee. There may be times where all investments and strategies are unfavorable and depreciate in value.
Each investor should carefully consider the investment objectives, risks and expenses of any Exchange-Traded Fund (“ETF”) prior to investing. Before investing in an ETF investors should obtain and carefully read the relevant prospectus and documents the issuer has filed with the SEC. ETFs may result in the layering of fees as ETFs impose their own advisory and other fees.
There are risks inherent in international investments, which may make such investments unsuitable for certain clients. These include, for example, economic, political, currency exchange, rate fluctuations, and limited availability of information on international securities.
Back-tested performance is hypothetical and is provided for informational purposes to illustrate the effects of the strategy during a specific period. The hypothetical returns have been developed and tested by DWA, but have not been verified by any third party and are unaudited. Back-testing performance differs from actual performance because it is achieved through retroactive application of a model investment methodology designed with the benefit of hindsight. Model performance data (both back tested and live) does not represent the impact of material economic and market factors might have on an investment advisor’s decision making process if the advisor were actually managing client money.
Past performance does not guarantee future results. In all securities trading, there is a potential for loss as well as profit. It should not be assumed that recommendations made in the future will be profitable or will equal the performance as shown. Investors should have long-term financial objectives when working with Dorsey, Wright & Associates.
Investors cannot invest directly in an Index.
