
A breakdown of QQQ
Over the course of the past week, we have been talking about the tremors surrounding the broad Technology sector. The Were You Aware...? from yesterday (6/15) discussed what is occurring on an indicator level (Bullish Percents, Positive Trends, Volatility). In addition, the ETF Spotlight from Tuesday (6/13) discussed whether recent events have been an epidemic or a reversion by looking into performance, bell curves, and addressing the technical picture of various Technology based ETFs. Today we will expand on these topics by providing an overview of the PowerShares QQQ Trust QQQ and pop the hood (or bonnet for our British friends) by analyzing correlation, drawdowns, and eight stocks which all present varied technical pictures. These pieces offer additional color and a chance for us to elaborate and evaluate the trading action experienced within the index over the past week.
QQQ Overview:
For those that may be unfamiliar, the PowerShares QQQ Trust QQQ seeks excess return by tracking the Nasdaq 100 Index NDX, which owns roughly 100 of the largest domestic and international non-financial companies listed on the Nasdaq stock market based upon market capitalization. The fund is then rebalanced and reconstituted each year. It may be no surprise that QQQ is tech heavy, offering roughly 60% exposure across both the top 10 holdings and the entire portfolio. Not only is the fund overweight Technology, but also to Large Cap Growth. Those that have attended our broker institutes, roadshows, or been avid readers of our Daily Equity Report will be familiar with our research supporting the benefits of overweighting this style box and understand the frustrations of being underweight over the past five years. You can view one report on this topic from our Money Managers by clicking here. This one, two punch combination has helped the Q's outpace the market by more than double thus far in 2017 (through 6/15) in addition to outperforming the market on a 1, 3, and 5 year annualized basis as shown below. Thanks to these facts, the Q's rank within the 93rd percentile of all funds year-to-date, up 17.43% and the 96th percentile on a rolling one year basis, up 29.16%. Its impressive fund score, 5.76, speaks positively to its trending and relative strength metrics. It also handily takes care of its benchmarks' average scores: Domestic Growth (3.89), All US (3.51), and Large Cap Growth (3.87). QQQ's fund score has also not seen a level below 3.0 since 2009. The default trend chart shows a notable breakout in August 2016 at $116, breaking a spread triple top and taking out resistance dating back to July 2015. The fund has been able to better those highs over the past ten months, currently trading in the $140's. The chart pattern has made it difficult to find entry points and establish support since it has been in a column of X's since July last year which some refer to as a "flagpole" or "stem." However, if we look at the 1 point per box chart, we are able to locate a more recent breakout in December 2016 at $120, a spread quadruple top break. QQQ was able to make a higher bottom in May at $136, which can be used as support. With last week's trading action, the fund pulled back to the $138 level, which may be used to initiate new positions. The first sign of trouble comes with a move to $135, a double bottom break.

It’s important to remember that the Nasdaq 100 Index NDX and the S&P 500 SPX are different in their exposure styles which is why you’ll see different return patterns between the two over time. As you saw in the image above, the Nasdaq 100 is essentially a Technology (58%) and Consumer Cyclical (22%) index with a little Healthcare and Consumer Staples mixed in as well. The S&P 500 on the other hand is 23% Technology, then spread out among Financials (14%), Healthcare (14%), and Consumer Cyclical (12%). Industrials and Consumer Staples also account for 10% and 9%, respectively. The difference in sector exposure explains much of why the returns will vary and also explains why the Nasdaq 100 experienced a more volatile week than the S&P 500 (See: correction in Growth and Technology).
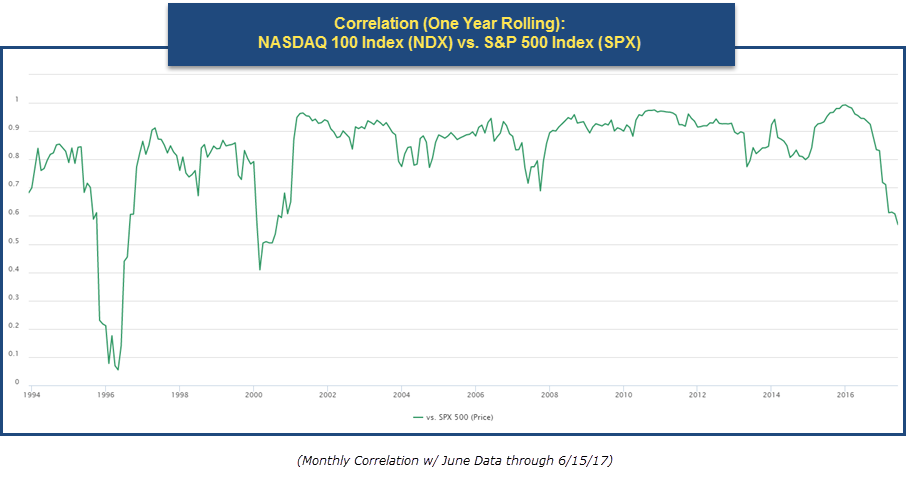
In addition to differences in sector exposure, one can see how there has been divergence between the two from a correlation standpoint, as the correlation between the Nasdaq 100 and the S&P 500 has been weaker in recent months. Correlation is a statistical measurement that describes the relationship between two variables (in this case, Nasdaq 100 vs. S&P 500). A correlation reading of 0.0 means there is no stable relationship, which in our case means that the two indices move independently of one another. A correlation of -1.0 (perfectly negative) suggests the indices move opposite of each other. Conversely, a correlation of +1.0 (perfectly positive) suggests the two investments move in the same direction at the same time.
In the graph below, we have plotted the trailing 12-month correlation of the Nasdaq 100 versus the S&P 500. There have been times when the two indexes were highly correlated and times then they were extremely uncorrelated. After a stretch between 2001 and 2016 when the correlation between the two was fairly high (ranging between 0.9 to 1), the relationship between the two indexes has become weaker here recently. Notice how the correlation has just fallen down below 0.60; the lowest reading since right after the Tech Crash in the early 2000’s. The fall in correlation is an indication the Nasdaq 100 and the S&P 500 are beginning to move more independently from each other, which probably doesn’t come as a surprise after the recent trading action that has transpired over the past couple of weeks and the excess returns we have witnessed.
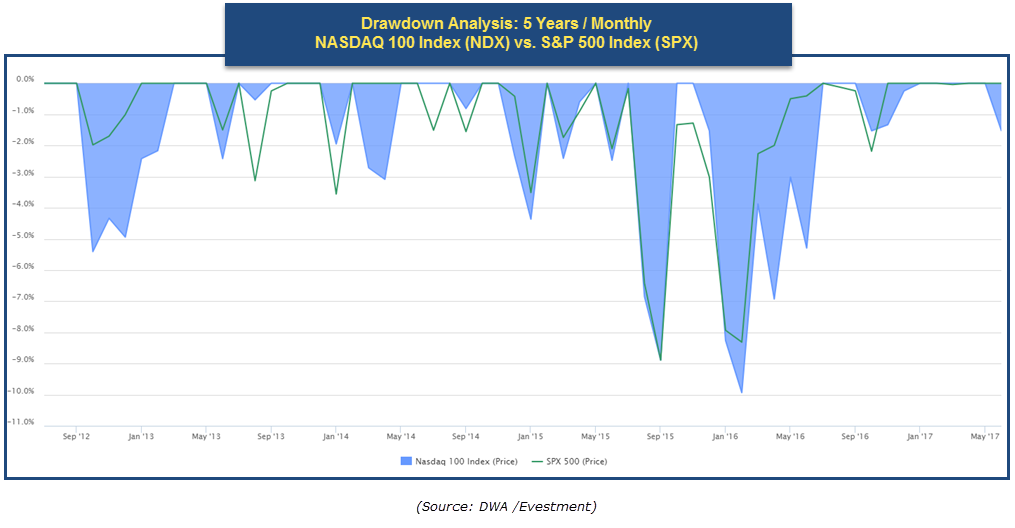
Through the first half of June, the NDX has fallen -1.53% while the average Nasdaq-100 stock fell -1.13%. While not a severe “correction,” it appears worse on a relative basis, as the S&P 500 is up 0.86% and the S&P 500 Equal Weighted Index SPXEWI is up 1.26% over that same time period. What’s interesting about the recent dip in the Nasdaq 100 is that this is the first time since June 2016 since the Nasdaq 100 is down for the month while the S&P 500 is up. However, we still have the second half of June to see if this 12-month record is broken. Going back over the last five years, one can see that the recent volatility in the Nasdaq 100 is roughly equivalent to that of August – September 2016 dip. We have yet to see anything like the early 2016 drawdown (nearly -10%) though. For now, we’ll continue to monitor the developments taking place on the chart of the Q's as well as its 100 plus constituents, some of which we have spotlighted below.
Stock Spotlights:
Now we will dive into the technical pictures of a few stocks and provide a list of stocks that look similar to the examples listed below. These ideas were chosen by the analysts after scrolling through the thumbnail charts and do not result from any queries.
| Symbol | Name | Price | Tech Attrib | Broad Sector | Overbought/Oversold | Yield | YTD Performance | Reason For Inclusion | ||
| AAPL | Apple Inc. | 144.29 | 4 |
Technology |
|
1.75 | 24.581 | Stem/Pullback | ||
| AVGO | Broadcom Ltd | 237.99 | 5 |
Technology |
|
1.71 | 34.633 | Constructive Pullback Close To Support, Lower OBOS | ||
| CTXS | Citrix Systems, Inc. | 79.26 | 4 |
Technology |
|
0.00 | 11.451 | Shakeout Pattern Initiated | ||
| DISCK | Discovery Communications Inc. 'C' | 25.52 | 0 |
Consumer Cyclical |
|
0.00 | -4.705 | Weak Before the Correction Last Week | ||
| DLTR | Dollar Tree, Inc. | 72.73 | 2 |
Consumer Cyclical |
|
0.00 | -5.766 | Deteriorated With Last Week's Action | ||
| GOOGL | Alphabet Inc. Class A | 960.18 | 4 |
Technology |
|
0.00 | 21.166 | Near-Term Breakdown, Long-Term Picture Positive | ||
| INCY | Incyte Genomics, Inc. | 120.37 | 2 |
Healthcare |
|
0.00 | 20.046 | Testing Important Support | ||
| WYNN | Wynn Resorts, Limited | 134.04 | 5 |
Consumer Cyclical |
|
1.49 | 54.942 | Not Bothered by Recent Volatility |
Apple. Inc. AAPL
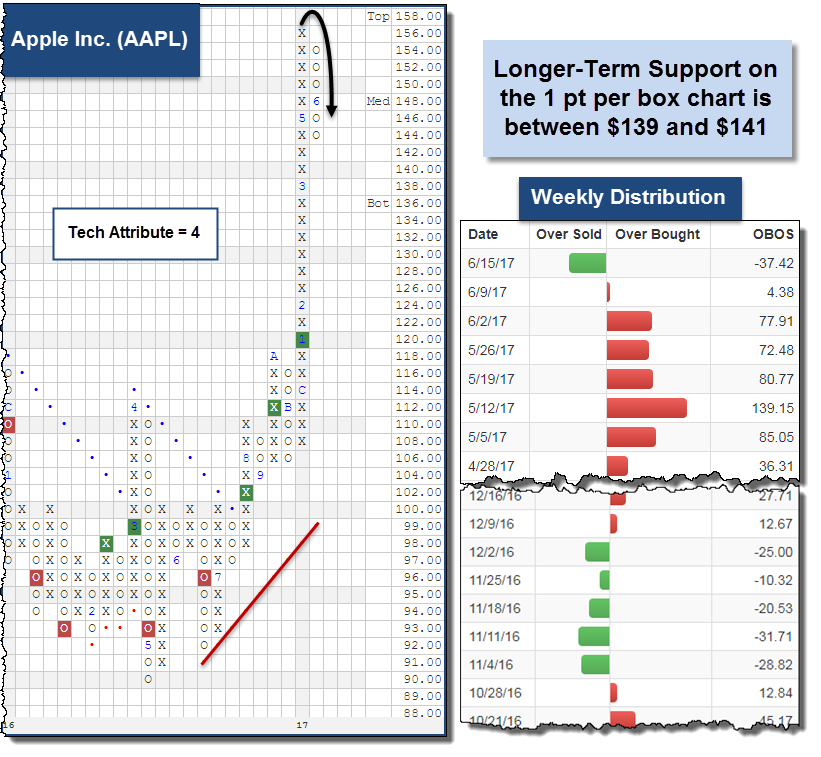
AAPL Apple Inc. ($143.90) - Computers - (11.52 weighting) AAPL is a 4 for 5’er ranking in the top quartile of the favored Computers sector matrix. Looking to its trend chart, we can see it was trading up on a stem before last week’s volatility. It has since pulled back to $144 and is -37% oversold. This is the first oversold reading we have seen for AAPL since November 2016. The stock remains on a buy signal and trading well above its bullish support line. Looking to its one point per box chart, we can see the stock is resting against support at $143 and has further support between $139 and $141. Those long may continue to hold. From here, a move to $148 would put the stock back on a Point and Figure buy signal.
Other Stem & Pullback Examples:
- Applied Materials, Inc. AMAT
- Cerner Corporation CERN
- Checkpoint Software Technologies Ltd. (Israel) ADR CHKP
- Cisco Systems, Inc. CSCO
- JD.COM Inc. JD
- Marriott International, Inc. MAR
- Microsoft, Inc. MSFT
- Maxim Integrated Products Inc. MXIM
- PayPal Holdings, Inc. PYPL
- Symantec Corporation SYMC
Broadcom Ltd AVGO
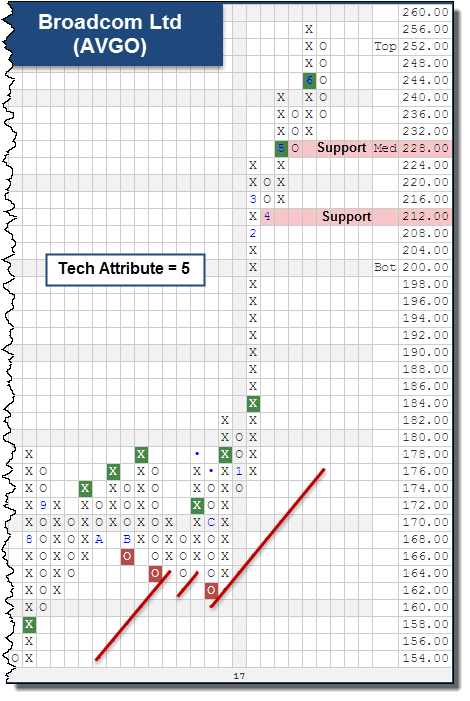
AVGO Broadcom Ltd ($237.92) - Semiconductors - (1.45 weighting) AVGO qualifies as one of our “constructive pullbacks.” The stock had broken four consecutive double tops while forming a pattern of higher tops and bottoms. AVGO then traded above the top of its 10-week trading band at +115% overbought in early June. It has since pulled back to $236 since that high of $256. The 5 for 5’er which ranks in the top half of the favored Semiconductors sector matrix may be considered for new entries on this pullback as it lowers your cost basis and puts you closer to support at $228 and $212 from here.
Other Constructive Pullbacks:
- Electronic Arts EA
- Facebook Inc. FB
- Hologic Incorporated HOLX
- Liberty Ventures LVNTA
- Netease.com Inc. (China) ADR NTES
- Skyworks Solutions, Inc. SWKS
- Tesla Inc. TSLA
- Texas Instruments TXN
- Ulta Salon, Cosmetics & Fragrances, Inc. ULTA
- Vertex Pharmaceuticals VRTX
- Xilinx, Inc. XLNX
* Two charts are in the process of forming triangle patterns: Intuitive Surgical, Inc. ISRG and NVIDIA Corporation NVDA. Add these to your watch list and see if they are able to become bullish triangles ($920 and $156 respectively) or if they flip negative and become bearish triangles ($892 and $146).
Citrix Systems, Inc. CTXS
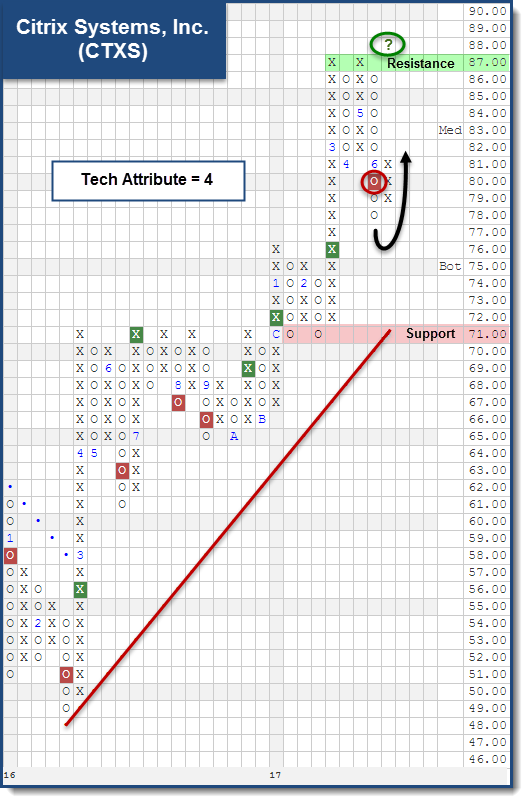
CTXS Citrix Systems, Inc. ($79.24) - Software - (0.19 weighting) After forming a double top at $87, but not breaking it, CTXS broke a double bottom at $80 and fell further to $78. This set up a potential shakeout pattern. The shakeout is a bullish pattern designed to eliminate the weaker holders of the stock. The pattern is initiated upon a reversal into X’s and completed upon a potential triple top break. The shakeout for CTXS has been initiated after reversing up into X’s at $81, but will not be completed unless it moves to $88, a new high. The 4 for 5’er may be considered for new entry on this reversal up or upon a potential triple top break. From here, support is at $78 and in the lower $70’s.
Other Shakeouts or Potential Shakeouts:
Discovery Communications Inc. 'C' DISCK
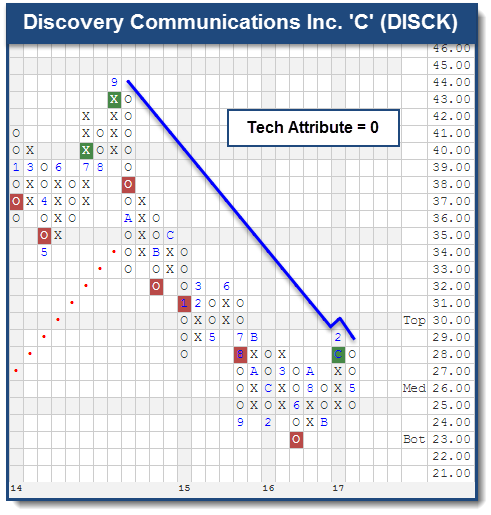
DISCK Discovery Communications Inc. 'C' ($25.39) - Media - (.09 weighting) DISCK has been in a negative trend since October 2014 and it has no positive technical attributes. The chart has managed to find some support in the mid $20's and is currently testing its bearish resistance line. If DISCK can make a higher bottom and move to $30, it will penetrate the bearish resistance line and give a second consecutive buy signal. Otherwise, until the chart can show some signs that demand is in control we would continue to avoid DISCK.
Other Weak Stocks Before Correction:
- Akamai Technologies, Inc. AKAM
- Alexion Pharmaceuticals ALXN
- Express Scripts ESRX
- Gilead Sciences, Inc. GILD
- JB Hunt Transport Services JBHT
- Mattel, Inc. MAT
- QUALCOMM Incorporated QCOM
- Tractor Supply Company TSCO
Dollar Tree, Inc. DLTR
DLTR Dollar Tree, Inc. ($69.88) - Retailing - (0.26 weighting) DLTR traded in an overall range bound pattern for the past 18 months with the exception of a brief stint in June – August 2016. The stock fell to support in the lower $70’s with last week’s volatility but was unable to hold that level. With today’s action (6/16) the stock fell to $66. DLTR only offers two positive technical attributes and ranks in the bottom half of its sector matrix. This adds to the weight of evidence for the unfavored Retailing sector as many of those charts have broken down. Those long may exit positions here or on a reversal into X’s and avoid DLTR moving forward.

Other Stocks That Deteriorated With Last Week's Action:
Alphabet Inc. Class A GOOGL
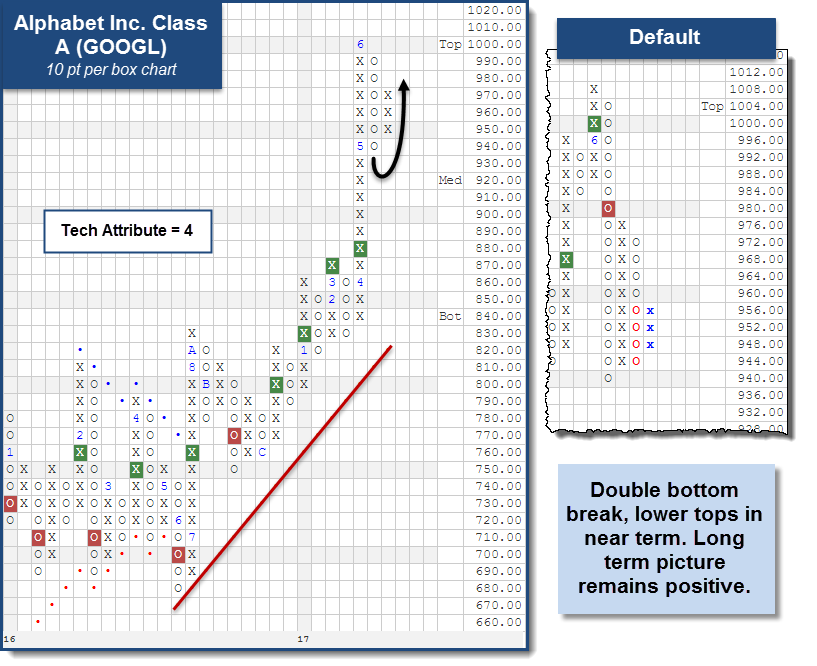
GOOGL Alphabet Inc. Class A ($950.31) - Internet - (4.34 weighting) Year-to-date (through 6/15) this stock is up over 21%. In June, GOOGL crossed the $1000 mark reaching $1008 on its chart. Interestingly, the stock is only a 4 for 5’er as it has not been able to reverse up into X's on its peer RS chart. Since reaching the high mark in June, the chart moved to a sell signal (default scale) when it broke a double bottom at $980 as it fell to a low of $940. The default scale shows a lot of activity and is appropriate for aggressive traders or those looking to maintain tight stop loss points. However, for those wanting to take a longer term view if the supply and demand relationship of GOOGL we have looked to the 10 point scale. This larger scale reduces the sensitivity of the chart and we see a much more orderly chart pattern. GOOGL moved to a positive trend in July 2016 and after giving one sell signal above the bullish support line last November it has given four consecutive buy signals. Currently, this chart shows support at $940 (also seen on the default chart) and reversed back into X's to $970. This sets up a potential double bottom break at $930. Under this level, the next support is not until $830, the bullish support line.
Other Stocks with Near Term Breakdowns:
- Analog Devices, Inc. ADI
- Activision Blizzard, Inc. ATVI
- Ctrip.com International Ltd. CTRIP
- IDEXX Laboratories, Inc. IDXX
- Illumina, Inc. ILMN
- KLA-Tencor Corporation KLAC
- Lam Research Corporation LRCX
- NetFlix Inc. NFLX
- Priceline Group Inc. PCLN
- Regeneron Pharmaceuticals, Inc. REGN
- Western Digital Corporation WDC
Incyte Genomics, Inc. INCY
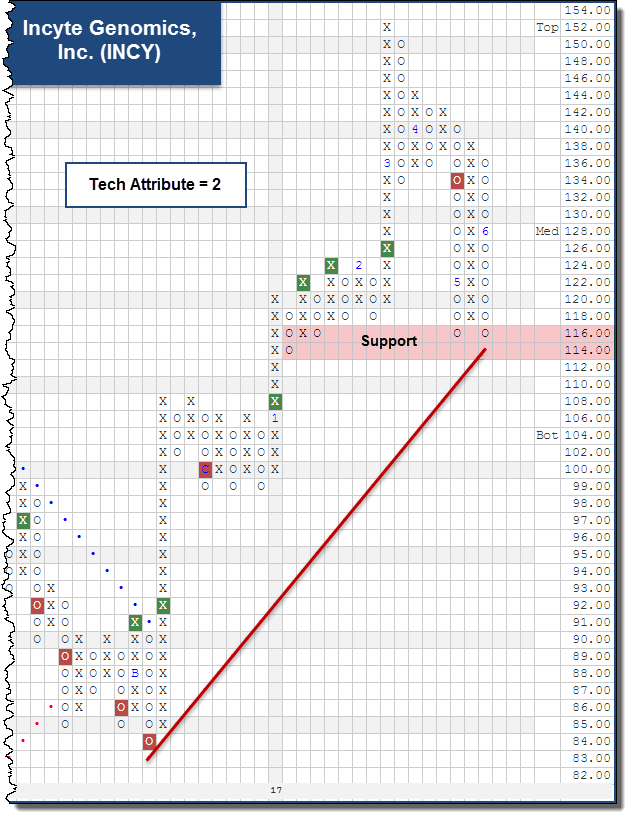
INCY Incyte Genomics, Inc. ($118.17) - Biomedics/Genetics - (0.35 weighting) This biotech stock has been trading above its bullish support line since November 2016 and reached a high on its chart at $152 in March 2017. Since that high, INCY broke a double bottom at $134 and pulled back all the way to its bullish support line. Currently, the chart has formed a spread triple bottom at $116, just above its bullish support line. This pullback from the high caused the market and peer RS charts to reverse to O's thus lowering the technical attribute score from 4 to 2. A move to $114 would mark a second consecutive sell signal while a move to $112 would violate the bullish support line leaving the stock with only 1 positive technical attribute. We would not initiate positions here and if long would watch this stock closely. If the support line is broken the next support on the chart is at $99.
Other Stocks Testing Support:
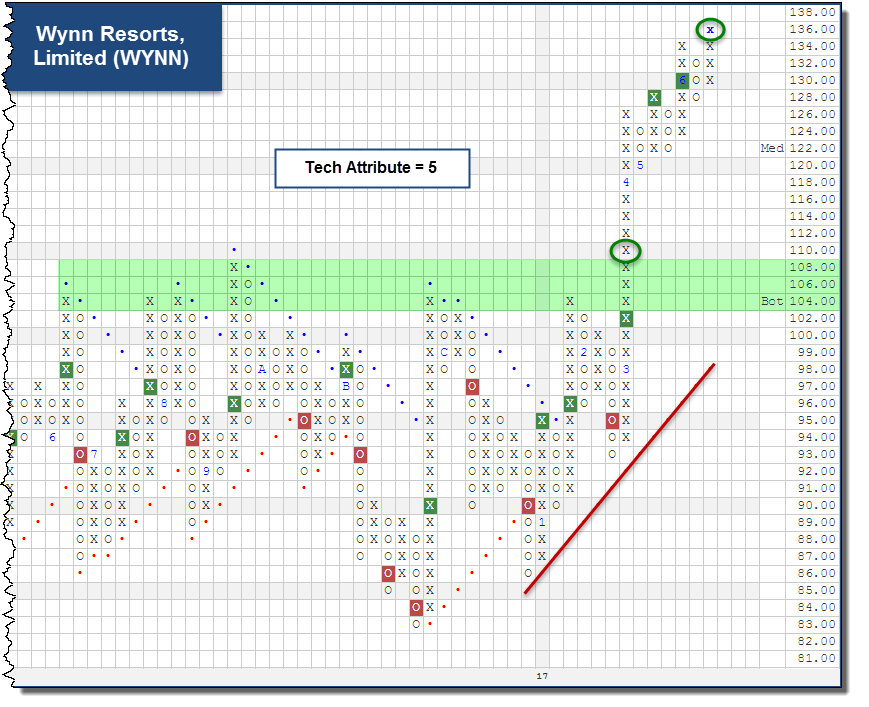
Wynn Resorts, Limited WYNN
WYNN Wynn Resorts, Limited ($135.23) - Gaming - (0.21 weighting) This stock is in the gaming sector and its trend chart shows demand is clearly in control. Since the first quarter of 2016 the stock has traded sideways (clearly seen on the 4pt. scale). In 2017 it was able to break out of this base at $110 (default chart) and become a 3 for 5’er in January. Since then, the stock has given four consecutive buy signals. The most recent was with today's intraday action at $136. Along with these signals the chart created higher bottoms. This tells us supply is getting weaker and also sets up tighter stop loss points. Currently, WYNN possesses all 5 positive technical attributes and positions may be considered here. A stop loss may be implemented with a move to $118, a spread double bottom break. After that, the next support on the chart would be the bullish support line at $99.
Other Stocks Not Bothered By Volatility:
