Most Requested Symbols

The curve has an average reading of 14.98%.
Today's featured stock is Western Digital Corporation (WDC).
ASML, AVB, HCC, HSY, MUSA, RENT, WAB, and WSM.
Call: Centene Corporation (CNC); Covered Write: Johnson & Johnson (JNJ); Covered Write: Bath & Body Works (BBWI).
NDW Morning Update Video - May 13, 2024
NDW Morning Update Video – May 13, 2024.
Click here to download MP3
The last few weeks of market action have led to some changes in momentum among the size & style breakdown on our Asset Class Group Scores (ACGS) rankings. As a refresher, the ACGS page features 134 groups that are meant to represent the various investment areas for all the ETFs and mutual funds tracked on the NDW system. Each fund is assigned a technical fund score, ranking from 0 (worst) to 6 (best). We then average the fund scores of the representatives included in each group to generate a score for the broader classification. These group rankings are meant to provide a more nuanced view of the technical posture for the total investible fund market.
We can use the US Styles view filter to condense the list of classifications down to the major size & style representatives. This ranking still shows US Large Cap Growth at the top of the rankings at an average score of 4.32, sitting just behind the S&P 500 Index Funds group, which has a score of 4.81. Both of those scores backed off slightly from relative score peaks throughout the near-term weakness in April, but they continue to be among the strongest groups on the entire ACGS system. It is interesting to note that all of the groups representing the nine size/style boxes have elevated fund scores; even the “lowest” score from Large Cap Blend still sits at a respectable 3.79 posting.
Sorting these groups by Direction reveals a slightly different picture. The score direction reading displays the numerical move from a score high or low over the past six months. Like the Group Score, we then average the score directions of each underlying constituent together to arrive at the reading for the entire group. Put simply, the Direction is just meant to tell us if the score is currently rising or falling, and what the magnitude of that move has been.
US Micro Cap shows the highest directional move at a 2.10 average score direction. From there, we see the three small cap representatives showing the next highest score directions, followed by Mid Cap blend and Mid Cap Value, then Large Cap Growth. Even though US Large Cap Growth still has the highest fund score, it shows the lowest score direction out of the equity groups included in this view.
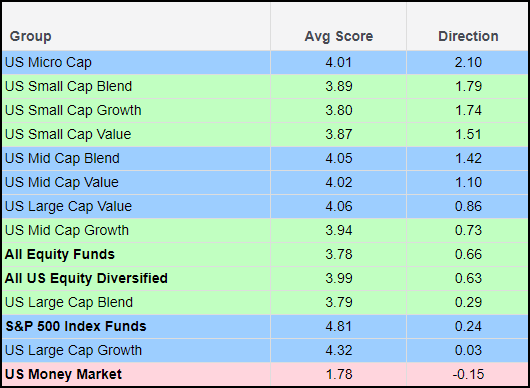
Rankings a/o 5/9/2024
This view of near-term movement shows a much different picture than what might be expected when examining the score rankings independently. Areas that lagged the broader market throughout much of last year have maintained higher directional readings than the leaders. This does not mean that we should be fearful of decaying leadership from the current areas of strength, as the scores of the S&P 500 Index Funds group and US Large Cap Growth have remained consistently high. Rather, we should consider it a positive to see other areas of the market improving as this provides a more solid technical foundation for the broader domestic equity space.

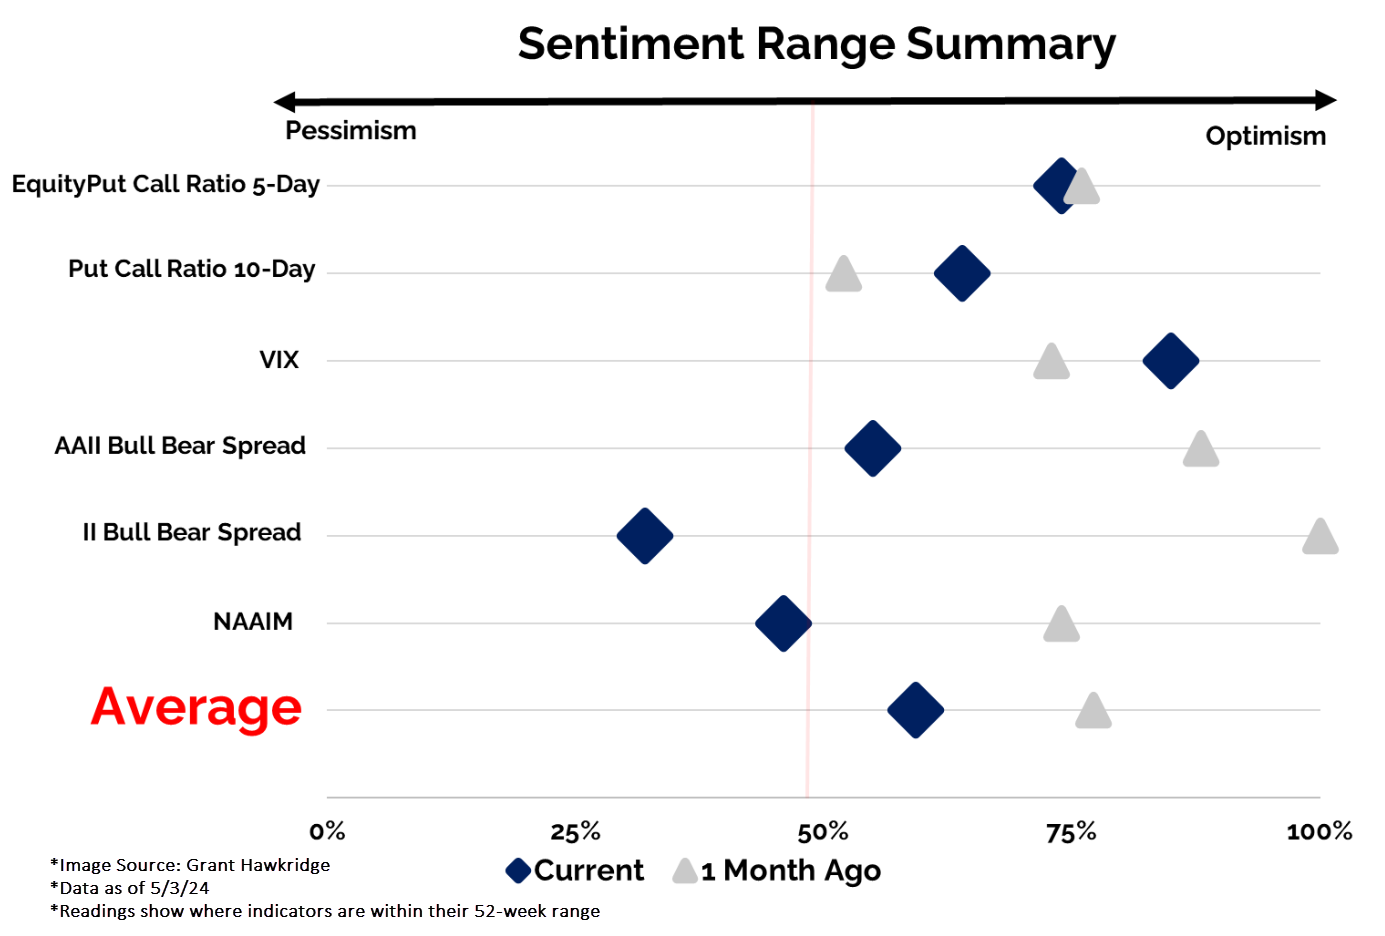
Sentiment follows price. When stocks go up people get more optimistic (bullish) and when stocks go down people become more pessimistic (bearish).
When we last had an investor sentiment discussion in March most of the readings were at multi-year highs - which makes sense because the S&P 500 (SPX) was going on five consecutive months of gains. At the time, 50% (four-week average) of American Association of Individual Investors (AAII) respondents thought the market would be higher six months later…which was a multiyear high/euphoric reading. Also in March, we saw the National Association of Active Investment Managers Exposure Index (NAAIM) move above 100%, signaling levered long equity exposure. Note that this was the highest reading since November 2021.
So, you could safely assume that there were some (justified) concerns about market extension and frothy behavior. Then April happened…the Russell 2000 (RUT) dropped 7%, the Dow and Nasdaq each lost 5%, and the S&P 500 fell over 4%. Given that sentiment follows price, naturally we saw a decline in feelings of euphoria and frothy market conditions.
Prior to the pullback in April, you could have argued that investor sentiment was acting as a headwind. Today, the bull herd has been thinned which alleviates the euphoric headwinds – a positive as long as the bulls don’t keep leaving.
One specific example: “The Jefferies Equity Product Management team recently pointed out that while performance following moves in the AAII bull-bear spread into negative territory is poor in the initial one to three weeks, the +12M performance is actually better than typical for the SPX” (Source: FactSet).
We came across the table below on Twitter earlier this week and think it provides a nice summary of the various sentiment reading shifts over the past month. Another more recent development is today’s Michigan Consumer Sentiment Survey which showed a continued plateau (Source: advisorperspectives.com).
Of course, sentiment is closely tied to the major equity indices like the S&P 500, Dow, and Nasdaq – they are what people see most often - like how gas and food prices tend to heavily affect consumer sentiment/behavior because people see them all the time.
However, over the past month, we saw more than just a top-line pullback. Beneath the surface most stocks, in most sectors, experienced some technical softening which contributed to a more substantial sentiment reset than a routine 5% exhale would suggest.
Below we have four distribution curves. On the left-hand side, we are showing the percentage of stocks trading on a Point & Figure buy signal in each sector. The black outline is intended to show the disparity above the 50% threshold. At the end of March (upper left) over 20 groups had at least 50% of members trading on a buy signal. To start May (bottom left) just 11 remained.
On the right-hand side, we are showing the % of stocks trading above their 50-day moving average, in each sector, at the end of March (upper right) and at the start of May (bottom right). At the end of March ALL sectors but three had 50%+ stocks trading above their 50-day moving average. The start of May was clearly a different story. Summertime Blues?
Some of these readings have again shifted higher this week but remain far from March levels. Yesterday’s (5/9) AAII Sentiment Survey data is a good example. By no means are we saying that there was a washout or anything worthy of employing “mean reversion” tactics, but we are saying that there seems to have been a meaningful reset in investor sentiment at both a macro and micro level…enough for the euphoric headwinds to die down.

| Symbol | Name | Price | Yield | PnF Trend | RS Signal | RS Col. | Fund Score | 200 Day MA | Weekly Mom |
|---|---|---|---|---|---|---|---|---|---|
| DIA | SPDR Dow Jones Industrial Average ETF Trust | 394.00 | 1.82 | Positive | Sell | X | 3.97 | 364.92 | - 18W |
| EEM | iShares MSCI Emerging Markets ETF | 42.41 | 2.58 | Positive | Sell | O | 3.25 | 39.51 | + 2W |
| EFA | iShares MSCI EAFE ETF | 80.19 | 2.91 | Positive | Sell | X | 4.09 | 73.65 | - 6W |
| FM | iShares Frontier and Select EM ETF | 28.15 | 3.44 | Positive | Sell | O | 3.39 | 26.79 | - 4W |
| IJH | iShares S&P MidCap 400 Index Fund | 59.85 | 1.37 | Positive | Buy | O | 4.69 | 53.95 | - 6W |
| IJR | iShares S&P SmallCap 600 Index Fund | 109.56 | 1.36 | Positive | Sell | O | 3.22 | 101.48 | - 6W |
| QQQ | Invesco QQQ Trust | 441.02 | 0.62 | Positive | Buy | X | 5.27 | 399.97 | - 12W |
| RSP | Invesco S&P 500 Equal Weight ETF | 165.84 | 1.59 | Positive | Sell | O | 3.26 | 153.33 | - 6W |
| SPY | SPDR S&P 500 ETF Trust | 520.17 | 1.34 | Positive | Sell | X | 4.25 | 470.43 | - 10W |
| XLG | Invesco S&P 500 Top 50 ETF | 42.22 | 0.88 | Positive | Buy | X | 5.53 | 37.76 | - 10W |
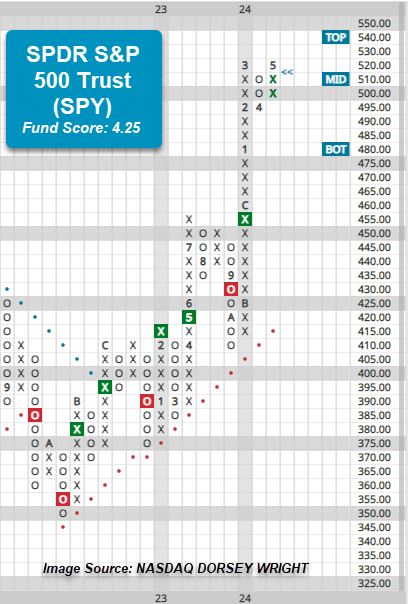
Small and Mid Caps have led their Large Cap counterparts since last Friday’s close, with IJR and IJH up 2.27% and 2.26%, but the notable chart action this week occurred on the chart of the SPDR S&P 500 Trust SPY. The fund has gained 1.74% through this week’s action and reversed back into Xs at $520 on its default point and figure chart Thursday. This places a much needed level of support at $495 on the chart for SPY which is closer to current trading levels. The reversal provided somewhat of a near-term uptick in fund score, bringing SPY up to 4.25 - though the fund is still off its recent peak score at 4.58 from mid-March. The reversal into Xs brings SPY to actionable territory on the chart and could be considered by those seeking to increase broad market or large cap exposure. While the recent performance within Small and Mid Caps have been notable and should continue to be monitored, the relative strength leadership remains with Large Caps at this time. Bear in mind that the SPDR Dow Jones Industrial Average ETF DIA still resides in Os on its default trend chart, while the Invesco S&P 500 Top ETF XLG reversed into Xs last week and sits at $42.
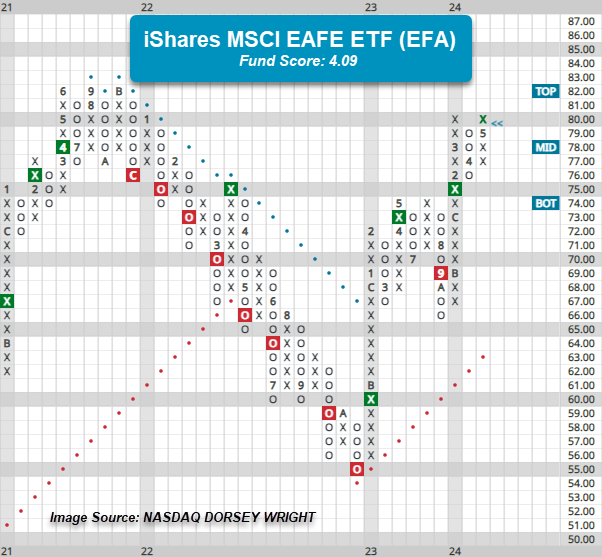
Though emerging markets are flat to slightly negative through Thursday’s action, developed markets have continued higher with the iShares MSCI EAFE ETF EFA adding 1.6% (5/3 – 5/9). On the default chart, EFA moved above $80 during Thursday’s trading to match the March rally high and a resistance level that dates to the beginning of 2022. EFA maintains a fund score of 4.09, which is stronger than the average score for a Non-US fund (3.53), and is coupled with a positive score direction north of 1, speaking to the fund’s near-term improvement. Those who may be seeking international, or more specifically developed markets exposure, can consider EFA here. A move above $81 would be a second buy signal and new multi-year high for the ETF, but bear in mind, the all-time chart from 2021 resides at $82. From here, initial support lies at $76, while the fund’s October 2023 chart low sits at $66, just above the bullish support line at $63.

Average Level
14.98
| < - -100 | -100 - -80 | -80 - -60 | -60 - -40 | -40 - -20 | -20 - 0 | 0 - 20 | 20 - 40 | 40 - 60 | 60 - 80 | 80 - 100 | 100 - > |
|---|---|---|---|---|---|---|---|---|---|---|---|
|
Buy signaldx/y
|
|||||||||||
|
Buy signalvoog
|
|||||||||||
|
Buy signalVOOV
|
|||||||||||
|
Buy signalief
|
Buy signalIJH
|
||||||||||
|
Buy signalUSO
|
Buy signalhyg
|
Buy signalspy
|
|||||||||
|
Buy signalshy
|
Buy signalgsg
|
Buy signalXLG
|
|||||||||
|
Buy signalagg
|
Buy signalQQQ
|
Buy signalijr
|
|||||||||
|
Sell signallqd
|
Buy signalrsp
|
Buy signaldia
|
Buy signaldvy
|
||||||||
|
Sell signalfxe
|
Sell signaliwm
|
Buy signalgcc
|
Buy signalgld
|
||||||||
|
Buy signaltlt
|
Sell signalicf
|
Buy signaloneq
|
Buy signalefa
|
Buy signaleem
|
|||||||
| < - -100 | -100 - -80 | -80 - -60 | -60 - -40 | -40 - -20 | -20 - 0 | 0 - 20 | 20 - 40 | 40 - 60 | 60 - 80 | 80 - 100 | 100 - > |
| AGG | iShares US Core Bond ETF |
| USO | United States Oil Fund |
| DIA | SPDR Dow Jones Industrial Average ETF |
| DVY | iShares Dow Jones Select Dividend Index ETF |
| DX/Y | NYCE U.S.Dollar Index Spot |
| EFA | iShares MSCI EAFE ETF |
| FXE | Invesco CurrencyShares Euro Trust |
| GLD | SPDR Gold Trust |
| GSG | iShares S&P GSCI Commodity-Indexed Trust |
| HYG | iShares iBoxx $ High Yield Corporate Bond ETF |
| ICF | iShares Cohen & Steers Realty ETF |
| IEF | iShares Barclays 7-10 Yr. Tres. Bond ETF |
| LQD | iShares iBoxx $ Investment Grade Corp. Bond ETF |
| IJH | iShares S&P 400 MidCap Index Fund |
| ONEQ | Fidelity Nasdaq Composite Index Track |
| QQQ | Invesco QQQ Trust |
| RSP | Invesco S&P 500 Equal Weight ETF |
| IWM | iShares Russell 2000 Index ETF |
| SHY | iShares Barclays 1-3 Year Tres. Bond ETF |
| IJR | iShares S&P 600 SmallCap Index Fund |
| SPY | SPDR S&P 500 Index ETF Trust |
| TLT | iShares Barclays 20+ Year Treasury Bond ETF |
| GCC | WisdomTree Continuous Commodity Index Fund |
| VOOG | Vanguard S&P 500 Growth ETF |
| VOOV | Vanguard S&P 500 Value ETF |
| EEM | iShares MSCI Emerging Markets ETF |
| XLG | Invesco S&P 500 Top 50 ETF |
| Symbol | Company | Sector | Current Price | Action Price | Target | Stop | Notes |
|---|---|---|---|---|---|---|---|
| KRG | Kite Realty Group Trust | Real Estate | $21.25 | 19 - 21 | 34.50 | 16 | 5 for 5'er, 11 of 113 in REAL sector matrix, LT pos mkt RS, spread quintuple top, 4.65% yield |
| OEC | Orion SA | Chemicals | $24.70 | 22 - 24 | 45.50 | 19 | 4 for 5'er, top third of CHEM sector matrix, LT pos mkt RS, spread quad top, R-R>5 |
| CCEP | Coca-Cola Europacific Partners PLC | Food Beverages/Soap | $73.66 | 60s | 97 | 56 | 5 for 5'er, top 25% of FOOD sector matrix, spread quad top, R-R~3.0, 3% yield |
| CXT | Crane NXT Co. | Electronics | $60.62 | hi 50s - low 60s | 76 | 48 | Top half of MACH sector matrix, bullish catapult |
| MMC | Marsh & McLennan Companies, Inc. | Insurance | $204.84 | 190s - low 200s | 234 | 180 | 5 for 5'er, favored INSU sector, LT pos mkt RS, quad top breakout, 1.4% yield |
| RPM | RPM, Inc. | Chemicals | $112.65 | mid 100s - hi 110s | 159 | 91 | 5 TA rating, LT RS buy, consec. buy signals, top 50% of CHEM sector matrix, buy-on-pullback, R-R > 2 |
| CI | CIGNA Group/The | Insurance | $350.97 | 332 - lo 360s | 428 | 288 | 5 TA rating, top half of INSU sector matrix, LT RS buy, buy-on-pullback |
| BAH | Booz Allen Hamilton Holding | Business Products | $154.34 | 140s | 193 | 114 | 5 for 5'er, top 25% of favored BUSI sector matrix, LT pos peer RS, pullback from ATH, 1.5% yield, Earn. 5/24 |
| GBX | The Greenbrier Companies, Inc. | Transports/Non Air | $53.32 | hi 40s - low 50s | 87 | 43 | 5 for 5'er, top 20% of favored TRAN sector matrix, pullback from multi-year high, R-R>4.0, 2.3% yield |
| JPM | J.P. Morgan Chase & Co. | Banks | $197.50 | lo 180s - hi 190s | 258 | 148 | 5 TA rating, RS buy, top 10% of BANK sector matrix, consec. buy signals |
| WSM | Williams-Sonoma, Inc. | Retailing | $318.45 | 280s - 290s | 362 | 232 | 5 for 5'er, #2 of 84 in RETA sector matrix, multi buy signals, pullback from ATH, 1.6% yield, Earn. 5/21 |
| PSTG | Pure Storage | Semiconductors | $54.11 | $49 to $58 | $74 | $38 | 5 for 5'er, pos. trend since June 2023, ranks 3rd in Semiconductors sector matrix. Earnings 5/29. |
| ORCL | Oracle Corporation | Software | $116.64 | 110s - low 120s | 150 | 99 | 4 for 5'er, top half of SOFT sector matrix. LT pos mkt RS, spread triple top, pullback from ATH, 1.4% yield |
| AMP | Ameriprise Financial | Finance | $430.03 | 390s - 410s | 532 | 368 | 5 for 5'er, top half of FINA sector matrix, LT pos peer & mkt RS, triple top, pullback from ATH, 1.4% yield |
| LIN | Linde Plc | Chemicals | $429.96 | hi 410s - lo 460s | 572 | 360 | 5 TA rating, consec. buy signals, LT RS buy, buy-on-pullback |
| OMF | OneMain Holdings Inc. | Finance | $51.26 | hi 40s - low 50s | 81 | 43 | 5 for 5'er, top half of FINA sector matrix, LT pos mkt RS, multiple buy signals, R-R>3.0, 7.9% yield |
| DHI | D.R. Horton, Inc. | Building | $149.50 | mid 140s - 150s | 178 | 134 | 5 for 5'er, favored BUIL sector, LT pos peer RS, bearish signal reversal |
| LPLA | LPL Investment Holdings Inc | Finance | $264.60 | hi 250s - lo 280s | 348 | 228 | 4 TA rating, top half FINA sector matrix, LT RS buy, consec. buy signals, recent pos. wkly. mom. |
| HLI | Houlihan Lokey Inc | Banks | $134.59 | 120s - low 130s | 177 | 110 | 5 for 5'er, 14 of 122 in BANK sector matrix, LT pos mkt RS, spread triple top, R-R>2.0, 1.6% yield |
| MAX | MediaAlpha, Inc. Class A | Internet | $20.18 | 18 - lo 20s | 39.50 | 16.25 | 5 TA rating, top quintile of INET sector matrix, pullback from ATH, R-R > 3 |
| WDC | Western Digital Corporation | Computers | $72.09 | hi 60s - low 70s | 84 | 58 | 5 for 5'er, #2 of 42 in COMP sector matrix, triple top breakout |
| Symbol | Company | Sector | Current Price | Action Price | Target | Stop | Notes |
|---|---|---|---|---|---|---|---|
| MTCH | Match Group, Inc. | Internet | $30.59 | (mid 30s) | 26 | 40 | 0 for 5'er, bottom half of INET sector matrix, LT neg trend & RS |
| MRVL | Marvell Technology Inc. | Semiconductors | $67.68 | (70 - 65) | 51 | 77 | 2 for 5'er, middle of unfavored SEMI sector matrix, spread quad bottom, Earn 5/30 |
| Symbol | Company | Sector | Current Price | Action Price | Target | Stop | Notes |
|---|---|---|---|---|---|---|---|
| HRB | H&R Block, Inc. | Business Products | $49.19 | mid 40s - lo 50s | 71 | 39 | HRB has moved into heavily overbought territory. OK to hold here. Raise stop to $45. |
| Comment | |||||||
|---|---|---|---|---|---|---|---|
|
|
|||||||
WDC Western Digital Corporation R ($71.91) - Computers - WDC is a 5 for 5'erthat ranks second out of 42 names in the computers sector matrix. After giving two consecutive sell signals, WDC returned to a buy signal last week when it broke a triple top at $73. Long exposure may be added in the upper $60s to low $70s and we will set our initial stop at $58, which would take out three levels of support on WDC's default chart. We will use the bullish price objective, $84, as our price objective.
| 23 | 24 | |||||||||||||||||||||||||||||||||||||||||||||||||||
| 76.00 | X | 76.00 | ||||||||||||||||||||||||||||||||||||||||||||||||||
| 75.00 | X | O | 75.00 | |||||||||||||||||||||||||||||||||||||||||||||||||
| 74.00 | X | X | O | 74.00 | ||||||||||||||||||||||||||||||||||||||||||||||||
| 73.00 | X | O | X | O | X | X | 73.00 | |||||||||||||||||||||||||||||||||||||||||||||
| 72.00 | X | X | O | X | O | X | O | X | X | X | 72.00 | |||||||||||||||||||||||||||||||||||||||||
| 71.00 | X | O | X | O | O | X | O | X | O | X | O | X | 71.00 | |||||||||||||||||||||||||||||||||||||||
| 70.00 | 4 | O | X | O | O | X | O | X | O | X | 70.00 | |||||||||||||||||||||||||||||||||||||||||
| 69.00 | X | O | X | O | X | O | X | 5 | X | 69.00 | ||||||||||||||||||||||||||||||||||||||||||
| 68.00 | X | O | O | X | O | X | O | 68.00 | ||||||||||||||||||||||||||||||||||||||||||||
| 67.00 | X | O | X | O | X | Mid | 67.00 | |||||||||||||||||||||||||||||||||||||||||||||
| 66.00 | X | O | O | 66.00 | ||||||||||||||||||||||||||||||||||||||||||||||||
| 65.00 | X | X | 65.00 | |||||||||||||||||||||||||||||||||||||||||||||||||
| 64.00 | X | O | X | 64.00 | ||||||||||||||||||||||||||||||||||||||||||||||||
| 63.00 | X | O | X | 63.00 | ||||||||||||||||||||||||||||||||||||||||||||||||
| 62.00 | X | O | X | 62.00 | ||||||||||||||||||||||||||||||||||||||||||||||||
| 61.00 | X | O | X | 61.00 | ||||||||||||||||||||||||||||||||||||||||||||||||
| 60.00 | X | 3 | O | X | 60.00 | |||||||||||||||||||||||||||||||||||||||||||||||
| 59.00 | • | X | O | X | O | 59.00 | ||||||||||||||||||||||||||||||||||||||||||||||
| 58.00 | • | X | O | X | 58.00 | |||||||||||||||||||||||||||||||||||||||||||||||
| 57.00 | • | X | 2 | X | 57.00 | |||||||||||||||||||||||||||||||||||||||||||||||
| 56.00 | • | X | O | X | • | 56.00 | ||||||||||||||||||||||||||||||||||||||||||||||
| 55.00 | • | X | O | X | • | 55.00 | ||||||||||||||||||||||||||||||||||||||||||||||
| 54.00 | • | X | O | X | • | 54.00 | ||||||||||||||||||||||||||||||||||||||||||||||
| 53.00 | • | X | X | O | • | 53.00 | ||||||||||||||||||||||||||||||||||||||||||||||
| 52.00 | • | X | O | X | • | Bot | 52.00 | |||||||||||||||||||||||||||||||||||||||||||||
| 51.00 | • | X | O | X | • | 51.00 | ||||||||||||||||||||||||||||||||||||||||||||||
| 50.00 | 8 | X | • | X | 1 | X | • | 50.00 | ||||||||||||||||||||||||||||||||||||||||||||
| 49.00 | X | O | X | O | • | C | O | • | 49.00 | |||||||||||||||||||||||||||||||||||||||||||
| 48.00 | X | O | X | O | • | • | X | • | 48.00 | |||||||||||||||||||||||||||||||||||||||||||
| 47.00 | O | X | O | • | A | • | X | • | 47.00 | |||||||||||||||||||||||||||||||||||||||||||
| 46.00 | O | O | • | • | • | 9 | X | O | • | X | • | 46.00 | ||||||||||||||||||||||||||||||||||||||||
| 45.00 | O | X | • | X | • | X | O | X | O | • | X | • | 45.00 | |||||||||||||||||||||||||||||||||||||||
| 44.00 | O | X | X | O | X | O | • | X | X | O | X | O | X | X | • | 44.00 | ||||||||||||||||||||||||||||||||||||
| 43.00 | O | X | O | X | O | X | O | • | 8 | O | X | O | O | X | O | X | • | 43.00 | ||||||||||||||||||||||||||||||||||
| 42.00 | O | X | O | X | 2 | O | • | X | O | X | O | X | O | B | • | 42.00 | ||||||||||||||||||||||||||||||||||||
| 41.00 | 9 | O | X | O | 6 | • | X | O | X | O | X | O | X | • | 41.00 | |||||||||||||||||||||||||||||||||||||
| 40.00 | O | X | X | O | X | O | 7 | O | X | O | X | O | X | • | 40.00 | |||||||||||||||||||||||||||||||||||||
| 39.00 | O | X | O | X | O | X | O | X | O | O | X | O | • | 39.00 | ||||||||||||||||||||||||||||||||||||||
| 38.00 | O | X | X | O | X | X | 3 | 4 | X | O | X | • | O | X | • | 38.00 | ||||||||||||||||||||||||||||||||||||
| 37.00 | O | X | O | X | B | O | X | O | X | O | X | O | X | O | • | O | X | • | 37.00 | |||||||||||||||||||||||||||||||||
| 36.00 | O | X | O | X | O | X | O | X | O | X | O | X | O | X | • | O | • | 36.00 | ||||||||||||||||||||||||||||||||||
| 35.00 | O | A | O | X | O | X | O | X | O | X | O | X | O | 5 | • | • | 35.00 | |||||||||||||||||||||||||||||||||||
| 34.00 | O | X | O | X | O | C | O | X | O | O | X | • | 34.00 | |||||||||||||||||||||||||||||||||||||||
| 33.00 | O | X | O | O | 1 | O | X | • | 33.00 | |||||||||||||||||||||||||||||||||||||||||||
| 32.00 | O | O | X | O | • | 32.00 | ||||||||||||||||||||||||||||||||||||||||||||||
| 31.00 | O | X | • | 31.00 | ||||||||||||||||||||||||||||||||||||||||||||||||
| 30.00 | O | 30.00 | ||||||||||||||||||||||||||||||||||||||||||||||||||
| 23 | 24 |

| ASML Asm Lithograpghy HLDG NV (Netherlands) ADR ($930.02) - Semiconductors - ASML rose Friday to break a double top at $928. This 5 for 5'er moved to a positive trend in November and sits in the top half of the semiconductors sector RS matrix. The stock has also been on an RS buy signal against the market since December 2022. The weight of the technical evidence is favorable and improving once again. Initial support can be seen at $864 with overhead resistance initially found at $1008 and $1056. |
| AVB AvalonBay Communities, Inc. ($196.81) - Real Estate - AVB shares gave a second consecutive buy signal on Friday and tested their 52-week highs, but the stock is still a 3 for 5'er at this time. Further bullish confirmation would come with a breakout at $200. |
| HCC Warrior Met Coal Inc ($64.13) - Oil - HCC fell to a sell signal on Friday when it broke a triple bottom at $64. The outlook for HCC remains positive as the stock is a 5 for 5'er that ranks in the top decile of the oil sector matrix. From here, the next level of support is HCC bullish support line at $59. However, beyond this level the chart shows no additional support until $56, more than 12% away from Friday's close. |
| HSY The Hershey Company ($203.95) - Food Beverages/Soap - HSY shares broke a double top at $204 on Friday and reentered a positive trend, making the stock a 3 for 5'er again. That said, further bullish confirmation is needed - a breakout at $212 could suffice. Big support is offered in the low $180 range. |
| MUSA Murphy USA Inc. ($432.29) - Oil - MUSA returned to a buy signal on Friday when it broke a double top at $432, marking a new all-time high for the stock. The move adds evidence to an already positive technical picture as MUSA is a 5 for 5'er that ranks in the top half of the oil sector matrix. MUSA now finds support at $384. |
| RENT Rent the Runway, Inc. ($16.90) - Retailing - RENT reversed into Xs and broke a double top at $17 for a second buy signal as the stock rallied to $18.50. The stock is a 5 for 5'er following reversals into Xs on both the market and peer RS charts. Okay to consider here on the breakout or on a pullback toward the middle of the trading band. Initial support lies at $13, while additional can be found at $9.50. |
| WAB Wabtec Inc. ($167.97) - Autos and Parts - WAB broke a double top at $168 for a fourth consecutive buy signal since June of 2023. and to mark a new all-time high. The stock is a 3 for 5'er that ranks 4th (out of 56) in the Autos and Parts sector matrix. With the stock still residing in overbought territory, those seeking exposure may consider dollar cost averaging into exposure on pullbacks. Initial support lies at $160, while additional lies at $144. |
| WSM Williams-Sonoma, Inc. ($313.76) - Retailing - WSM broke a double top at $320 for a fourth consecutive buy signal since February this year. The stock is a 5 for 5'er that ranks 3rd (out of 84) in the Retailing sector matri and is accompanied by a yield of roughly 1.5%. Okay to consider here on the breakout or on a pullback toward the middle of the trading band. Initial support lies at $280. |
| Name | Option Symbol | Action | Stop Loss |
|---|---|---|---|
| Centene Corporation - $77.86 | O: 24I77.50D20 | Buy the September 77.50 calls at 5.50 | 70.00 |
| Name | Option | Action |
|---|---|---|
| Visa Inc. ( V) | Jul. 275.00 Calls | Initiate an option stop loss of 9.15 (CP: 11.15) |
| Name | Option Symbol | Action | Stop Loss |
|---|---|---|---|
| Johnson & Johnson - $149.75 | O: 24U150.00D20 | Buy the September 150.00 puts at 5.10 | 164.00 |
| Name | Option | Action |
|---|---|---|
| Match Group, Inc. ( MTCH) | Jun. 37.50 Puts | Raise the option stop loss to 5.00 (CP: 7.00) |
| UnitedHealth Group Incorporated ( UNH) | Jul. 480.00 Puts | Stopped at 512.00 (CP: 511.55) |
| Name | Option Sym. | Call to Sell | Call Price | Investment for 500 Shares | Annual Called Rtn. | Annual Static Rtn. | Downside Protection |
|---|---|---|---|---|---|---|---|
| Bath & Body Works Inc. $ 48.56 | O: 24H50.00D16 | Aug. 50.00 | 3.00 | $ 22,547.95 | 36.57% | 20.60% | 5.24% |
| Name | Action |
|---|---|
| DraftKings Inc Class A ( DKNG) - 44.04 | Sell the July 45.00 Calls. |
| United Airlines Holdings Inc. ( UAL) - 52.63 | Sell the August 55.00 Calls. |
| Palantir Technologies Inc. Class A ( PLTR) - 21.14 | Sell the August 23.00 Calls. |
| Micron Technology, Inc. ( MU) - 117.86 | Sell the August 115.00 Calls. |
| Royal Caribbean Cruises Ltd. ( RCL) - 141.74 | Sell the September 145.00 Calls. |
| Palantir Technologies Inc. Class A ( PLTR) - 21.14 | Sell the August 22.00 Calls. |
| Lennar Corporation ( LEN) - 160.89 | Sell the August 165.00 Calls. |
| Name | Covered Write |
|---|---|
|
|
|
Daily Equity & Market Analysis
Loading, Please Wait...
