This week's featured charts are the SPDR S&P 500 Trust (SPY) and the iShares MSCI EAFE ETF (EFA).
Portfolio View - Major Market ETFs
| Symbol | Name | Price | Yield | PnF Trend | RS Signal | RS Col. | Fund Score | 200 Day MA | Weekly Mom |
|---|---|---|---|---|---|---|---|---|---|
| DIA | SPDR Dow Jones Industrial Average ETF Trust | 394.00 | 1.82 | Positive | Sell | X | 3.97 | 364.92 | - 18W |
| EEM | iShares MSCI Emerging Markets ETF | 42.41 | 2.58 | Positive | Sell | O | 3.25 | 39.51 | + 2W |
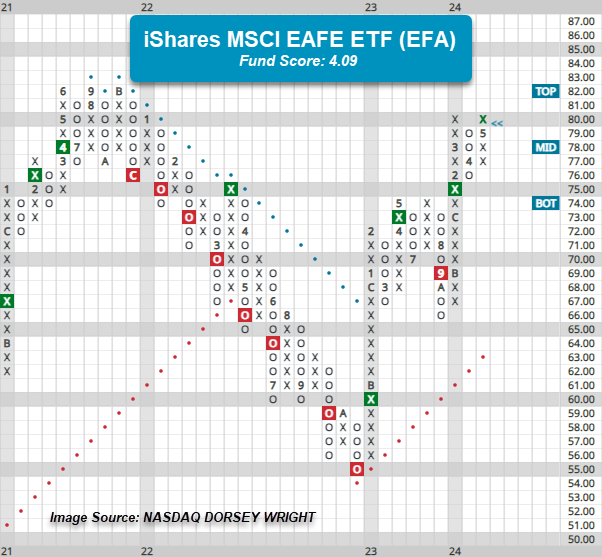
| EFA | iShares MSCI EAFE ETF | 80.19 | 2.91 | Positive | Sell | X | 4.09 | 73.65 | - 6W |
| FM | iShares Frontier and Select EM ETF | 28.15 | 3.44 | Positive | Sell | O | 3.39 | 26.79 | - 4W |
| IJH | iShares S&P MidCap 400 Index Fund | 59.85 | 1.37 | Positive | Buy | O | 4.69 | 53.95 | - 6W |
| IJR | iShares S&P SmallCap 600 Index Fund | 109.56 | 1.36 | Positive | Sell | O | 3.22 | 101.48 | - 6W |
| QQQ | Invesco QQQ Trust | 441.02 | 0.62 | Positive | Buy | X | 5.27 | 399.97 | - 12W |
| RSP | Invesco S&P 500 Equal Weight ETF | 165.84 | 1.59 | Positive | Sell | O | 3.26 | 153.33 | - 6W |
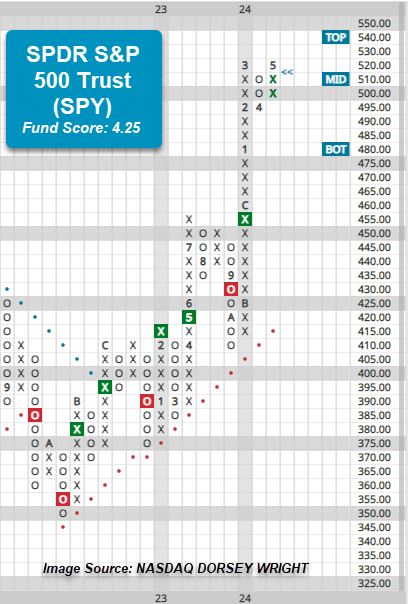
| SPY | SPDR S&P 500 ETF Trust | 520.17 | 1.34 | Positive | Sell | X | 4.25 | 470.43 | - 10W |
| XLG | Invesco S&P 500 Top 50 ETF | 42.22 | 0.88 | Positive | Buy | X | 5.53 | 37.76 | - 10W |
Additional Comments:
Small and Mid Caps have led their Large Cap counterparts since last Friday’s close, with IJR and IJH up 2.27% and 2.26%, but the notable chart action this week occurred on the chart of the SPDR S&P 500 Trust SPY. The fund has gained 1.74% through this week’s action and reversed back into Xs at $520 on its default point and figure chart Thursday. This places a much needed level of support at $495 on the chart for SPY which is closer to current trading levels. The reversal provided somewhat of a near-term uptick in fund score, bringing SPY up to 4.25 - though the fund is still off its recent peak score at 4.58 from mid-March. The reversal into Xs brings SPY to actionable territory on the chart and could be considered by those seeking to increase broad market or large cap exposure. While the recent performance within Small and Mid Caps have been notable and should continue to be monitored, the relative strength leadership remains with Large Caps at this time. Bear in mind that the SPDR Dow Jones Industrial Average ETF DIA still resides in Os on its default trend chart, while the Invesco S&P 500 Top ETF XLG reversed into Xs last week and sits at $42.
Though emerging markets are flat to slightly negative through Thursday’s action, developed markets have continued higher with the iShares MSCI EAFE ETF EFA adding 1.6% (5/3 – 5/9). On the default chart, EFA moved above $80 during Thursday’s trading to match the March rally high and a resistance level that dates to the beginning of 2022. EFA maintains a fund score of 4.09, which is stronger than the average score for a Non-US fund (3.53), and is coupled with a positive score direction north of 1, speaking to the fund’s near-term improvement. Those who may be seeking international, or more specifically developed markets exposure, can consider EFA here. A move above $81 would be a second buy signal and new multi-year high for the ETF, but bear in mind, the all-time chart from 2021 resides at $82. From here, initial support lies at $76, while the fund’s October 2023 chart low sits at $66, just above the bullish support line at $63.