
Today we look at a variety of investor sentiment readings and explain why the latest downtick could be good for markets.
Sentiment follows price. When stocks go up people get more optimistic (bullish) and when stocks go down people become more pessimistic (bearish).
When we last had an investor sentiment discussion in March most of the readings were at multi-year highs - which makes sense because the S&P 500 (SPX) was going on five consecutive months of gains. At the time, 50% (four-week average) of American Association of Individual Investors (AAII) respondents thought the market would be higher six months later…which was a multiyear high/euphoric reading. Also in March, we saw the National Association of Active Investment Managers Exposure Index (NAAIM) move above 100%, signaling levered long equity exposure. Note that this was the highest reading since November 2021.
So, you could safely assume that there were some (justified) concerns about market extension and frothy behavior. Then April happened…the Russell 2000 (RUT) dropped 7%, the Dow and Nasdaq each lost 5%, and the S&P 500 fell over 4%. Given that sentiment follows price, naturally we saw a decline in feelings of euphoria and frothy market conditions.
Prior to the pullback in April, you could have argued that investor sentiment was acting as a headwind. Today, the bull herd has been thinned which alleviates the euphoric headwinds – a positive as long as the bulls don’t keep leaving.
One specific example: “The Jefferies Equity Product Management team recently pointed out that while performance following moves in the AAII bull-bear spread into negative territory is poor in the initial one to three weeks, the +12M performance is actually better than typical for the SPX” (Source: FactSet).
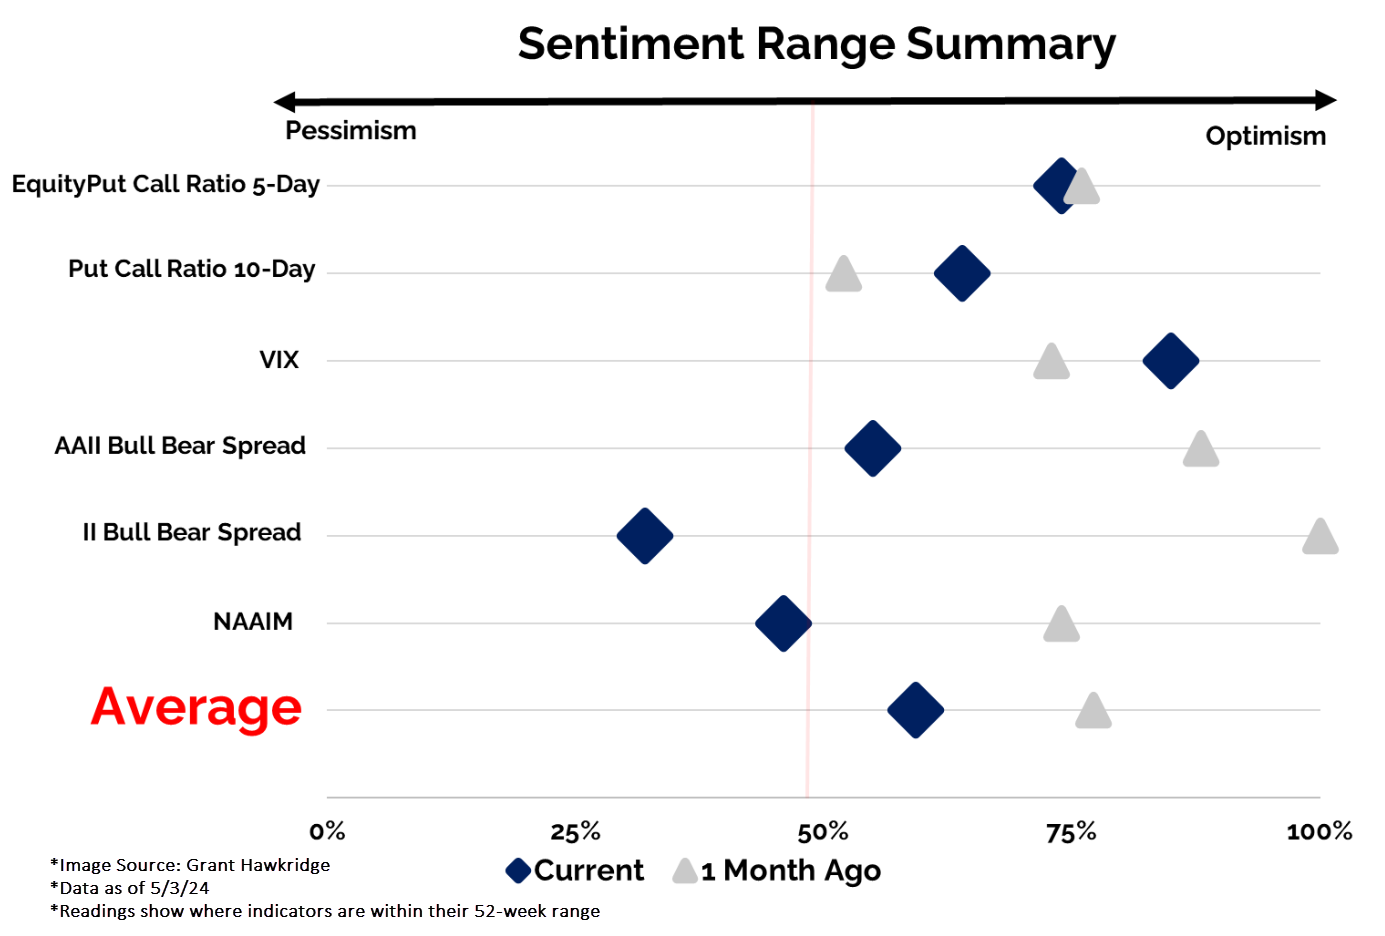
We came across the table below on Twitter earlier this week and think it provides a nice summary of the various sentiment reading shifts over the past month. Another more recent development is today’s Michigan Consumer Sentiment Survey which showed a continued plateau (Source: advisorperspectives.com).
Of course, sentiment is closely tied to the major equity indices like the S&P 500, Dow, and Nasdaq – they are what people see most often - like how gas and food prices tend to heavily affect consumer sentiment/behavior because people see them all the time.
However, over the past month, we saw more than just a top-line pullback. Beneath the surface most stocks, in most sectors, experienced some technical softening which contributed to a more substantial sentiment reset than a routine 5% exhale would suggest.
Below we have four distribution curves. On the left-hand side, we are showing the percentage of stocks trading on a Point & Figure buy signal in each sector. The black outline is intended to show the disparity above the 50% threshold. At the end of March (upper left) over 20 groups had at least 50% of members trading on a buy signal. To start May (bottom left) just 11 remained.
On the right-hand side, we are showing the % of stocks trading above their 50-day moving average, in each sector, at the end of March (upper right) and at the start of May (bottom right). At the end of March ALL sectors but three had 50%+ stocks trading above their 50-day moving average. The start of May was clearly a different story. Summertime Blues?
Some of these readings have again shifted higher this week but remain far from March levels. Yesterday’s (5/9) AAII Sentiment Survey data is a good example. By no means are we saying that there was a washout or anything worthy of employing “mean reversion” tactics, but we are saying that there seems to have been a meaningful reset in investor sentiment at both a macro and micro level…enough for the euphoric headwinds to die down.

