
The last few weeks of market action have led to some changes in momentum among the size & style breakdown on our Asset Class Group Scores (ACGS) rankings.
The last few weeks of market action have led to some changes in momentum among the size & style breakdown on our Asset Class Group Scores (ACGS) rankings. As a refresher, the ACGS page features 134 groups that are meant to represent the various investment areas for all the ETFs and mutual funds tracked on the NDW system. Each fund is assigned a technical fund score, ranking from 0 (worst) to 6 (best). We then average the fund scores of the representatives included in each group to generate a score for the broader classification. These group rankings are meant to provide a more nuanced view of the technical posture for the total investible fund market.
We can use the US Styles view filter to condense the list of classifications down to the major size & style representatives. This ranking still shows US Large Cap Growth at the top of the rankings at an average score of 4.32, sitting just behind the S&P 500 Index Funds group, which has a score of 4.81. Both of those scores backed off slightly from relative score peaks throughout the near-term weakness in April, but they continue to be among the strongest groups on the entire ACGS system. It is interesting to note that all of the groups representing the nine size/style boxes have elevated fund scores; even the “lowest” score from Large Cap Blend still sits at a respectable 3.79 posting.
Sorting these groups by Direction reveals a slightly different picture. The score direction reading displays the numerical move from a score high or low over the past six months. Like the Group Score, we then average the score directions of each underlying constituent together to arrive at the reading for the entire group. Put simply, the Direction is just meant to tell us if the score is currently rising or falling, and what the magnitude of that move has been.
US Micro Cap shows the highest directional move at a 2.10 average score direction. From there, we see the three small cap representatives showing the next highest score directions, followed by Mid Cap blend and Mid Cap Value, then Large Cap Growth. Even though US Large Cap Growth still has the highest fund score, it shows the lowest score direction out of the equity groups included in this view.
Asset Class Group Scores - US Styles Score Direction Ranks
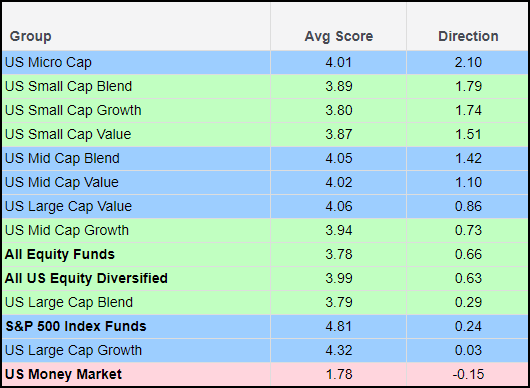
Rankings a/o 5/9/2024
This view of near-term movement shows a much different picture than what might be expected when examining the score rankings independently. Areas that lagged the broader market throughout much of last year have maintained higher directional readings than the leaders. This does not mean that we should be fearful of decaying leadership from the current areas of strength, as the scores of the S&P 500 Index Funds group and US Large Cap Growth have remained consistently high. Rather, we should consider it a positive to see other areas of the market improving as this provides a more solid technical foundation for the broader domestic equity space.
