Most Requested Symbols

Although summer doesn’t officially begin for about another five weeks, many Americans recognize Memorial Day, which is right around the corner, as the unofficial start of summer. Many of us are looking forward to the warm weather, beach vacations, and the other usual summer activities. However, in the investment world, the summer months are associated with lackluster returns, also known as the "Summertime Blues."
The curve has an average reading of 5.74%.
Today's featured stock is MediaAlpha, Inc. Class A (MAX).
Comments include: ABNB, CAT, CNC, H, USFD, and W.
Call: Cardinal Health (CAH); Put: Duke Energy (DUK); Covered Write: Lennar Corporation (LEN)
NDW Morning Update Video - May 10, 2024
NDW Morning Update Video – May 10, 2024.
Click here to download MP3
Beginners Series Webinar: Join us on Friday, May 10th at 2 PM (ET) for our NDW Beginners Series Webinar. This week's topic is: Navigating the Models Page Register Here
Leaders lead, and laggards lag. That is… until they don’t. Of course, every investment manager’s dream is finding the magic key that tells you when trends are shifting, but that is often much easier said than done. How can one tell if bounces for these laggards are “legit” or not? With hindsight as a guide things become a lot clearer, but in the moment finding what is real and what isn’t is filled with FOMO (for non-holders) and sell on rally calls (for holders.) Momentum is content leaving gains on the table, with the hopes that this can be counteracted by prolonged strength for the investment in question. Said more concisely, buy high, sell higher is a phrase said often around the NDW think tank. But of course, not every rally is going to be “the one”, so creating a formula to help identify strong trends is paramount.
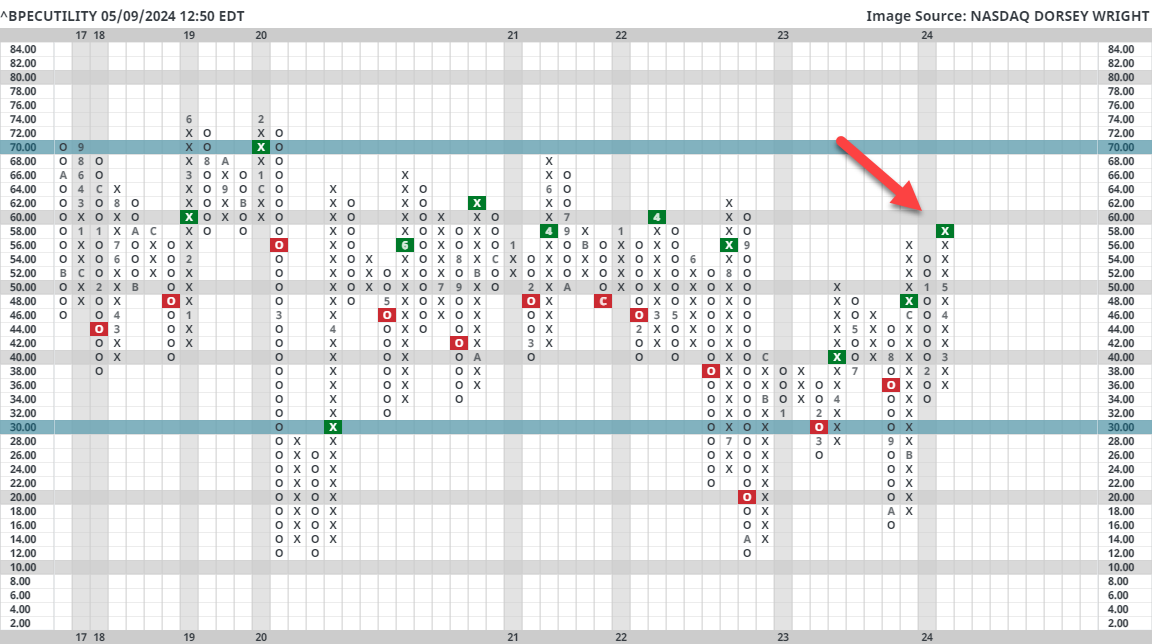
Today’s piece will focus namely on Utilities, but it could be used in practice for any sector or broad group. Last week’s FSO detailed strength for the sector in the near term, with the average fund score for the group moving above the key 3.0 threshold for the first time in quite a while. Pair this with vast upticks in participation for the sector and things start to look a bit more compelling. ^BPECUTILITY sits at its highest level in over 2 years, suggesting a significant number of Utility stocks sit on PnF buy signals. At the same time, coveted “follow-through” comes through a quick look at ^PTECUTILITY, with a growing number of Utility stocks earning long-term positive trends, all net positives for the group. If we were creating a running tally, chalk these up for the idea that utilities are on the rise.
So what gives? Where is the merit against this idea? Well- the main pushback that comes to mind is a simple argument… The move was just too fast to make a call quite yet. The analyst team (and conversational knowledge) often refers to pullbacks in price as a form of normalization- which can easily overshadow normalization over time. If price action can sustain positioning above certain levels long enough, those levels will become the new normal. A couple of tests for this include a quick look at the average OBOS reading for the Utilties sector, which sits at 114% (the next highest sector is energy at 36%.) Furthermore, one can utilize performance spreads to help identify where excess performance stalled out before like in the graph below. A rolling 3-month performance spread between XLU and SPX shows nice outperformance for the sector in the near term, but it is encroaching on a point (roughly 20%) where such outperformance has faded. The point being that history suggests things could get a bit choppy in the near term as the sector fights to hold the relative strength it has earned. For current holders, watch positions closely for signs of weakness and take profits where needed. For prospective holders, exercise caution as we would expect to see normalization (price or time) as we move through May.


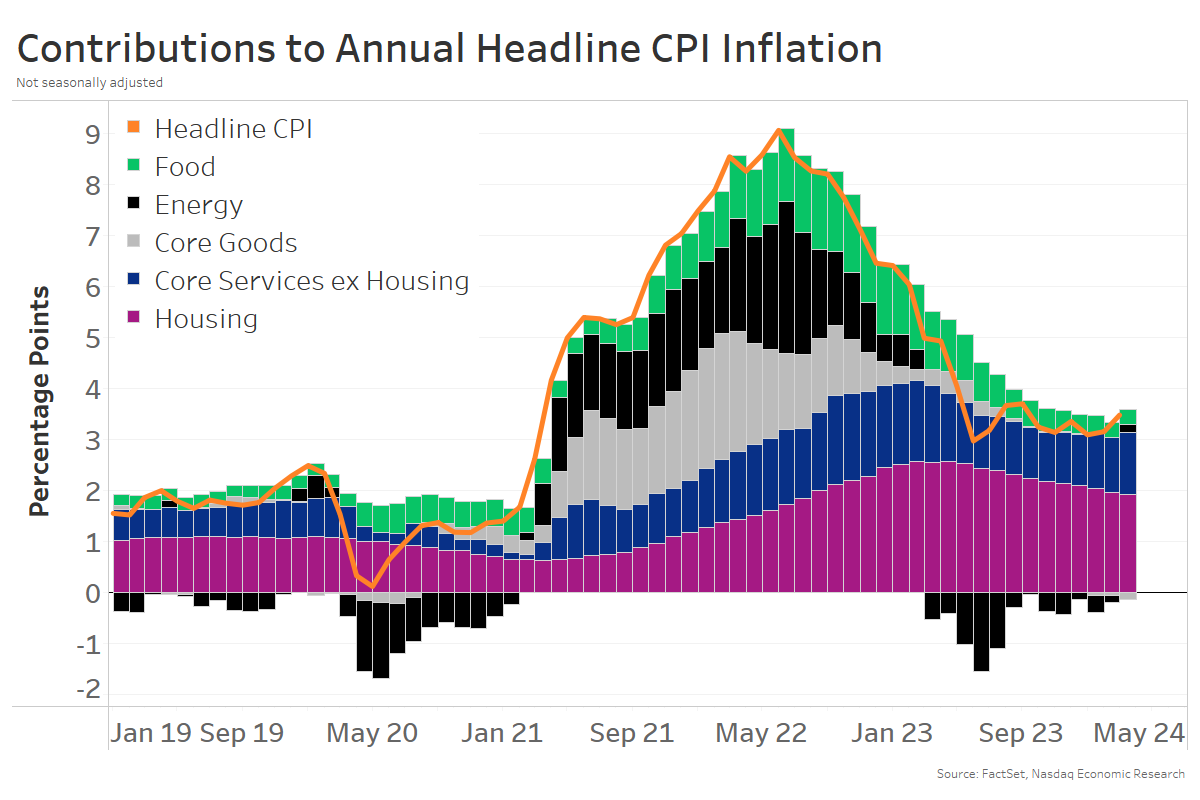
Inflation has risen from 3.1% YoY to 3.5% this year
It’s been a tough start to the year for inflation. Headline CPI inflation was as low as 3.1% YoY, but it’s since risen to 3.5% (chart below, orange line) – that’s exactly the opposite of what the Fed’s wanted to see. Which is partly why Fed rate cuts have been postponed, and long-term bond yields have risen (again).
Next week we get an update to CPI, and it’s expected to remain at 3.5% YoY.
Most categories of inflation have normalized (Energy, Core Goods, Food)
This is despite the fact that most categories of inflation have slowed materially.
So the blame for sticky inflation lays with housing (purple bars) and core services ex-housing (blue bars). Sound familiar?
Sticky inflation coming from lagged effects of Covid-era inflation in insurance and housing
Believe it or not, much of the remaining inflation is still Covid-related!
That’s because a lot of the recent drivers of core services and housing inflation are due to the lagged effects of Covid-era inflation (the good news is that means inflation isn’t reaccelerating).
During Covid, those categories saw significant increases in market prices and/or input costs, which have now slowed. But consumer prices are still catching up.
Covid-era car inflation set off waves of inflation in parts, repairs, and now insurance
Take cars and cars-related inflation, for example.
Chips shortages led to increases in new car prices and pushed buyers into the used car market. New and used car inflation peaked in early 2022 at nearly 25% YoY – adding close to 2% to headline inflation at its peak (chart below, light grey bars). Even though car price inflation has since normalized – hovering around 0% YoY for more than a year – the level of car prices is still 25% higher than pre-Covid.
Those more expensive cars set off waves of related inflation:
These lagged effects are still adding over ½% to CPI, even though cars themselves have added nothing to inflation for the last year. Although fortunately, the waves have crested for car prices, parts, and repairs already. So once that gets built into insurance, that inflation should fall too.

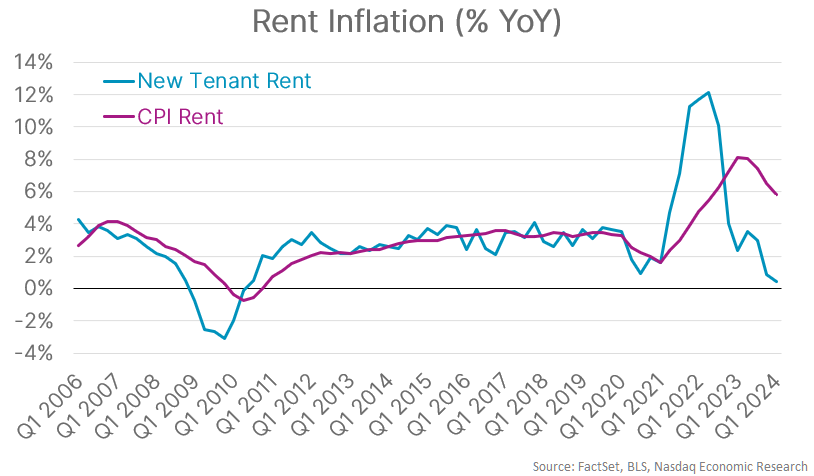
New rents inflation peaked two years ago, but CPI rent inflation is a year behind
The story is similar in housing. New rent inflation (looking just at new lease prices each quarter) peaked in Q2 2022 at 12% YoY, but has since fallen to 0.4% p.a. (chart below, blue line).
But the CPI measure of rents (chart below, purple line) has been much slower to fall. That’s partly because it’s a sample of all rents – not just newly signed or renewed leases.
The short story here though, is that rents also seem more likely to fall in the future too.
Even though inflation has been sticky – the underlying data says it’s still falling
So, even though inflation has proven stickier than hoped, underlying data shows that inflation is not picking back up broadly. It’s just that Covid-era inflation still (!) hasn’t fully worked its way out of CPI.
That means disinflation will (eventually) continue. And that in turn will enabling the Fed to start cutting rates this year.
Better late than never…
Although summer doesn’t officially begin for about another five weeks, many Americans recognize Memorial Day, which is right around the corner, as the unofficial start of summer. Many of us are looking forward to the warm weather, beach vacations, and the other usual summer activities. However, in the investment world, the summer months are associated with lackluster returns, also known as the "Summertime Blues." This year, we enter the summer months after what has been a strong start to 2024, despite the pullback in April, the S&P 500 (SPX) is up almost 9% year-to-date (through 5/8).
The table below shows the returns of both the Dow Jones Industrial Average and the S&P 500 during the summer months (May 31st to August 31st) back to 1981. The S&P 500 and the Dow Jones Industrial Average have each finished in negative territory in 16 of the past 43 summers (or about 37% of the time). Of those 16 down summers, there were 14 summers in which SPX and DJIA were both down at the same time. While less than half of the summers have been negative for these benchmarks, the bad summers were indeed bad, with some down double digits over the three-month period. For instance, in the summer of 1990, SPX fell -10.69%. In 1998, it saw a drop of -12.24%, but the worst summer came in 2002 during the tech crash when the index declined -14.16%. During the summer of 2008, which began a famously longer slide as SPX fell -8.39%. The market has bucked the trend recently, as the Dow and the S&P have each had only one negative summer (2022) since 2015.

To determine if there is one month that tends to have an outsized effect on summer returns, we compiled a monthly summary of S&P 500 returns going back to 1958. What we found is that the summer months tend to have a lower median return than most of the other months of the year. It is the month of September that has historically provided the lowest median return at -0.57%, but it is followed closely by June which has a median return of just 0.08%. Notice too that the spread, i.e., the max return in each month versus the minimum return in a given month, is relatively low for the summer months (namely June and July). A closer look at the month of June reveals a max return of 6.89% in the last 60 years, which it posted in 2019, and which followed a May return of -6.58%. Every other month, except February, had a maximum return of more than 8%. Clearly, June has historically been one of the weaker months for SPX returns. However, we can't blame the Summertime Blues on June alone. August has experienced the second-largest drawdown (after October) at -14.56%, which compares unfavorably to the other months' minimums which seem to hover around -10%.

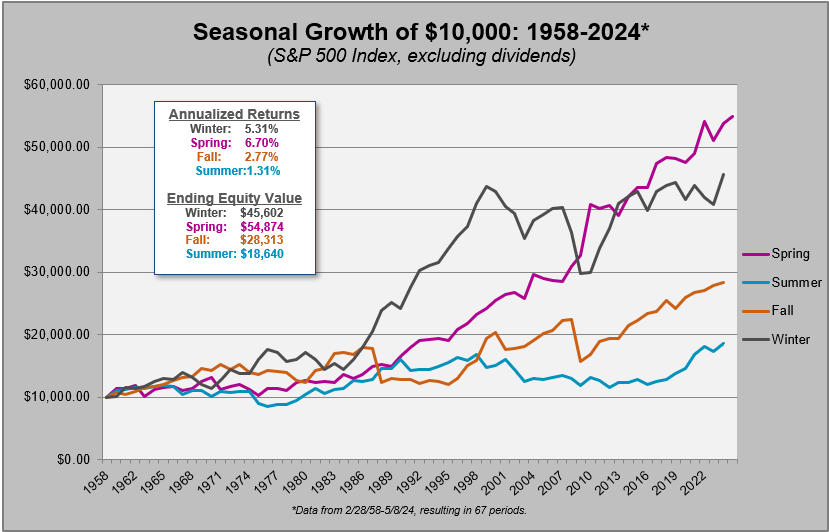
To take this concept one step further, we looked at four hypothetical portfolios specific to each of the four seasons. Defined as follows:
Winter Portfolio Dates: 11/30 - 2/28
Spring Portfolio Dates: 2/28 - 5/31
Summer Portfolio Dates: 5/31 - 8/31
Fall Portfolio Dates: 8/31 – 11/30
The end result? The summer portfolio greatly underperformed the other three seasons - fall, winter, and spring. If you were to invest only during the spring months (March through May), the initial investment would have had a cumulative return of nearly 450% from 1958 through April of 2024 (since May has not yet completed), with an annualized return of 6.70%, making it the best performing seasonal portfolio. The winter portfolio deserves an honorable mention because it produced a gain of over 350% during the study period. The point of the graph below is to show that the summer months paled in comparison to the others, gaining just 86% since 1958 - that results in an annualized rate of return of only 1.3%.
There have been exceptions along the way (like last summer when the S&P gained nearly 8% before a September/October swoon that saw it give back nearly all its summer gains), but the Summertime Blues have been a common occurrence for market participants over the last 60 years and the summer months have occasionally produced some significant down markets, like 2022. However, this does not mean that we should all simply go to cash at the end of every spring - faced between the summer market return or earning nothing by going to cash, on average, investors have ultimately been better off by taking the market return.

Check out this week's Group Score Overview (3:42).
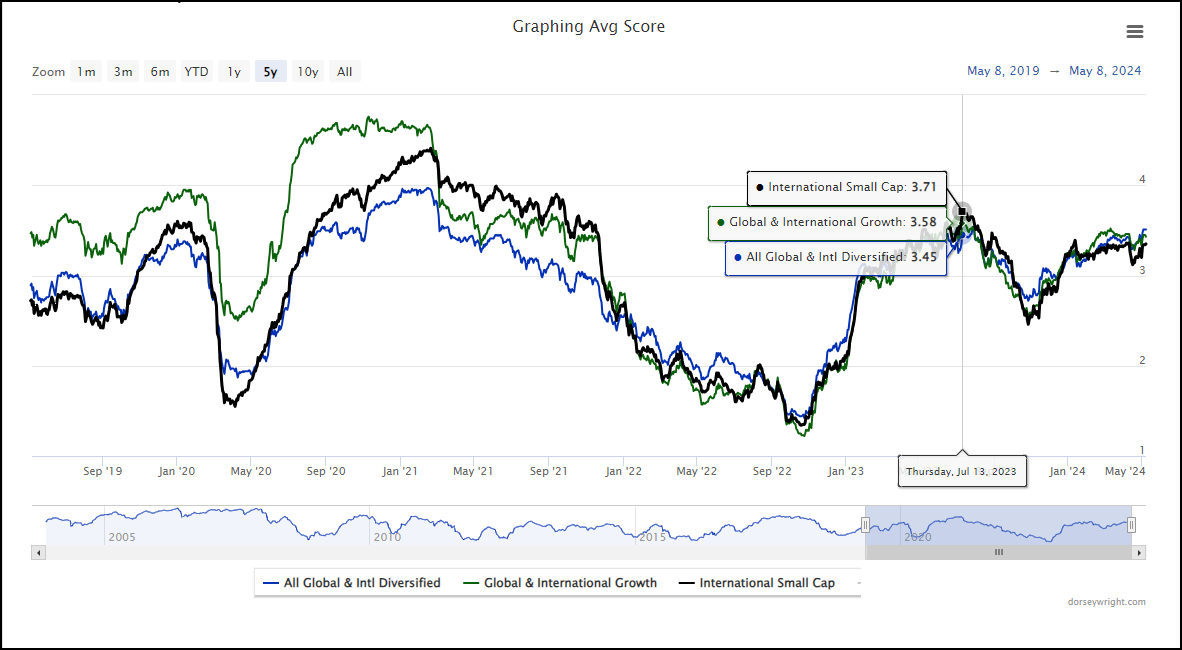
Through Q2 2024, international equities have been slightly better than their domestic equity counterparts with the iShares MSCI ACWI ex-US ETF ACWX up 45 basis points, while the SPDR S&P 500 Trust SPY is down -1.27%. Emerging Markets have led the way for the broader international space with the iShares MSCI Emerging Markets ETF EEM adding 2.92% so far in Q2, with much of that having come in May as EEM has gained 3.15%. As noted in the International Equity Overview in yesterday’s report, China has recently improved off of its historic lows from earlier this year.
This improvement in emerging markets, primarily China, along with sustained strength within developed markets has provided a boost in the average scores for international equity groups. The All Global & International Diversified group has seen its average score improve above the 3.5 mark and match the July 2023 score high. The group hasn’t seen scores eclipse this level since the latter part of 2021. This also was the last time the All Global & International Diversified group was near the 4 score threshold. Bear in mind, that the only time within the past decade that the All Global & International Diversified group scored above 4 was for a few weeks in August and September 2017, so the 4 threshold has tended to act as somewhat of a ceiling.
Except for Latin America, the leadership near the top of the Non-US view on the Asset Class Group Scores page is similar when compared to last year when the Global & International Diversified group was at these score levels. China’s improvement and its impact on the emerging market space is the difference in story this time around. Looking back to the last time the Global & International Diversified group was near the 4 threshold in February 2021 reveals that China was the leading international group, scoring above 5 at the time. Meanwhile, Non-US was scoring above the 4 threshold and Emerging Markets at 4.6.

Just behind All Global & International Diversified within the Non-US View of the Asset Class Group Scores page are the Global & International Growth and International Small Cap groups. Though both groups are slightly below their 2023 highs, their scores are above the acceptable 3 threshold for exposure, but they are also groups to monitor. As their score history shows, they tend to mirror each other along with the All Global & International Diversified group well. The international growth and small cap groups have been among those that can signal healthy environments for broader international equities. When they are able to score well (average score >3) and above the All Global & International Diversified there has been potential opportunity within the international space.
With the broader international equity space showing positive developments, the asset class continues to deserve an allocation within client portfolios. Below are a couple of funds that could be considered.
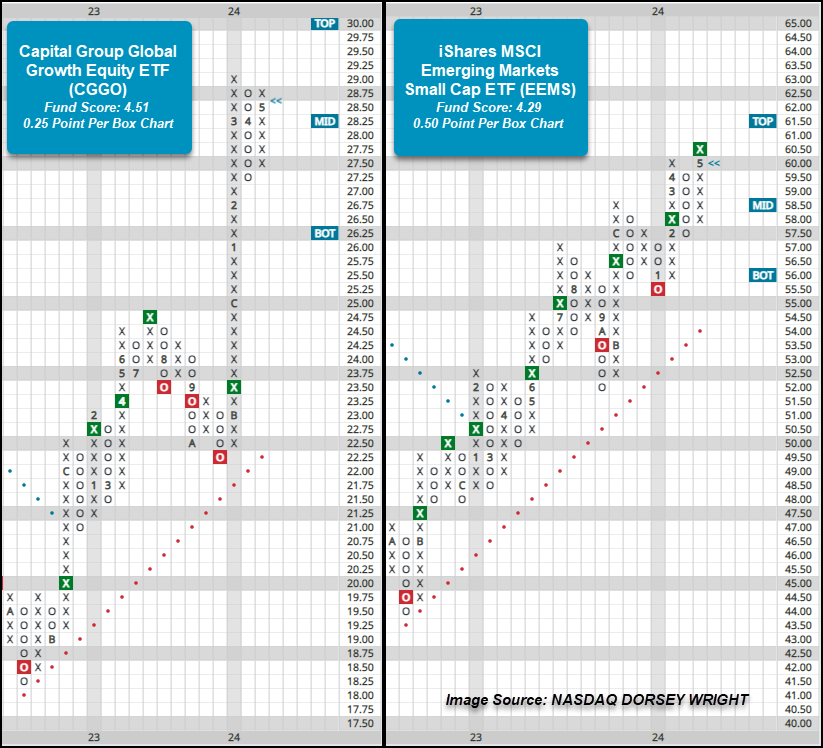
With domestic equities still holding leadership over international, but both showing relative leadership, global funds could be added to an allocation to participate in both. Among the ETFs that could be considered is the Capital Group Global Growth Equity ETF CGGO, which possesses a strong 4.51 fund score, a full point higher than the average score for a global equity fund. On the 0.25 point per box chart below, CGGO has been in a positive trend since the latter part of 2022 and has maintained a buy signal since November of last year. Following a move straight higher to an all-time high at $29 in March, the fund has since pulled back to establish near-term support at $27.75 before rallying back into the upper-$28 range with May’s action. From here, a move above the $29.25 level would mark a second buy signal and a new high. Those seeking global exposure can consider CGGO in the $27.50 to $29 range. Beyond support at $27.25, prior resistance at $24.75 may be seen as an additional level of support.
With emerging markets showing near-term improvement and the international small cap space scoring well, the iShares MSCI Emerging Markets Small Cap ETF EEMS could also be considered. The fund possesses a current score of 4.29, which is almost a full point higher than the average score for an emerging markets fund (3.33). On the default chart, EEMS has maintained a positive trend since June 2020 and a buy signal since November 2022, with the most recent being a double top break at $58 in December 2023. On the more sensitive chart, the positive trend has been in place since January last year and the fund has maintained a buy signal since February of this year. Action last week saw the fund give a second buy signal at $60.50 to mark a new 52-week chart high and a level that hasn’t been seen since the latter part of 2021. Those who may be seeking exposure to emerging markets, including China, can consider EEMS here. Initial support on the 0.50 point per box chart lies at $57.50, while additional can be found at $55.50 and $54, the bullish support line.
Average Level
5.74
| < - -100 | -100 - -80 | -80 - -60 | -60 - -40 | -40 - -20 | -20 - 0 | 0 - 20 | 20 - 40 | 40 - 60 | 60 - 80 | 80 - 100 | 100 - > |
|---|---|---|---|---|---|---|---|---|---|---|---|
|
Buy signalhyg
|
|||||||||||
|
Buy signalrsp
|
|||||||||||
|
Sell signaliwm
|
|||||||||||
|
Buy signalVOOV
|
|||||||||||
|
Buy signalQQQ
|
|||||||||||
|
Buy signaldia
|
|||||||||||
|
Buy signaltlt
|
Buy signalIJH
|
Buy signalXLG
|
|||||||||
|
Sell signalicf
|
Buy signalagg
|
Buy signalijr
|
Buy signalefa
|
||||||||
|
Buy signalief
|
Sell signalfxe
|
Buy signaloneq
|
Buy signalgcc
|
||||||||
|
Buy signalshy
|
Sell signallqd
|
Buy signalspy
|
Buy signaldx/y
|
Buy signaldvy
|
|||||||
|
Buy signalUSO
|
Buy signalgsg
|
Buy signalvoog
|
Buy signalgld
|
Buy signaleem
|
|||||||
| < - -100 | -100 - -80 | -80 - -60 | -60 - -40 | -40 - -20 | -20 - 0 | 0 - 20 | 20 - 40 | 40 - 60 | 60 - 80 | 80 - 100 | 100 - > |
| AGG | iShares US Core Bond ETF |
| USO | United States Oil Fund |
| DIA | SPDR Dow Jones Industrial Average ETF |
| DVY | iShares Dow Jones Select Dividend Index ETF |
| DX/Y | NYCE U.S.Dollar Index Spot |
| EFA | iShares MSCI EAFE ETF |
| FXE | Invesco CurrencyShares Euro Trust |
| GLD | SPDR Gold Trust |
| GSG | iShares S&P GSCI Commodity-Indexed Trust |
| HYG | iShares iBoxx $ High Yield Corporate Bond ETF |
| ICF | iShares Cohen & Steers Realty ETF |
| IEF | iShares Barclays 7-10 Yr. Tres. Bond ETF |
| LQD | iShares iBoxx $ Investment Grade Corp. Bond ETF |
| IJH | iShares S&P 400 MidCap Index Fund |
| ONEQ | Fidelity Nasdaq Composite Index Track |
| QQQ | Invesco QQQ Trust |
| RSP | Invesco S&P 500 Equal Weight ETF |
| IWM | iShares Russell 2000 Index ETF |
| SHY | iShares Barclays 1-3 Year Tres. Bond ETF |
| IJR | iShares S&P 600 SmallCap Index Fund |
| SPY | SPDR S&P 500 Index ETF Trust |
| TLT | iShares Barclays 20+ Year Treasury Bond ETF |
| GCC | WisdomTree Continuous Commodity Index Fund |
| VOOG | Vanguard S&P 500 Growth ETF |
| VOOV | Vanguard S&P 500 Value ETF |
| EEM | iShares MSCI Emerging Markets ETF |
| XLG | Invesco S&P 500 Top 50 ETF |

| Symbol | Company | Sector | Current Price | Action Price | Target | Stop | Notes |
|---|---|---|---|---|---|---|---|
| KRG | Kite Realty Group Trust | Real Estate | $21.22 | 19 - 21 | 34.50 | 16 | 5 for 5'er, 11 of 113 in REAL sector matrix, LT pos mkt RS, spread quintuple top, 4.65% yield |
| OEC | Orion SA | Chemicals | $24.48 | 22 - 24 | 45.50 | 19 | 4 for 5'er, top third of CHEM sector matrix, LT pos mkt RS, spread quad top, R-R>5 |
| CCEP | Coca-Cola Europacific Partners PLC | Food Beverages/Soap | $73.52 | 60s | 97 | 56 | 5 for 5'er, top 25% of FOOD sector matrix, spread quad top, R-R~3.0, 3% yield |
| CXT | Crane NXT Co. | Electronics | $61.98 | hi 50s - low 60s | 76 | 48 | Top half of MACH sector matrix, bullish catapult |
| MMC | Marsh & McLennan Companies, Inc. | Insurance | $203.59 | 190s - low 200s | 234 | 180 | 5 for 5'er, favored INSU sector, LT pos mkt RS, quad top breakout, 1.4% yield |
| HRB | H&R Block, Inc. | Business Products | $48.53 | mid 40s - lo 50s | 71 | 39 | 5 TA rating, top 33% of BUSI sector matrix, LT pos trend, LT pos. mkt. RS, buy-on-pullback, R-R > 2, Earn. 5/9 |
| RPM | RPM, Inc. | Chemicals | $112.66 | mid 100s - hi 110s | 159 | 91 | 5 TA rating, LT RS buy, consec. buy signals, top 50% of CHEM sector matrix, buy-on-pullback, R-R > 2 |
| CI | CIGNA Group/The | Insurance | $347.35 | 332 - lo 360s | 428 | 288 | 5 TA rating, top half of INSU sector matrix, LT RS buy, buy-on-pullback |
| BAH | Booz Allen Hamilton Holding | Business Products | $151.07 | 140s | 193 | 114 | 5 for 5'er, top 25% of favored BUSI sector matrix, LT pos peer RS, pullback from ATH, 1.5% yield, Earn. 5/24 |
| GBX | The Greenbrier Companies, Inc. | Transports/Non Air | $52.82 | hi 40s - low 50s | 87 | 43 | 5 for 5'er, top 20% of favored TRAN sector matrix, pullback from multi-year high, R-R>4.0, 2.3% yield |
| JPM | J.P. Morgan Chase & Co. | Banks | $195.65 | lo 180s - hi 190s | 258 | 148 | 5 TA rating, RS buy, top 10% of BANK sector matrix, consec. buy signals |
| WSM | Williams-Sonoma, Inc. | Retailing | $304.92 | 280s - 290s | 362 | 232 | 5 for 5'er, #2 of 84 in RETA sector matrix, multi buy signals, pullback from ATH, 1.6% yield, Earn. 5/21 |
| PSTG | Pure Storage | Semiconductors | $53.45 | $49 to $58 | $74 | $38 | 5 for 5'er, pos. trend since June 2023, ranks 3rd in Semiconductors sector matrix. Earnings 5/29. |
| ORCL | Oracle Corporation | Software | $117.39 | 110s - low 120s | 150 | 99 | 4 for 5'er, top half of SOFT sector matrix. LT pos mkt RS, spread triple top, pullback from ATH, 1.4% yield |
| AMP | Ameriprise Financial | Finance | $425.94 | 390s - 410s | 532 | 368 | 5 for 5'er, top half of FINA sector matrix, LT pos peer & mkt RS, triple top, pullback from ATH, 1.4% yield |
| LIN | Linde Plc | Chemicals | $427.71 | hi 410s - lo 460s | 572 | 360 | 5 TA rating, consec. buy signals, LT RS buy, buy-on-pullback |
| OMF | OneMain Holdings Inc. | Finance | $51.65 | hi 40s - low 50s | 81 | 43 | 5 for 5'er, top half of FINA sector matrix, LT pos mkt RS, multiple buy signals, R-R>3.0, 7.9% yield |
| DHI | D.R. Horton, Inc. | Building | $147.74 | mid 140s - 150s | 178 | 134 | 5 for 5'er, favored BUIL sector, LT pos peer RS, bearish signal reversal |
| LPLA | LPL Investment Holdings Inc | Finance | $267.03 | hi 250s - lo 280s | 348 | 228 | 4 TA rating, top half FINA sector matrix, LT RS buy, consec. buy signals, recent pos. wkly. mom. |
| HLI | Houlihan Lokey Inc | Banks | $132.89 | 120s - low 130s | 177 | 110 | 5 for 5'er, 14 of 122 in BANK sector matrix, LT pos mkt RS, spread triple top, R-R>2.0, 1.6% yield |
| MAX | MediaAlpha, Inc. Class A | Internet | $19.99 | 18 - lo 20s | 39.50 | 16.25 | 5 TA rating, top quintile of INET sector matrix, pullback from ATH, R-R > 3 |
| Symbol | Company | Sector | Current Price | Action Price | Target | Stop | Notes |
|---|---|---|---|---|---|---|---|
| MTCH | Match Group, Inc. | Internet | $29.82 | (mid 30s) | 26 | 40 | 0 for 5'er, bottom half of INET sector matrix, LT neg trend & RS |
| MRVL | Marvell Technology Inc. | Semiconductors | $68.11 | (70 - 65) | 51 | 77 | 2 for 5'er, middle of unfavored SEMI sector matrix, spread quad bottom, Earn 5/23 |
| Symbol | Company | Sector | Current Price | Action Price | Target | Stop | Notes |
|---|---|---|---|---|---|---|---|
| REVG | REV Group Inc | Autos and Parts | $25.03 | 33.50 | 17.50 | REVG moved into overbought territory. We will raise our stop to $17.50. |
| Comment | |||||||
|---|---|---|---|---|---|---|---|
|
|
|||||||
MAX MediaAlpha, Inc. Class A ($20.18) R - Internet - MAX has a 5 for 5 TA rating and sits in the top quintile of the internet sector RS matrix. The stock has maintained an RS buy signal since last October and moved to a positive trend in December. Earlier this month, MAX moved to a new multi-year high at $25 before pulling back to the current position near $20. The weight of the long-term technical evidence remains positive, offering a more opportune entry point for those looking to add exposure. Long investors may consider MAX from $18 to the low $20s. Our initial stop will be positioned at $16.25, which would violate all support built up this year on more sensitive chart scales. The bullish price objective of $39.50 will serve as our price target, offering a reward-to-risk ratio north of 3-to-1.
| 22 | 23 | 24 | ||||||||||||||||||||||||||||||||||||||||||||||||||
| 25.00 | • | X | 25.00 | |||||||||||||||||||||||||||||||||||||||||||||||||
| 24.00 | • | X | O | 24.00 | ||||||||||||||||||||||||||||||||||||||||||||||||
| 23.00 | • | X | O | 23.00 | ||||||||||||||||||||||||||||||||||||||||||||||||
| 22.00 | • | X | 5 | O | 22.00 | |||||||||||||||||||||||||||||||||||||||||||||||
| 21.00 | • | X | O | X | X | X | O | 21.00 | ||||||||||||||||||||||||||||||||||||||||||||
| 20.00 | • | X | X | O | X | O | X | O | X | O | Mid | 20.00 | ||||||||||||||||||||||||||||||||||||||||
| 19.50 | • | X | O | X | 3 | X | O | X | O | X | 19.50 | |||||||||||||||||||||||||||||||||||||||||
| 19.00 | • | X | O | X | O | 4 | X | O | X | 19.00 | ||||||||||||||||||||||||||||||||||||||||||
| 18.50 | • | X | O | O | X | O | X | 18.50 | ||||||||||||||||||||||||||||||||||||||||||||
| 18.00 | O | • | X | O | O | 18.00 | ||||||||||||||||||||||||||||||||||||||||||||||
| 17.50 | O | • | • | X | 17.50 | |||||||||||||||||||||||||||||||||||||||||||||||
| 17.00 | O | 4 | • | X | • | X | 17.00 | |||||||||||||||||||||||||||||||||||||||||||||
| 16.50 | O | X | X | 1 | X | O | X | O | • | X | 16.50 | |||||||||||||||||||||||||||||||||||||||||
| 16.00 | O | X | O | X | O | X | X | O | X | O | X | O | • | X | 16.00 | |||||||||||||||||||||||||||||||||||||
| 15.50 | O | X | O | X | O | X | O | X | O | X | X | O | X | O | • | X | 15.50 | |||||||||||||||||||||||||||||||||||
| 15.00 | O | X | C | X | O | X | O | X | O | X | O | X | O | X | X | O | X | • | X | 15.00 | ||||||||||||||||||||||||||||||||
| 14.50 | O | O | O | X | O | O | X | O | X | 3 | X | 5 | X | O | 2 | 3 | X | O | • | X | 14.50 | |||||||||||||||||||||||||||||||
| 14.00 | O | X | O | O | X | O | X | O | X | O | X | O | X | O | X | O | • | X | 14.00 | |||||||||||||||||||||||||||||||||
| 13.50 | O | X | O | X | O | X | O | X | O | X | O | X | O | 4 | • | 2 | • | Bot | 13.50 | |||||||||||||||||||||||||||||||||
| 13.00 | O | O | 2 | X | O | X | O | X | O | X | O | • | X | • | 13.00 | |||||||||||||||||||||||||||||||||||||
| 12.50 | O | X | O | O | X | X | O | X | O | • | X | • | 12.50 | |||||||||||||||||||||||||||||||||||||||
| 12.00 | O | X | O | X | O | X | O | C | X | O | • | 1 | • | 12.00 | ||||||||||||||||||||||||||||||||||||||
| 11.50 | O | X | O | X | O | B | O | X | O | X | O | • | X | • | 11.50 | |||||||||||||||||||||||||||||||||||||
| 11.00 | O | X | O | 7 | 8 | X | O | X | O | X | 1 | O | X | • | X | • | 11.00 | |||||||||||||||||||||||||||||||||||
| 10.50 | O | O | X | O | X | O | O | X | O | X | • | O | 7 | O | X | X | X | C | • | 10.50 | ||||||||||||||||||||||||||||||||
| 10.00 | O | X | O | A | O | X | O | X | • | O | X | 6 | O | X | O | X | O | X | O | X | • | 10.00 | ||||||||||||||||||||||||||||||
| 9.50 | O | X | O | 9 | O | • | O | • | O | X | O | X | O | X | O | A | O | X | O | X | • | 9.50 | ||||||||||||||||||||||||||||||
| 9.00 | 6 | X | O | X | • | • | • | O | X | O | X | 8 | O | X | O | • | B | • | 9.00 | |||||||||||||||||||||||||||||||||
| 8.50 | O | O | X | • | O | X | O | O | X | • | • | 8.50 | ||||||||||||||||||||||||||||||||||||||||
| 8.00 | O | • | O | X | 9 | • | 8.00 | |||||||||||||||||||||||||||||||||||||||||||||
| 7.50 | • | O | X | • | • | 7.50 | ||||||||||||||||||||||||||||||||||||||||||||||
| 7.00 | O | X | • | 7.00 | ||||||||||||||||||||||||||||||||||||||||||||||||
| 6.50 | O | X | • | 6.50 | ||||||||||||||||||||||||||||||||||||||||||||||||
| 6.00 | 5 | X | • | 6.00 | ||||||||||||||||||||||||||||||||||||||||||||||||
| 5.50 | O | • | 5.50 | |||||||||||||||||||||||||||||||||||||||||||||||||
| 22 | 23 | 24 |
| ABNB Airbnb, Inc. Class A ($147.57) - Leisure - ABNB broke a triple bottom at $152 to return the stock to a sell signal as it fell to $146 on the chart. The move also violates the bullish support line for the stock, which will drop it to a 4 for 5'er trading in a negative trend. Depending on the cost basis, holders of ABNB may seek to lighten up, while most are likely to hold here as the stock resides at support. Additional support lies in the $142 to $144 range, while the January 2023 chart low resides at $132. |
| CAT Caterpillar, Inc. ($352.12) - Machinery and Tools - CAT moved higher today, returning to a buy signal on its default chart. This continues what has been a productive 2024 campaign for this perfect 5/5'er, now with an established line of support around $332. While recent action does leave it with a couple of layers of resistance above (including all-time highs at $380), the path of least resistance looks to be lower for now. |
| CNC Centene Corporation ($77.65) - Healthcare - CNC shares moved higher today to break a double top at $77 to mark its first buy signal and return to a positive trend. This 5 for 5'er has been on an RS buy signal versus the market since March 2020. CNC shares are trading in actionable territory with a weekly overbought/oversold reading of 0%. From here, support is offered at $71. |
| H Hyatt Hotels Corp. ($151.74) - Leisure - H broke a double bottom at $144 as the stock fell to $140. This marks the first sell signal of 2024 for the stock, and it still maintains a 5 attribute rating and ranks within the top quintile of the Leisure sector matrix. Short to intermediate term holders may seek to lighten up or exit exposure depending on cost basis. Long-term holders are likely to continue to hold. From here, support now lies at $126 on the default chart. Support on the more sensitive 1 point per box chart can be found at $132. |
| USFD US Foods Holding Corp. ($54.63) - Food Beverages/Soap - USFD shares rallied after an upbeat earnings report. The stock has been a 5 for 5'er since January 2023 and now trades at all-time highs. The weight of the technical evidence is positive and the stock is actionable at current levels. Support is offered around $50. |
| W Wayfair Inc. ($73.33) - Retailing - W broke a double top at $70 for a second buy signal this month as the stock rallied to a near-term high at $73. Prior to the breakout, W moved back into a column of Xs on its market RS chart following last Friday's action and shifted to a positive trend during Monday's trading. The stock is now a 5 for 5'er that ranks in the top quartile of the Retailing sector matrix. Okay to consider here on the breakout or on a pullback to $70. Initial support lies at $66, while the bullish support line sits at $52. |
| Name | Option Symbol | Action | Stop Loss |
|---|---|---|---|
| Cardinal Health, Inc. - $98.19 | CAH2420I97.5 | Buy the September 97.50 calls at 6.40 | 93.00 |
| Name | Option | Action |
|---|---|---|
| Ross Stores, Inc. ( ROST) | Jul. 130.00 Calls | Raise the option stop loss to 7.30 (CP: 9.30) |
| Name | Option Symbol | Action | Stop Loss |
|---|---|---|---|
| Duke Energy Corporation - $102.69 | DUK2418V100 | Buy the October 100.00 puts at 3.20 | 108.00 |
| Name | Option | Action |
|---|---|---|
| Las Vegas Sands Corp. ( LVS) | Jun. 52.50 Puts | Stopped at 5.00 (CP: 4.70) |
| Archer-Daniels-Midland Company ( ADM) | Sep. 62.50 Puts | Stopped at 3.30 (CP: 3.30) |
| Dollar General Corp. ( DG) | Aug. 140.00 Puts | Stopped at 9.05 (CP: 8.45) |
| Name | Option Sym. | Call to Sell | Call Price | Investment for 500 Shares | Annual Called Rtn. | Annual Static Rtn. | Downside Protection |
|---|---|---|---|---|---|---|---|
| Lennar Corporation $ 158.47 | LEN2416H165 | Aug. 165.00 | 8.80 | $ 76,716.70 | 23.94% | 17.08% | 4.43% |
| Name | Action |
|---|---|
| DraftKings Inc Class A ( DKNG) - 42.81 | Sell the July 45.00 Calls. |
| United Airlines Holdings Inc. ( UAL) - 53.02 | Sell the August 55.00 Calls. |
| Palantir Technologies Inc. Class A ( PLTR) - 21.56 | Sell the August 23.00 Calls. |
| Micron Technology, Inc. ( MU) - 119.32 | Sell the August 115.00 Calls. |
| Royal Caribbean Cruises Ltd. ( RCL) - 141.68 | Sell the September 145.00 Calls. |
| Palantir Technologies Inc. Class A ( PLTR) - 21.56 | Sell the August 22.00 Calls. |
| Name | Covered Write |
|---|---|
| Lyft Inc Class A ( LYFT - 17.78 ) | July 20.00 covered write. |
| Airbnb, Inc. Class A ( ABNB - 157.90 ) | September 170.00 covered write. |
| Comerica Incorporated ( CMA - 53.88 ) | September 55.00 covered write. |
Daily Equity & Market Analysis
Loading, Please Wait...
