Thanks to May's action, international equities have fared slightly better than their domestic counterparts in Q2 so far.
Check out this week's Group Score Overview (3:42).
Through Q2 2024, international equities have been slightly better than their domestic equity counterparts with the iShares MSCI ACWI ex-US ETF ACWX up 45 basis points, while the SPDR S&P 500 Trust SPY is down -1.27%. Emerging Markets have led the way for the broader international space with the iShares MSCI Emerging Markets ETF EEM adding 2.92% so far in Q2, with much of that having come in May as EEM has gained 3.15%. As noted in the International Equity Overview in yesterday’s report, China has recently improved off of its historic lows from earlier this year.
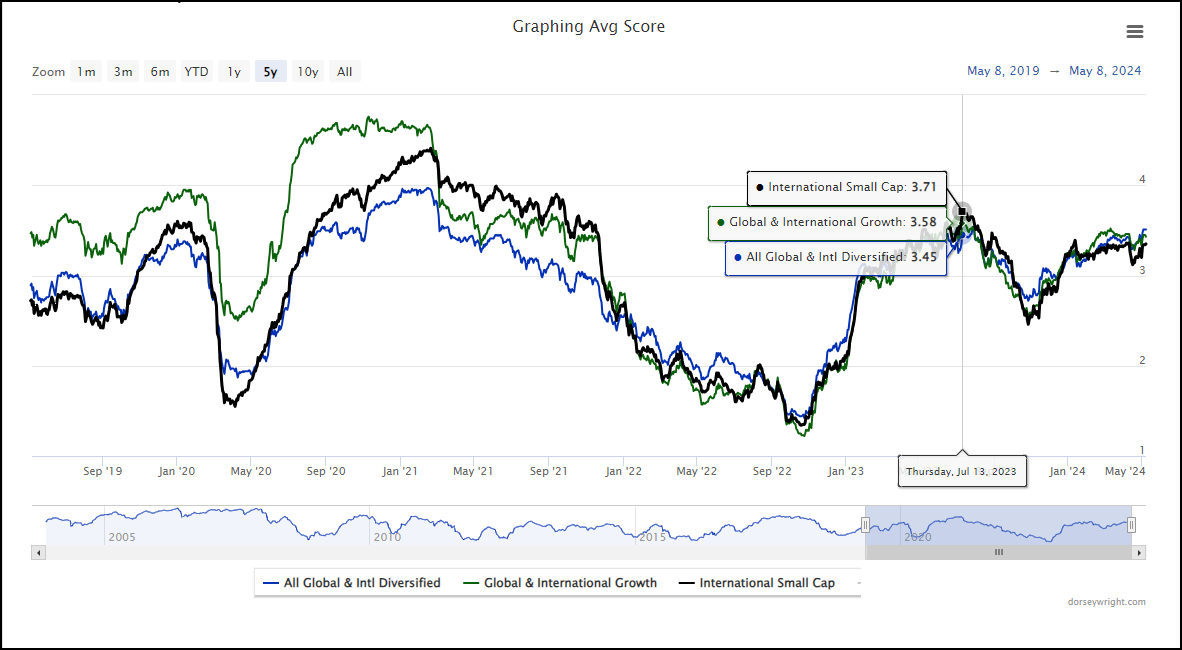
This improvement in emerging markets, primarily China, along with sustained strength within developed markets has provided a boost in the average scores for international equity groups. The All Global & International Diversified group has seen its average score improve above the 3.5 mark and match the July 2023 score high. The group hasn’t seen scores eclipse this level since the latter part of 2021. This also was the last time the All Global & International Diversified group was near the 4 score threshold. Bear in mind, that the only time within the past decade that the All Global & International Diversified group scored above 4 was for a few weeks in August and September 2017, so the 4 threshold has tended to act as somewhat of a ceiling.
Except for Latin America, the leadership near the top of the Non-US view on the Asset Class Group Scores page is similar when compared to last year when the Global & International Diversified group was at these score levels. China’s improvement and its impact on the emerging market space is the difference in story this time around. Looking back to the last time the Global & International Diversified group was near the 4 threshold in February 2021 reveals that China was the leading international group, scoring above 5 at the time. Meanwhile, Non-US was scoring above the 4 threshold and Emerging Markets at 4.6.

Just behind All Global & International Diversified within the Non-US View of the Asset Class Group Scores page are the Global & International Growth and International Small Cap groups. Though both groups are slightly below their 2023 highs, their scores are above the acceptable 3 threshold for exposure, but they are also groups to monitor. As their score history shows, they tend to mirror each other along with the All Global & International Diversified group well. The international growth and small cap groups have been among those that can signal healthy environments for broader international equities. When they are able to score well (average score >3) and above the All Global & International Diversified there has been potential opportunity within the international space.
With the broader international equity space showing positive developments, the asset class continues to deserve an allocation within client portfolios. Below are a couple of funds that could be considered.
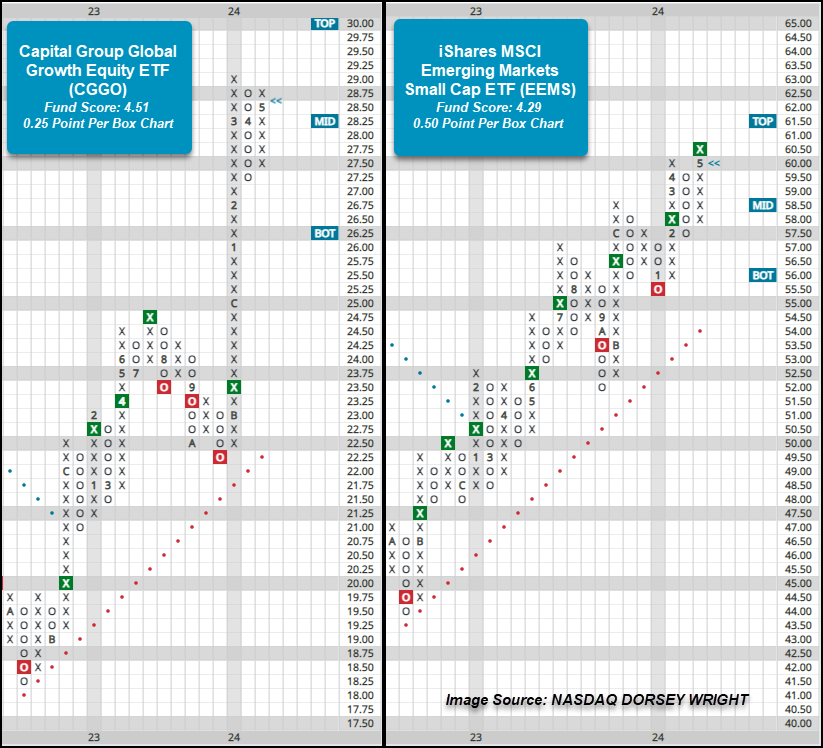
With domestic equities still holding leadership over international, but both showing relative leadership, global funds could be added to an allocation to participate in both. Among the ETFs that could be considered is the Capital Group Global Growth Equity ETF CGGO, which possesses a strong 4.51 fund score, a full point higher than the average score for a global equity fund. On the 0.25 point per box chart below, CGGO has been in a positive trend since the latter part of 2022 and has maintained a buy signal since November of last year. Following a move straight higher to an all-time high at $29 in March, the fund has since pulled back to establish near-term support at $27.75 before rallying back into the upper-$28 range with May’s action. From here, a move above the $29.25 level would mark a second buy signal and a new high. Those seeking global exposure can consider CGGO in the $27.50 to $29 range. Beyond support at $27.25, prior resistance at $24.75 may be seen as an additional level of support.
With emerging markets showing near-term improvement and the international small cap space scoring well, the iShares MSCI Emerging Markets Small Cap ETF EEMS could also be considered. The fund possesses a current score of 4.29, which is almost a full point higher than the average score for an emerging markets fund (3.33). On the default chart, EEMS has maintained a positive trend since June 2020 and a buy signal since November 2022, with the most recent being a double top break at $58 in December 2023. On the more sensitive chart, the positive trend has been in place since January last year and the fund has maintained a buy signal since February of this year. Action last week saw the fund give a second buy signal at $60.50 to mark a new 52-week chart high and a level that hasn’t been seen since the latter part of 2021. Those who may be seeking exposure to emerging markets, including China, can consider EEMS here. Initial support on the 0.50 point per box chart lies at $57.50, while additional can be found at $55.50 and $54, the bullish support line.