
In this Macro Update from the Nasdaq Economic Research Team, US Economist Michael Normyle discusses the latest trends in inflation.
Inflation has risen from 3.1% YoY to 3.5% this year
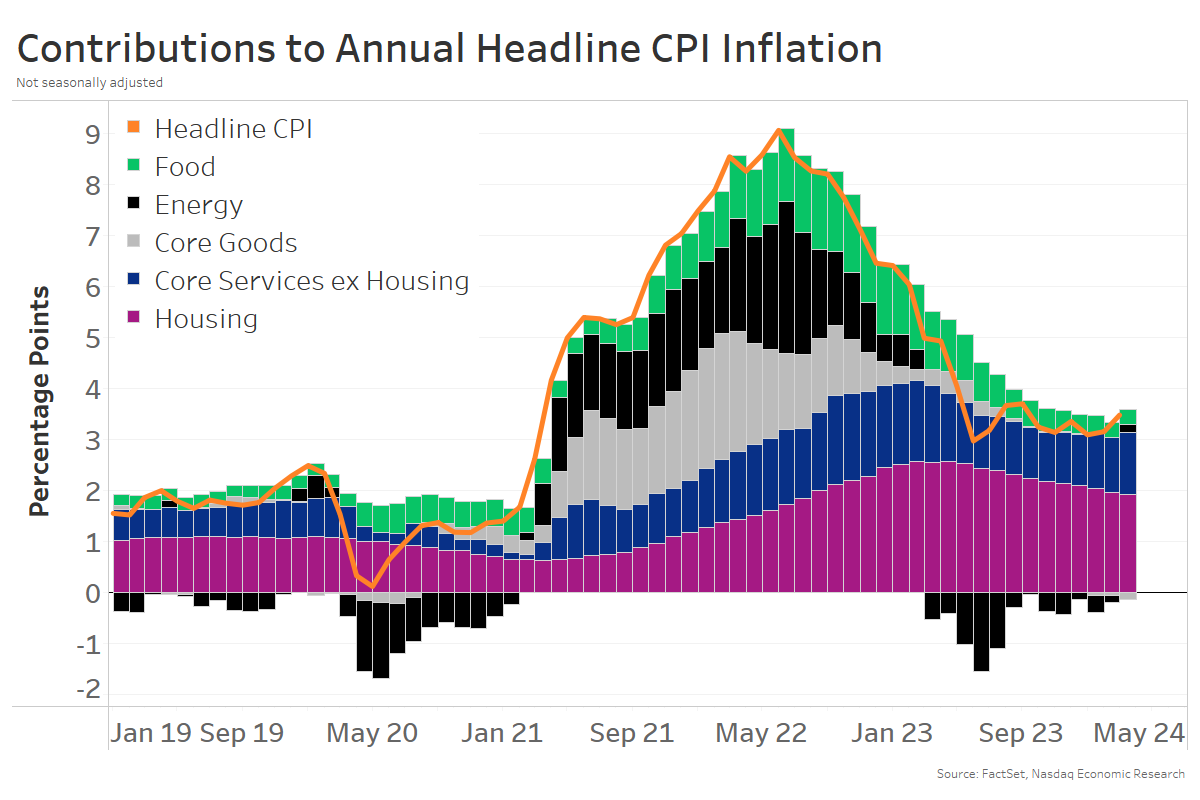
It’s been a tough start to the year for inflation. Headline CPI inflation was as low as 3.1% YoY, but it’s since risen to 3.5% (chart below, orange line) – that’s exactly the opposite of what the Fed’s wanted to see. Which is partly why Fed rate cuts have been postponed, and long-term bond yields have risen (again).
Next week we get an update to CPI, and it’s expected to remain at 3.5% YoY.
Most categories of inflation have normalized (Energy, Core Goods, Food)
This is despite the fact that most categories of inflation have slowed materially.
- Energy inflation has been negative for 12 of the last 13 months (chart below, black bars)
- Core goods inflation has been around 0% YoY for eight months (grey bars)
- Food inflation is back near 2% YoY (green bars)
So the blame for sticky inflation lays with housing (purple bars) and core services ex-housing (blue bars). Sound familiar?
Sticky inflation coming from lagged effects of Covid-era inflation in insurance and housing
Believe it or not, much of the remaining inflation is still Covid-related!
That’s because a lot of the recent drivers of core services and housing inflation are due to the lagged effects of Covid-era inflation (the good news is that means inflation isn’t reaccelerating).
During Covid, those categories saw significant increases in market prices and/or input costs, which have now slowed. But consumer prices are still catching up.
Covid-era car inflation set off waves of inflation in parts, repairs, and now insurance
Take cars and cars-related inflation, for example.
Chips shortages led to increases in new car prices and pushed buyers into the used car market. New and used car inflation peaked in early 2022 at nearly 25% YoY – adding close to 2% to headline inflation at its peak (chart below, light grey bars). Even though car price inflation has since normalized – hovering around 0% YoY for more than a year – the level of car prices is still 25% higher than pre-Covid.
Those more expensive cars set off waves of related inflation:
- First, Car parts inflation peaked in mid-2022 at 15% YoY (dark grey bars)
- That made Car repair and maintenance inflation peak in early 2023 near 15% YoY (light blue bars)
- Eventually, Car insurers realized they needed to raise prices to cover costs. Car insurance may be yet to peak, with its inflation rate now over 20% YoY (dark blue bars)
These lagged effects are still adding over ½% to CPI, even though cars themselves have added nothing to inflation for the last year. Although fortunately, the waves have crested for car prices, parts, and repairs already. So once that gets built into insurance, that inflation should fall too.

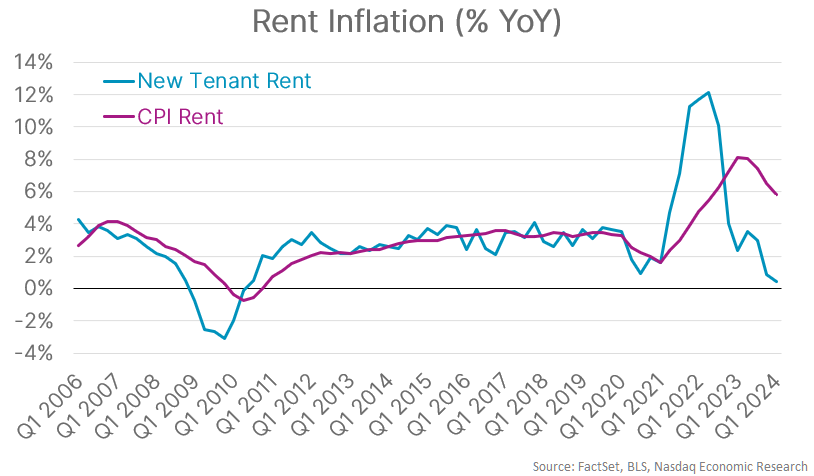
New rents inflation peaked two years ago, but CPI rent inflation is a year behind
The story is similar in housing. New rent inflation (looking just at new lease prices each quarter) peaked in Q2 2022 at 12% YoY, but has since fallen to 0.4% p.a. (chart below, blue line).
But the CPI measure of rents (chart below, purple line) has been much slower to fall. That’s partly because it’s a sample of all rents – not just newly signed or renewed leases.
The short story here though, is that rents also seem more likely to fall in the future too.
Even though inflation has been sticky – the underlying data says it’s still falling
So, even though inflation has proven stickier than hoped, underlying data shows that inflation is not picking back up broadly. It’s just that Covid-era inflation still (!) hasn’t fully worked its way out of CPI.
That means disinflation will (eventually) continue. And that in turn will enabling the Fed to start cutting rates this year.
Better late than never…
