
Leaders lead, and laggards lag. That is… until they don’t
Beginners Series Webinar: Join us on Friday, May 10th at 2 PM (ET) for our NDW Beginners Series Webinar. This week's topic is: Navigating the Models Page Register Here
Leaders lead, and laggards lag. That is… until they don’t. Of course, every investment manager’s dream is finding the magic key that tells you when trends are shifting, but that is often much easier said than done. How can one tell if bounces for these laggards are “legit” or not? With hindsight as a guide things become a lot clearer, but in the moment finding what is real and what isn’t is filled with FOMO (for non-holders) and sell on rally calls (for holders.) Momentum is content leaving gains on the table, with the hopes that this can be counteracted by prolonged strength for the investment in question. Said more concisely, buy high, sell higher is a phrase said often around the NDW think tank. But of course, not every rally is going to be “the one”, so creating a formula to help identify strong trends is paramount.
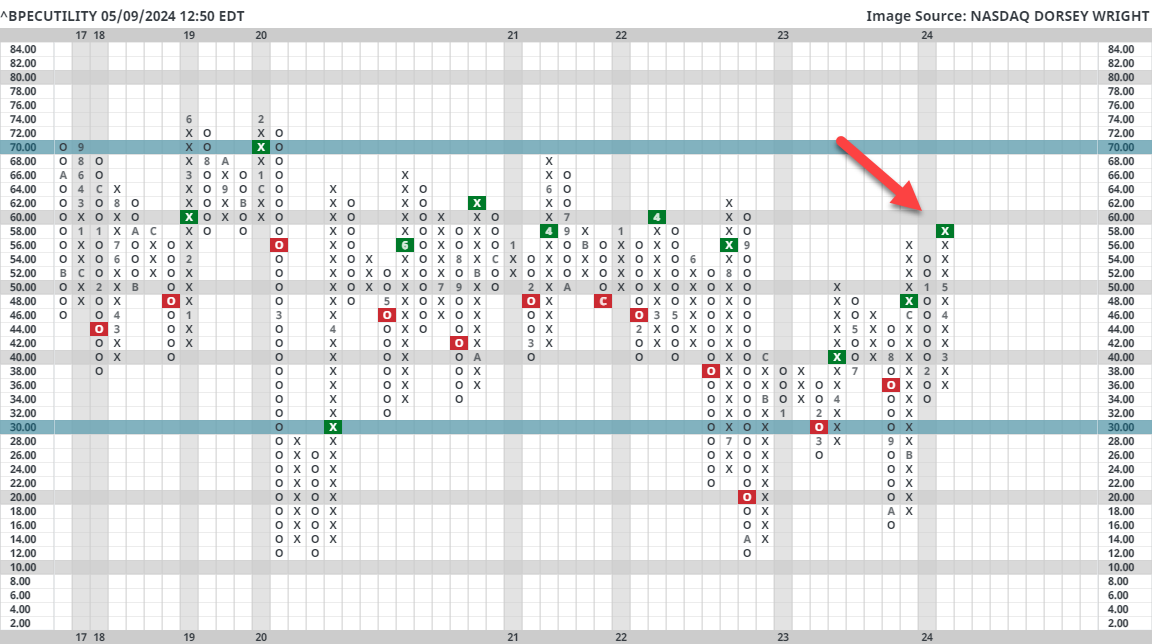
Today’s piece will focus namely on Utilities, but it could be used in practice for any sector or broad group. Last week’s FSO detailed strength for the sector in the near term, with the average fund score for the group moving above the key 3.0 threshold for the first time in quite a while. Pair this with vast upticks in participation for the sector and things start to look a bit more compelling. ^BPECUTILITY sits at its highest level in over 2 years, suggesting a significant number of Utility stocks sit on PnF buy signals. At the same time, coveted “follow-through” comes through a quick look at ^PTECUTILITY, with a growing number of Utility stocks earning long-term positive trends, all net positives for the group. If we were creating a running tally, chalk these up for the idea that utilities are on the rise.
So what gives? Where is the merit against this idea? Well- the main pushback that comes to mind is a simple argument… The move was just too fast to make a call quite yet. The analyst team (and conversational knowledge) often refers to pullbacks in price as a form of normalization- which can easily overshadow normalization over time. If price action can sustain positioning above certain levels long enough, those levels will become the new normal. A couple of tests for this include a quick look at the average OBOS reading for the Utilties sector, which sits at 114% (the next highest sector is energy at 36%.) Furthermore, one can utilize performance spreads to help identify where excess performance stalled out before like in the graph below. A rolling 3-month performance spread between XLU and SPX shows nice outperformance for the sector in the near term, but it is encroaching on a point (roughly 20%) where such outperformance has faded. The point being that history suggests things could get a bit choppy in the near term as the sector fights to hold the relative strength it has earned. For current holders, watch positions closely for signs of weakness and take profits where needed. For prospective holders, exercise caution as we would expect to see normalization (price or time) as we move through May.

