Most Requested Symbols

The past week saw no significant technical developments in the Consumer Cyclical, Basic Materials, Communication Services, Utilities, Healthcare or Real Estate Sectors. Those that saw noteworthy movement are included below.
The curve has an average reading of 50.89%.
Today's featured stock is Acadia Healthcare Company Inc (ACHC)
MA, TPX, META, PPC, ANDE, & INTU.
Call: Permian Resources Corp. (PR), Put: Block Inc. (SQ), Covered Write: Clevland-Cliffs Inc. (CLF)
NDW Morning Update Video - December 14, 2023
NDW Morning Update Video – December 14, 2023.
Click here to download MP3
Yesterday, the CBOE SPX Volatility Index (VIX) dropped to 12 on its 1-point chart, reaching its lowest reading since January 2020. After reaching 23 in late October, the VIX has been cut in half in just a month and a half. On the other hand, bond market volatility remains historically elevated, as seen by the ICE BofA MOVE Index (MLMOVE). The MOVE Index can be considered the VIX for treasury bonds and has a current reading of 125 on its 5-point chart which is well above its January 2020 level of 50. The dislocation between bond and equity volatility is staggering as the two have often moved similarly although not identically. The end-of-the-year period is one that is typically accompanied by low volatility, so it would not be surprising to see equity volatility remain compressed for the rest of the year. For those who can use options, now would be a good time to consider purchasing puts as portfolio insurance for risk-averse clients. With low volatility, puts are cheap especially relative to the last few years. Otherwise, the market seems confident that there is a lack of any major concerns given the level of implied volatility in the equity market.


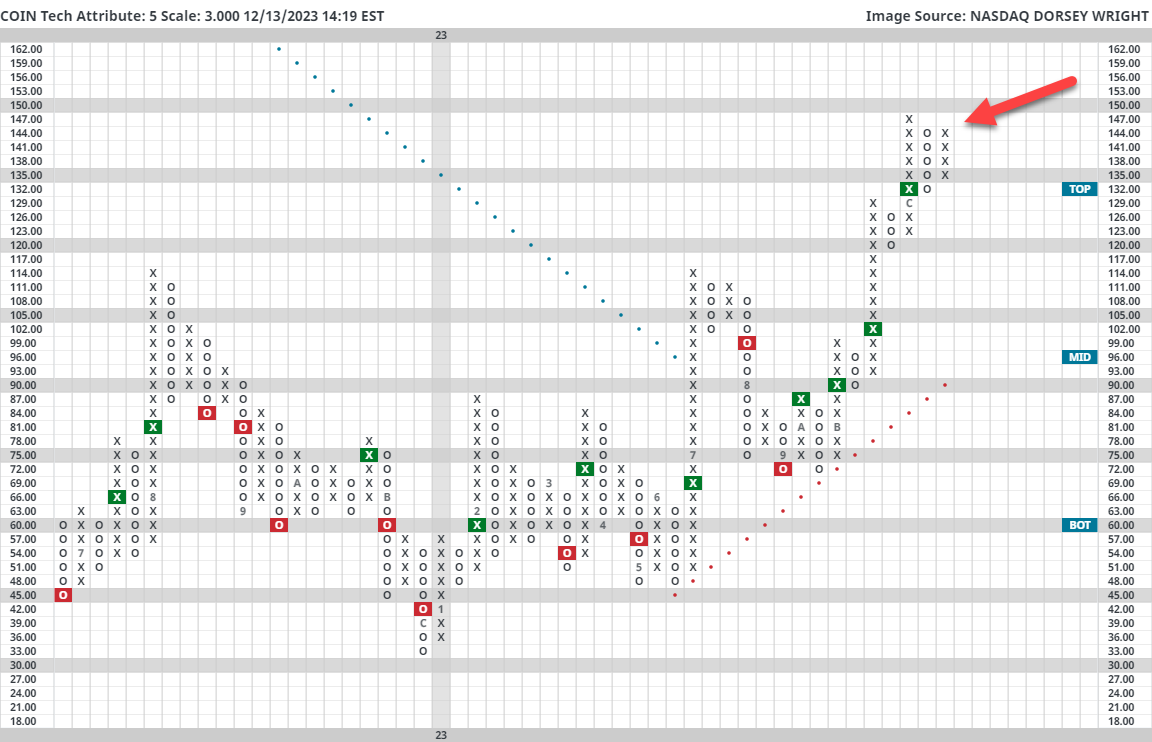
The broad crypto space took a brief step back for the last seven days. The stumble is what the analyst team would consider to be “healthy” for now. Even for the volatile crypto world, near-term indicators (weekly OBOS and weekly Momentum readings) were getting stretched following several consecutive weeks of large moves toward the upside. Fundamental catalysts remain largely the same, namely a focus on the eventual approval of a spot Bitcoin ETF and the Bitcoin Halving that is slated for the first half of 2024.

While individual coins are not appropriate for many, there may be several clients interested in putting some Christmas money to work within the space as it has been roaring recently. While considering the suitability of crypto in a client's portfolio is always the first priority, those interested in looking for exposure do have a number of options they could look towards. First, the ProShares Bitcoin Strategy ETF (BITO) has put together a productive year so far, holding a near-perfect 5.98 fund score and advancing nearly 100% this year. While there is some merit to the idea that the approval of a spot Bitcoin could have an impact on the fund as buyers rotate towards a possible new product, BITO is a technically strong idea for the time being. If equities are more your speed, COIN could be considered. This perfect 5/5’er sits on a string of buy signals on its 3-point chart and recently put in newly established support at $132. While it does move around more than other equity names, it could be considered as a dollar-cost-averaging candidate as we move to the new year.
Each week the analysts at DWA review and comment on all major asset classes in the global markets. Shown below is the summary or snapshot of the primary technical indicators we follow for multiple areas. Should there be changes mid-week we will certainly bring these to your attention via the report.
| Universe | BP Col & Level (actual) | BP Rev Level | PT Col & Level (actual) | PT Rev Level | HiLo Col & Level (actual) | HiLo Rev Level | 10 Week Col & Level (actual) | 10 Week Rev Level | 30 Week Col & Level (actual) | 30 Week Rev Level |
|---|---|---|---|---|---|---|---|---|---|---|
| ALL |
|
34% |
|
26% |
|
56% |
|
58% |
|
38% |
| NYSE |
|
46% |
|
38% |
|
76% |
|
70% |
|
52% |
| OTC |
|
30% |
|
28% |
|
50% |
|
52% |
|
34% |
| World |
|
36% |
|
34% |
|
|
|
52% |
|
40% |

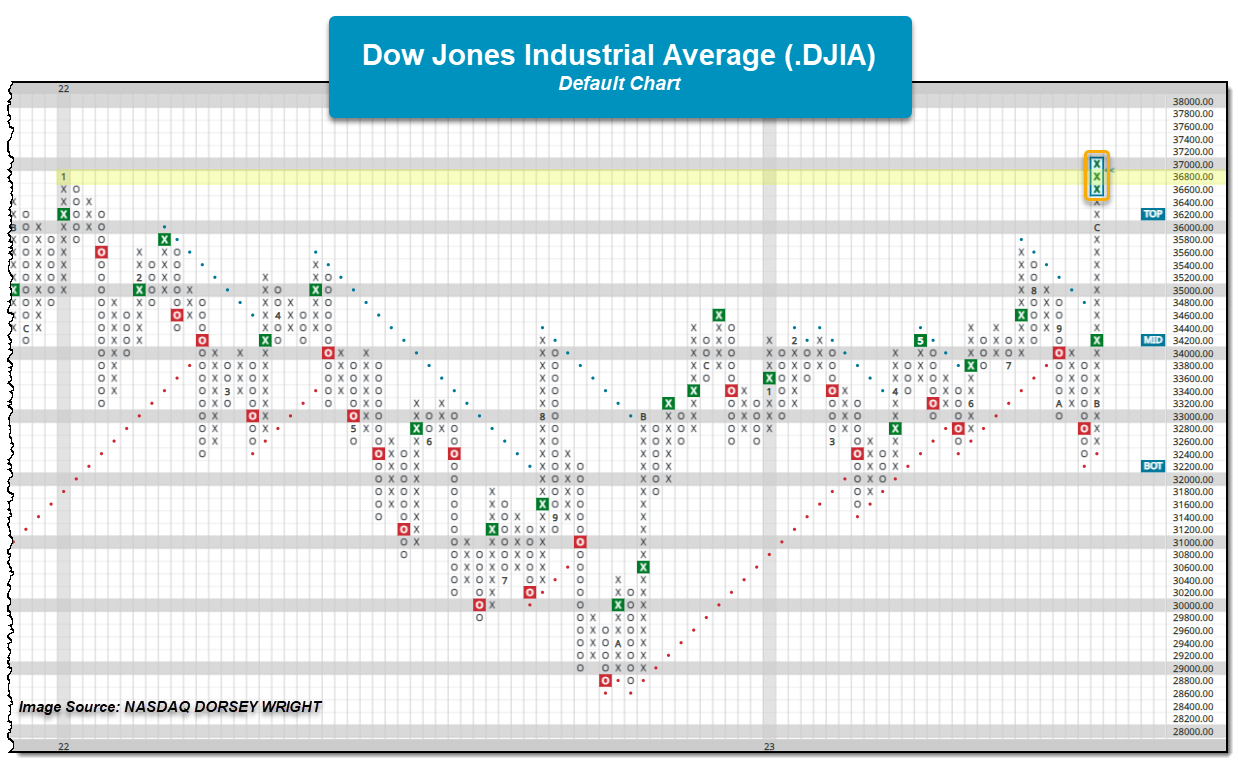
US Equity indices pushed notably higher following the Wednesday Fed meeting with many of the indices improving on recent highs and nearing their all-time highs. The S&P 500 Index SPX crossed above the 4700 level, while the Nasdaq-100 sits within a few boxes of its all-time high. While most indices saw new 52-week highs with Wednesday’s action, the Dow Jones Industrial Average .DJIA moved to a new all-time high at 37057. This eclipses the January 2022 chart high and the 37000 level on the chart.
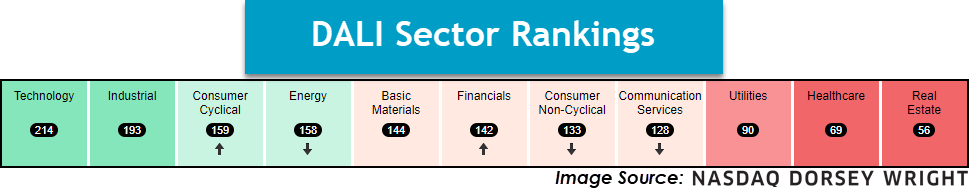
As noted in Tuesday’s “Were You Aware…”, Domestic Equities overtook Commodities for the 2nd position within DALI after Monday’s trading. The asset class was able to improve upon that with Domestic picking up five tally signals and moving to the top spot within DALI for the first time since the beginning of October. While it wouldn’t be said just yet that Domestic Equities are the far and away leader, continued positive action within the asset class and negative action within broader Commodities, notably precious metals and energy, has provided a bit of a catalyst for tally signals to exchange. The seven-signal gap between 1st and 3rd in DALI is the widest it has been in more than a month, but it by no means implies the signal margin couldn’t narrow again.
While precious metals and energy have been the primary culprits for the Commodities asset class’s weakness, agriculture and base metals have provided their share of relative weakness as of late. The broader weakness has not only led to changes within DALI but also on a key relative strength chart that compares two asset class-related indices. The RS chart below highlights the NDW Proprietary Domestic Equity and Commodity indices and notes the RS buy signal, favoring Domestic Equities, that occurred following Tuesday’s action. Before this, the RS chart had favored the Commodity index since January 2022 and ultimately followed the initial RS sell with additional signals, leading to the first time the chart has had three RS sell signals appear in the 2007 to 2009 market environment. Even with the rallies that have occurred within Domestic Equities since the chart initially moved to an RS sell, the market environment had provided an area within Commodities that was able to sustain the asset class’s strength. With the change to an RS buy signal, favoring Domestic Equities, it appears the scales have tipped, and at least for the moment, Commodities doesn’t have a leader within the asset class to help sustain the asset class’s overall positive RS.

The past week saw no significant technical developments in the Consumer Cyclical, Basic Materials, Communication Services, Utilities, Healthcare or Real Estate Sectors. Those that saw noteworthy movement are included below, in order of their relative strength ranking in the DALI domestic equity sector rankings. Sector designations are based on DALI sector rankings and are as follows: 1 - 3 overweight, 4 - 7 equal-weight, and 8 - 11 underweight.
Technology – Overweight, Improving
The technology sector continues to sit atop the DALI sector rankings, adding an additional signal over the past few days. Participation is broadening out, however, we are seeing many areas move into overbought territory. Given the long-term strength, keep an eye out for buy-on-pullback opportunities as we head toward next year, such as DELL.
Industrial- Overweight
The group remains in overweight territory this week, only lagging behind technology. With this said, there are a number of strong contenders available for consideration at the time of this writing. From a fund perspective, PAVE holds a strong 5.59 fund score and is testing 2023 highs. On the equity front, those interested could look towards United Rentals (URI), which recently posted new all-time highs. While JBHT moved back to a positive trend, it is nearing the top of a nearby trading range and should be avoided for now.
Energy- Equal Weight, Weakening
Energy fell to fourth in the DALI sector rankings. The Energy Select Sector SPDR Fund (XLE) was down roughly 235 bps over the last week as crude and natural gas were down heavily. Energy sits in equal-to-overweight territory in the DALI sector rankings but the fund score and chart of XLE tell a different story. XLE has given multiple consecutive sell signals putting in a series of lower tops and lower bottoms and the fund has an unfavorable 2.63 fund score. Keep an eye on exposure and weed out individual positions that begin to break down.
Financials – Equal Weight, Improving
Financials moved up in the DALI sector rankings this week to sixth place, putting it in equal weight territory for the first time in many months. The Financials group as well as the Financial-Banks groups boast the two highest score directions of any sector on the Asset Class Group Scores page. The recent move lower in long-term interest rates has likely been a driving factor in the improvement of banks specifically. One of the main concerns for banks, highlighted by the Silicon Valley Bank situation earlier this year, is the amount of unrealized losses on their fixed-income portfolios. The move lower in interest rates has undoubtedly helped alleviate some of the concerns. The SPDR Regional Bank ETF (KRE) has a fund score of 3.10 and is one box away from testing its July high of $49.50. KRE does sit near heavily overbought territory with a weekly overbought/oversold reading of 69%, so it would be best to wait for a more attractive entry point. Nonetheless, the improvement in the financials sector is a notable shift but still a sector not worthy of overweight status yet.
Consumer Non-Cyclical- Equal Weight
Consumer Staples fell to seventh in the DALI ranks over the past week, which is good from a macro standpoint given the sector's defensive tilt. Consumer Discretionary continues to separate itself as a comparative leader. SPDR Fund XLP is in a sell-on rally position, but momentum is doing well within the sector. Focus on high relative strength names and avoid the current laggards. COST trades at fresh highs ahead of earnings and WMT fell to a negative trend.

International equities fell from the top-ranked position in our DALI asset class rankings this week down into the second-ranked spot, losing out to domestic equities. This rotation likely did not come as a surprise, as the swift improvement from domestic equities over the past several weeks had caused many to wonder why domestic equities had not already taken the top DALI position. The objective nature of the DALI ranking system focuses on one thing for the investible universe it examines: price. If the price of one asset is rising quicker than another asset and it maintains that consistent improvement, it will be ranked higher. It is also important to keep in mind that the inventory examined for each asset class is meant to provide a broad representation of the entire asset class. So not just the S&P 500 Index SPX for domestic equities, and not just the All Cap World ex-US fund ACWX for international equities.
A deeper dive into the dispersion across the international equity landscape over the past few weeks might help further explain the recent rankings. The iShares MSCI EAFE ETF EFA has risen 6.30% over the past 30 days, while the iShares MSCI Emerging Markets ETF EEM has only advanced 2.35% over the same timeframe. Meanwhile, the S&P 500 Index SPX has climbed 5.17% over the past month (through Tuesday). So even though major areas of the international equity landscape, specifically China, have seen sharp deterioration, other areas have kept up just as much as major domestic equity indices.
Ultimately, that resilience for some areas gave way to weakness in other foreign markets, as international equities did drop into the second position. However, that does not mean that some areas of the international equity landscape cannot still be worth considering as we look toward next year.
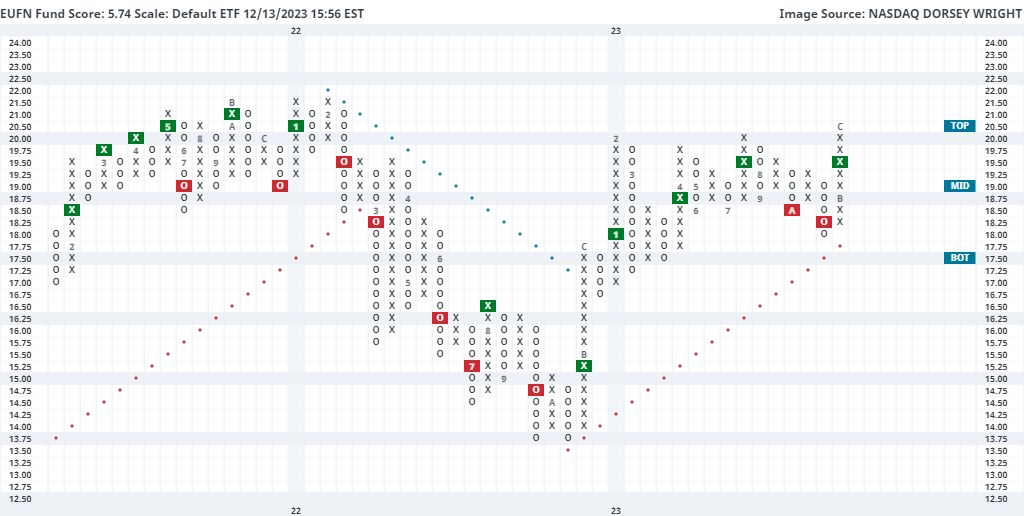
One such area that may be important to keep on your radar is European banks, as seen through the iShares MSCI Europe Financial ETF EUFN. This fund has risen almost 10% over the past 30 days, leading the default chart to rise to a new 52-week high at $20.50 over the past week. This chart moved back to a buy signal last month after showing downside movement in October. It has maintained a positive trend since November 2022 and moved back to an RS buy signal against the market in January, speaking to its long-term technical strength. This has helped EUFN reach a 5.74 recent fund score posting, besting the average Europe fund (3.51) as well as the average financial-services fund (3.54), and is paired with a positive 1.31 score direction. While the technical picture is overwhelmingly positive, note that EUFN is now in an overbought position with a weekly overbought/oversold (OBOS) reading north of 100% based on the intraday movement Wednesday. Due to this overbought posture, we would not be surprised to see some normalization or a pullback, which could present a more opportune entry point. Initial support is seen at $18, which is also the current location of the bullish support line.
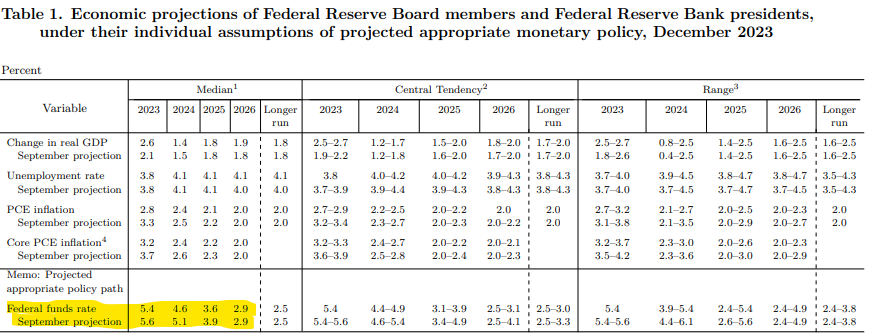
The Fed wrapped up its December meeting Wednesday, leaving rates unchanged as had widely been expected. Yields fell significantly following the meeting with the US Treasury 10-year Yield Index (TNX) falling to just above 4.0%. The move to 4.05% will put TNX in a negative trend for the first time since May. Further in on the yield curve, the US Treasury Five-year Yield Index (FVX) also fell to a negative trend when it hit 4.0%.

The impetus for the rally in bonds (and equities) appeared to be the Fed’s statement of economic projections which showed FOMC’s median projection for the level of the Fed funds in 2024 had fallen to 4.6%, down from 5.1% in September, implying roughly 75 basis points of cuts next year. While this is less than the 100-125 basis points of cuts the market had been pricing in, it shows that Fed officials do foresee lowering rates next year.
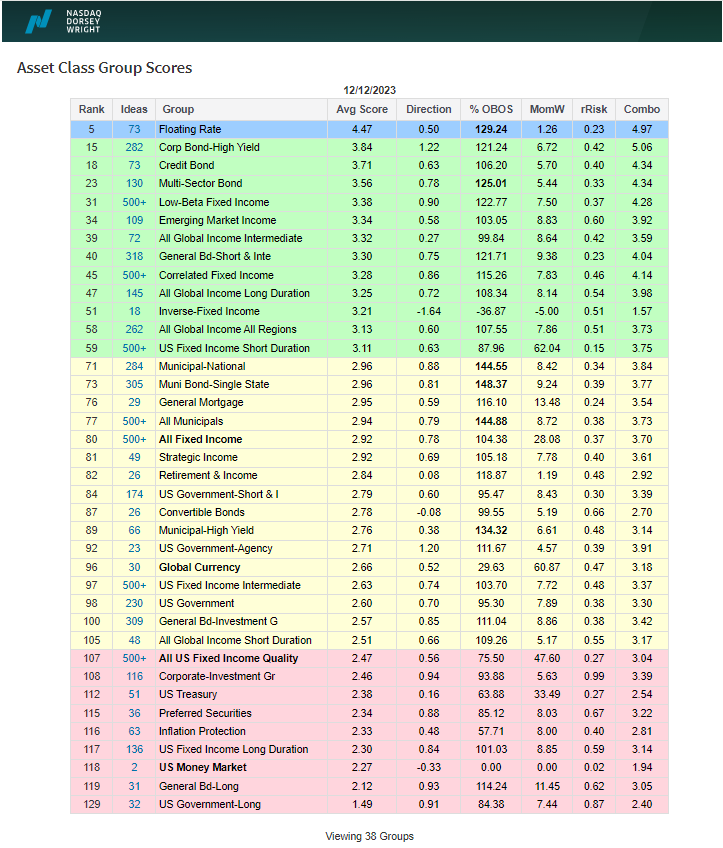
The fixed income rankings in the Asset Class Group Scores show what is probably the strongest fixed income market we’ve seen since at least March. Floating rates remain atop the rankings and are the only group with a score north of 4.0. High yield corporates and credit bonds sit in second and third respectively, showing a risk-on posture to credit. We can also see that most fixed income groups now sit in the green or yellow zones, in contrast to a few weeks ago when most groups were in the red zone. We still see a number of core groups in the red zone; however, their scores have improved noticeably over the last several weeks. Wednesday’s move in yields will likely serve to help those scores improve further. It is worth noting that many fixed income groups now sit in heavily overbought territory, with weekly overbought/oversold readings north of 100%. So, if we were to see some pullbacks or consolidation over the short-term it shouldn't come as a surprise.
Remember, these are technical comments only. Just as you must be aware of fundamental data for the stocks we recommend based on technical criteria in the report, so too must you be aware of important data regarding delivery, market moving government releases, and other factors that may influence commodity pricing. We try to limit our technical comments to the most actively traded contracts in advance of delivery, but some contracts trade actively right up to delivery while others taper off well in advance. Be sure you check your dates before trading these contracts. For questions regarding this section or additional coverage of commodities email will.gibson@nasdaq.com.
Data represented in the table below is through 12/12/2023:
Broad Market Commodities Report
| Symbol | Name | Price | PnF Trend | RS Signal | RS Col. | 200 Day MA | Weekly Mom |
|---|---|---|---|---|---|---|---|
| CL/ | Crude Oil Continuous | 68.61 | Negative | Buy | X | 77.80 | -11W |
| DBLCIX | Deutsche Bank Liquid Commodities Index | 457.61 | Negative | Sell | O | 492.44 | -11W |
| DWACOMMOD | DWA Continuous Commodity Index | 780.73 | Positive | Buy | O | 794.58 | -3W |
| GC/ | Gold Continuous | 1977.80 | Positive | Sell | O | 1949.60 | +1W |
| HG/ | Copper Continuous | 3.79 | Positive | Sell | O | 3.80 | +7W |
| ZG/ | Corn (Electronic Day Session) Continuous | 485.25 | Negative | Sell | O | 544.73 | +2W |
As discussed in yesterday’s report, falling energy prices were a large reason for November’s dampened inflation data. However, crude oil (CL/) is now approaching a big area of support on its trend chart (in the mid $60s) and also sits at a major relative strength low compared to gold.
The relative strength chart below compares crude oil continuous (CL/) to gold continuous (GC/) at a 3.25% scale, meaning that each box equates to 3.25% of relative performance. Reversals into Xs (three box minimum) mean that crude outperformed gold by about 10% and vice versa when reversing down into Os. More directly, when this chart is rising in Xs crude is outperforming gold and when the chart is falling in Os crude is underperforming gold.
Currently, the chart sits in Os at a relative strength calculation of 3.48, which is an irrelevant fact on its own; however, over the past decade, relative underperformance for crude has often stalled at this point (highlighted). In fact, there have only been two trips below this relative strength low in the past 10 years - March/April 2020 when crude briefly went negative amidst the Covid pandemic, and early 2016 when Congress eliminated the US oil export ban (source: Reuters).

Gold does not have as wide of economic applications and implications as crude oil, suggesting that if we get a mean reversion in this relationship its inflationary impacts would likely not zero out…and for that reason we would need to see other goods (mainly services) prices come down to keep inflation on its path of descent. Fortunately (although perhaps unfortunately from an economic demand perspective) most commodity prices are in downtrends, but the recent velocity of those downtrends leaves many commodities at risk of short-term upside mean reversals. These mean reversals will likely come on a relative basis, as evidenced today with crude and gold, which would then result in asymmetric impacts on future inflation prints. Said differently, the less economically impactful commodities have ripped, leaving those with more impact at risk of an upside mean reversion and "negative" impact on inflation.
Average Level
50.89
| < - -100 | -100 - -80 | -80 - -60 | -60 - -40 | -40 - -20 | -20 - 0 | 0 - 20 | 20 - 40 | 40 - 60 | 60 - 80 | 80 - 100 | 100 - > |
|---|---|---|---|---|---|---|---|---|---|---|---|
|
Sell signalijh
|
|||||||||||
|
Sell signaldvy
|
|||||||||||
|
Buy signalijr
|
|||||||||||
|
Buy signalvoog
|
|||||||||||
|
Buy signalXLG
|
|||||||||||
|
Buy signalief
|
|||||||||||
|
Buy signalicf
|
Buy signalhyg
|
||||||||||
|
Buy signaltlt
|
Sell signalRSP
|
||||||||||
|
Buy signaloneq
|
Buy signalagg
|
||||||||||
|
Sell signalUSO
|
Sell signalfxe
|
Buy signalshy
|
Sell signalefa
|
Buy signalspy
|
Buy signalVOOV
|
||||||
|
Buy signalgsg
|
Sell signalgcc
|
Sell signaldx/y
|
Buy signalGLD
|
Sell signaleem
|
Buy signaliwm
|
Buy signalQQQ
|
Buy signallqd
|
Buy signaldia
|
|||
| < - -100 | -100 - -80 | -80 - -60 | -60 - -40 | -40 - -20 | -20 - 0 | 0 - 20 | 20 - 40 | 40 - 60 | 60 - 80 | 80 - 100 | 100 - > |
| AGG | iShares US Core Bond ETF |
| USO | United States Oil Fund |
| DIA | SPDR Dow Jones Industrial Average ETF |
| DVY | iShares Dow Jones Select Dividend Index ETF |
| DX/Y | NYCE U.S.Dollar Index Spot |
| EFA | iShares MSCI EAFE ETF |
| FXE | Invesco CurrencyShares Euro Trust |
| GLD | SPDR Gold Trust |
| GSG | iShares S&P GSCI Commodity-Indexed Trust |
| HYG | iShares iBoxx $ High Yield Corporate Bond ETF |
| ICF | iShares Cohen & Steers Realty ETF |
| IEF | iShares Barclays 7-10 Yr. Tres. Bond ETF |
| LQD | iShares iBoxx $ Investment Grade Corp. Bond ETF |
| IJH | iShares S&P 400 MidCap Index Fund |
| ONEQ | Fidelity Nasdaq Composite Index Track |
| QQQ | Invesco QQQ Trust |
| RSP | Invesco S&P 500 Equal Weight ETF |
| IWM | iShares Russell 2000 Index ETF |
| SHY | iShares Barclays 1-3 Year Tres. Bond ETF |
| IJR | iShares S&P 600 SmallCap Index Fund |
| SPY | SPDR S&P 500 Index ETF Trust |
| TLT | iShares Barclays 20+ Year Treasury Bond ETF |
| GCC | WisdomTree Continuous Commodity Index Fund |
| VOOG | Vanguard S&P 500 Growth ETF |
| VOOV | Vanguard S&P 500 Value ETF |
| EEM | iShares MSCI Emerging Markets ETF |
| XLG | Invesco S&P 500 Top 50 ETF |
| Symbol | Company | Sector | Current Price | Action Price | Target | Stop | Notes |
|---|---|---|---|---|---|---|---|
| GPK | Graphic Packaging Intl. | Forest Prods/Paper | $22.91 | 21 - 23 | 26 | 18 | #6 of 12 in favored FORE sector matrix, LT pos mkt RS, triple top, 1.3% yield |
| AIG | American International Group, Inc. | Insurance | $66.95 | hi 50s - low 60s | 68 | 52 | 4 for 5'er, top half of INSU sector matrix, LT pos mkt RS, multiple consec buy signals, 2.35% yield |
| COCO | Vita Coco Company, Inc. | Food Beverages/Soap | $27.48 | mid 20s | 36 | 23 | 4 for 5'er, top decile of FOOD sector matrix, multi consec buy signals, pullback from ATH |
| KRG | Kite Realty Group Trust | Real Estate | $21.86 | 19 - 21 | 34.50 | 16 | 5 for 5'er, 11 of 113 in REAL sector matrix, LT pos mkt RS, spread quintuple top, 4.65% yield |
| IONS | Ionis Pharmaceuticals Inc. | Biomedics/Genetics | $49.46 | 42 - hi 40s | 64 | 38 | 5 TA rating, top decile of BIOM matrix, consec. buy signals, LT RS buy |
| BG | Bunge Limited | Food Beverages/Soap | $104.38 | lo 100s - mid 110s. | 169 | 89 | 5 TA rating, top decile of FOOD sector matrix, consec. buy signals, LT mkt RS pos., R-R > 3 |
| FDX | FedEx Corporation | Aerospace Airline | $273.01 | lo 230s - mid 250s | 364 | 190 | 4 TA rating, top 25% of AERO sector matrix, shakeout buy point, positive mkt RS, R-R > 2, Earn. 12/19 |
| OKE | ONEOK, Inc. | Gas Utilities | $66.06 | low-to-mid 60s | 89 | 55 | 5 for 5'er, top third of GUTI sector matrix, triple top, pullback to oversold, R-R>2.0, 5.8% yield |
| CME | CME Group, Inc. | Wall Street | $214.13 | 200s - mid 210s | 272 | 174 | 4 for 5'er, #5 of 32 in WALL sector matrix, one box from market RS buy, 2% yield |
| ORCL | Oracle Corporation | Software | $100.81 | mid 100s - mid 110s | 138 | 96 | 5 for 5'er, top half of SOFT sector matrix, LT pos mkt RS, trend chart signal flip, 1.5% yield |
| CDW | CDW Corp. | Computers | $217.62 | 200 - 220 | 278 | 184 | 4 for 5'er, top third of COMP sector matrix, LT pos mkt RS, triple top, 1.1% yield |
| CNC | Centene Corporation | Healthcare | $76.34 | hi 60s - hi 70s | 98 | 60 | 5 TA rating, top quintile of healthcare sector matrix, consec. buy signals, LT mkt RS buy |
| ABCB | Ameris Bancorp | Banks | $46.82 | low 40s | 57 | 34 | 4 for 5'er, top quartile of BANK sector matrix, pos trend flip, 1.4% yield |
| AEO | American Eagle Outfitters, Inc. | Retailing | $20.62 | 16 - 19.50 | 33 | 14 | 5 TA rating, top quintile of RETA sector matrix, consec. buy signals, R-R > 3.5. |
| AMZN | Amazon.com Inc. | Internet | $147.48 | 140 - lo 150s | 200 | 118 | 4 TA rating, top 25% of INET sector matrix, consec. buy signals, LT pos trend |
| SBUX | Starbucks Corporation | Restaurants | $98.15 | mid 90s - mid 100s | 137 | 82 | 4 TA rating, top 33% of REST sector matrix, LT RS buy, buy-on-pullback, R-R > 2 |
| MOD | Modine Manufacturing Company | Autos and Parts | $53.83 | 50 - 54 | 77 | 38 | 4 for 5'er, new ATH, pos. trend since 7/22, top quartile of Autos Sector Matrix. |
| URI | United Rentals, Inc. | Machinery and Tools | $509.58 | 450s - lo 500s | 692 | 384 | 5 TA rating, pos. trend, consec. buys, LT mkt RS buy, R-R > 2 |
| DELL | Dell Technologies Inc Class C | Computers | $69.99 | mid 60s - lo 70s | 101 | 52 | 5 TA rating, top 20% of COMP sector matrix, buy-on-pullback, R-R > 2 |
| ORLY | O'Reilly Automotive, Inc. | Autos and Parts | $972.79 | 912 - 992 | 1264 | 792 | 5 for 5'er, Mkt. RS Buy since 9/2002, Peer RS Buy since 8/2011, Pullback from Recent ATH. |
| FLR | Fluor Corporation | Building | $38.61 | hi 30s | 49 | 32 | 4 for 5'er, top half of favored BUIL sector matrix, spread quad top breakout |
| GIL | Gildan Activewear | Textiles/Apparel | $33.94 | lo-mid 30s | 58 | 26 | 5 TA rating, top half of TEXT sector matrix, LT RS buy, buy-on-pullback, R-R > 2 |
| ACHC | Acadia Healthcare Company Inc | Healthcare | $75.91 | 70s | 90 | 66 | 4 for 5'er, top third of HEAL sector matrix, LT pos mkt RS, pos trend flip, triple top |
| Symbol | Company | Sector | Current Price | Action Price | Target | Stop | Notes |
|---|
| Comment | |||||||
|---|---|---|---|---|---|---|---|
|
|
|||||||
ACHC Acadia Healthcare Company Inc R ($77.07) - Healthcare - ACHC is a 4 for 5'er that ranks in the top third of the healthcare sector matrix and has been on a market RS buy signal since 2020. On its default chart, the stock returned to a buy signal and a positive trend this week when it broke a triple top at $77. Long exposure may be added in the $70s and we will set our initial stop at $66, a potential spread triple bottom break that would take out ACHC's 2023 low. We will use the bullish price objective, $90, as our target price.
| 23 | ||||||||||||||||||||||||||||||||||||||||||||||||||||
| 89.00 | X | • | 89.00 | |||||||||||||||||||||||||||||||||||||||||||||||||
| 88.00 | X | X | O | • | 88.00 | |||||||||||||||||||||||||||||||||||||||||||||||
| 87.00 | X | O | X | O | • | • | 87.00 | |||||||||||||||||||||||||||||||||||||||||||||
| 86.00 | X | O | X | C | • | X | • | • | 86.00 | |||||||||||||||||||||||||||||||||||||||||||
| 85.00 | X | O | X | O | X | X | • | X | O | 2 | • | Top | 85.00 | |||||||||||||||||||||||||||||||||||||||
| 84.00 | X | O | O | X | O | X | O | 1 | O | X | O | • | 84.00 | |||||||||||||||||||||||||||||||||||||||
| 83.00 | X | O | X | O | X | O | X | O | X | O | • | 83.00 | ||||||||||||||||||||||||||||||||||||||||
| 82.00 | X | O | • | O | • | O | X | O | • | O | X | • | • | 82.00 | ||||||||||||||||||||||||||||||||||||||
| 81.00 | X | • | • | O | • | • | O | X | O | • | X | • | 81.00 | |||||||||||||||||||||||||||||||||||||||
| 80.00 | • | • | O | X | O | • | X | X | X | O | • | • | 80.00 | |||||||||||||||||||||||||||||||||||||||
| 79.00 | • | O | O | • | X | O | X | O | X | O | • | X | X | • | 79.00 | |||||||||||||||||||||||||||||||||||||
| 78.00 | • | O | • | X | O | X | O | X | 8 | X | • | X | O | X | O | • | 78.00 | |||||||||||||||||||||||||||||||||||
| 77.00 | O | • | X | 7 | O | X | O | X | O | • | X | O | X | O | X | • | X | 77.00 | ||||||||||||||||||||||||||||||||||
| 76.00 | O | X | • | X | O | X | X | X | O | X | O | X | O | O | X | O | • | • | X | 76.00 | ||||||||||||||||||||||||||||||||
| 75.00 | O | 3 | X | O | • | X | O | X | O | X | O | X | O | • | 9 | X | O | B | O | X | • | C | • | X | 75.00 | |||||||||||||||||||||||||||
| 74.00 | O | X | O | X | O | X | • | X | O | X | O | X | O | X | • | O | X | O | X | O | X | O | X | O | X | 74.00 | ||||||||||||||||||||||||||
| 73.00 | O | X | O | 4 | O | X | O | X | • | X | O | X | O | • | O | • | O | X | O | X | O | X | O | X | O | X | Mid | 73.00 | ||||||||||||||||||||||||
| 72.00 | O | O | X | O | X | O | X | O | X | O | X | • | • | O | X | O | X | O | • | O | • | O | X | 72.00 | ||||||||||||||||||||||||||||
| 71.00 | O | X | O | X | 5 | X | O | X | X | O | • | O | X | X | O | • | • | • | O | • | 71.00 | |||||||||||||||||||||||||||||||
| 70.00 | O | X | O | O | X | O | X | O | X | • | • | O | X | O | X | • | • | 70.00 | ||||||||||||||||||||||||||||||||||
| 69.00 | O | X | O | X | O | X | O | X | • | O | X | O | X | • | 69.00 | |||||||||||||||||||||||||||||||||||||
| 68.00 | O | X | O | O | 6 | • | O | A | X | • | 68.00 | |||||||||||||||||||||||||||||||||||||||||
| 67.00 | O | • | O | • | 67.00 | |||||||||||||||||||||||||||||||||||||||||||||||
| 66.00 | • | 66.00 | ||||||||||||||||||||||||||||||||||||||||||||||||||
| 23 |
| ANDE The Andersons, Inc. ($53.51) - Food Beverages/Soap - Shares of ANDE returned to a buy signal on Wednesday with a major break of resistance at $54. The 5 for 5'er ranks in the top decile of its sector matrix and faces no resistance until $59, multi-year chart highs. The weight of the technical evidence is positive here. Initial support is offered at around $49. |
| INTU Intuit Inc. ($610.22) - Software - INTU moved higher Wednesday to break a double top at $600 before moving to $608 intraday. This 5 for 5'er moved to a positive trend in July and sits in the top quartile of the software sector RS matrix. The weight of the technical evidence is favorable and improving, however, INTU is now in overbought territory. Initial support can be seen at $568 with further support at $488. |
| MA Mastercard Incorporated Class A ($424.25) - Finance - MA shares moved higher today to break a double top at $424 to mark its first buy signal, return to a positive trend, and reach a new all-time high. This 5 for 5'er has been on an RS buy signal versus the market since August 2011. MA shares are trading near the top of their trading band with a weekly overbought/oversold reading of 63%. From here, support is offered at $360. |
| META Meta Platform Inc. ($334.82) - Internet - META posted a second consecutive buy signal on its default chart today. The move should act as a feather in the cap of what has been an already extremely productive 2023 so far, as it now sits within just one box of 2023 highs. This perfect 5/5'er now has a range of support to build on from $316-$320 and could be considered here. |
| PPC Pilgrim's Pride Corporation ($27.06) - Food Beverages/Soap - Shares of PPC broke through major resistance on Wednesday, returning to a buy signal and positive trend in the process. The now 3 for 5'er looks toward its next level of resistance situated at around $32. Weight of the evidence is positive here. |
| TPX Tempur Sealy International Inc. ($48.85) - Household Goods - TPX broke a spread triple top at $48 to return to a buy signal as the stock rallied to $49, marking a 52-week high. This brings the chart up to levels not seen since the latter part of 2021 and places the stock near the top of the 10-week trading band. TPX is a 4 for 5'er that ranks in the top quintile of the Household Goods sector matrix. From here, the stock's all-time high lies at $50, while the bullish support line sits at $37. |
| Name | Option Symbol | Action | Stop Loss |
|---|---|---|---|
| Permian Resources Corp. - $13.00 | PR2419D13 | Buy the April 13.00 calls at 1.35 | 11.00 |
| Name | Option | Action |
|---|---|---|
| American International Group, Inc. ( AIG) | Jan. 60.00 Calls | Raise the option stop loss to 5.60 (CP: 7.60) |
| Broadcom Ltd ( AVGO) | Mar. 920.00 Calls | Raise the option stop loss to 170.30 (CP: 190.30) |
| Name | Option Symbol | Action | Stop Loss |
|---|---|---|---|
| Block Inc - $69.78 | SQ2415O67.5 | Buy the March 67.50 puts at 5.00 | 73.00 |
| Name | Option | Action |
|---|---|---|
|
|
||
| Name | Option Sym. | Call to Sell | Call Price | Investment for 500 Shares | Annual Called Rtn. | Annual Static Rtn. | Downside Protection |
|---|---|---|---|---|---|---|---|
| Cleveland-Cliffs Inc. $17.26 | CLF2419D19 | Apr. 19.00 | 1.38 | $8,411.95 | 33.83% | 20.10% | 6.59% |
| Name | Action |
|---|---|
| Amazon.com Inc. (AMZN) - 147.48 | Sell the March 150.00 Calls. |
| Dexcom Inc. (DXCM) - 119.16 | Sell the March 120.00 Calls. |
| Airbnb, Inc. Class A (ABNB) - 140.55 | Sell the March 150.00 Calls. |
| Guess Inc. (GES) - 22.26 | Sell the March 23.00 Calls. |
| Royal Caribbean Cruises Ltd. (RCL) - 120.30 | Sell the March 125.00 Calls. |
| Name | Covered Write |
|---|---|
|
|
|
Daily Equity & Market Analysis
Loading, Please Wait...
