
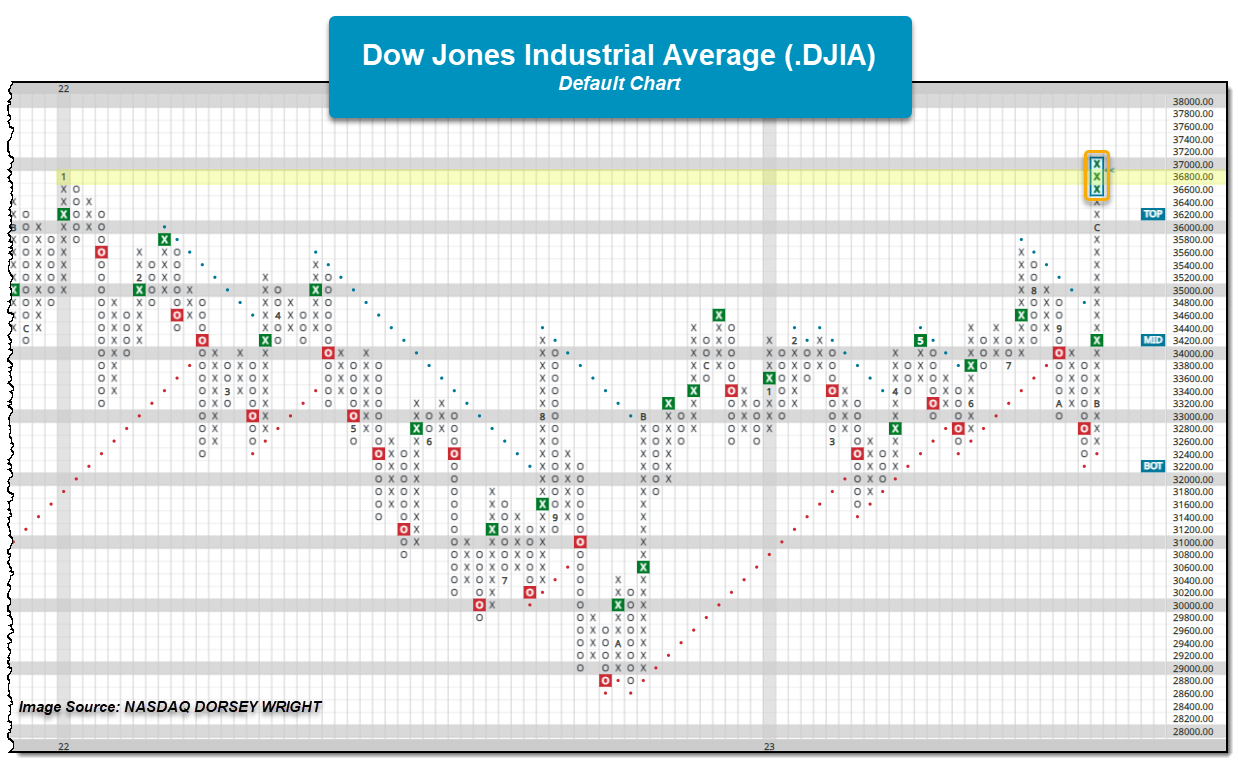
The Dow Jones Industrial Average reached a new all-time high during Wednesday's trading. The breakout was preceded by Domestic Equities moving into the top spot of DALI following Tuesday's action.
US Equity indices pushed notably higher following the Wednesday Fed meeting with many of the indices improving on recent highs and nearing their all-time highs. The S&P 500 Index SPX crossed above the 4700 level, while the Nasdaq-100 sits within a few boxes of its all-time high. While most indices saw new 52-week highs with Wednesday’s action, the Dow Jones Industrial Average .DJIA moved to a new all-time high at 37057. This eclipses the January 2022 chart high and the 37000 level on the chart.
As noted in Tuesday’s “Were You Aware…”, Domestic Equities overtook Commodities for the 2nd position within DALI after Monday’s trading. The asset class was able to improve upon that with Domestic picking up five tally signals and moving to the top spot within DALI for the first time since the beginning of October. While it wouldn’t be said just yet that Domestic Equities are the far and away leader, continued positive action within the asset class and negative action within broader Commodities, notably precious metals and energy, has provided a bit of a catalyst for tally signals to exchange. The seven-signal gap between 1st and 3rd in DALI is the widest it has been in more than a month, but it by no means implies the signal margin couldn’t narrow again.
While precious metals and energy have been the primary culprits for the Commodities asset class’s weakness, agriculture and base metals have provided their share of relative weakness as of late. The broader weakness has not only led to changes within DALI but also on a key relative strength chart that compares two asset class-related indices. The RS chart below highlights the NDW Proprietary Domestic Equity and Commodity indices and notes the RS buy signal, favoring Domestic Equities, that occurred following Tuesday’s action. Before this, the RS chart had favored the Commodity index since January 2022 and ultimately followed the initial RS sell with additional signals, leading to the first time the chart has had three RS sell signals appear in the 2007 to 2009 market environment. Even with the rallies that have occurred within Domestic Equities since the chart initially moved to an RS sell, the market environment had provided an area within Commodities that was able to sustain the asset class’s strength. With the change to an RS buy signal, favoring Domestic Equities, it appears the scales have tipped, and at least for the moment, Commodities doesn’t have a leader within the asset class to help sustain the asset class’s overall positive RS.

