European financials have shown further improvements against a lack of broad strength in international equities.
International equities fell from the top-ranked position in our DALI asset class rankings this week down into the second-ranked spot, losing out to domestic equities. This rotation likely did not come as a surprise, as the swift improvement from domestic equities over the past several weeks had caused many to wonder why domestic equities had not already taken the top DALI position. The objective nature of the DALI ranking system focuses on one thing for the investible universe it examines: price. If the price of one asset is rising quicker than another asset and it maintains that consistent improvement, it will be ranked higher. It is also important to keep in mind that the inventory examined for each asset class is meant to provide a broad representation of the entire asset class. So not just the S&P 500 Index SPX for domestic equities, and not just the All Cap World ex-US fund ACWX for international equities.
A deeper dive into the dispersion across the international equity landscape over the past few weeks might help further explain the recent rankings. The iShares MSCI EAFE ETF EFA has risen 6.30% over the past 30 days, while the iShares MSCI Emerging Markets ETF EEM has only advanced 2.35% over the same timeframe. Meanwhile, the S&P 500 Index SPX has climbed 5.17% over the past month (through Tuesday). So even though major areas of the international equity landscape, specifically China, have seen sharp deterioration, other areas have kept up just as much as major domestic equity indices.
Ultimately, that resilience for some areas gave way to weakness in other foreign markets, as international equities did drop into the second position. However, that does not mean that some areas of the international equity landscape cannot still be worth considering as we look toward next year.
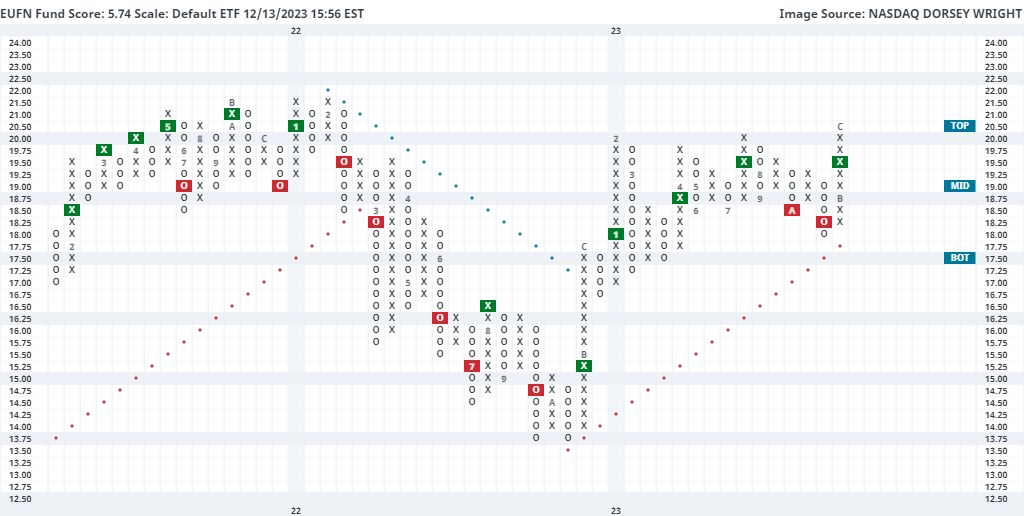
One such area that may be important to keep on your radar is European banks, as seen through the iShares MSCI Europe Financial ETF EUFN. This fund has risen almost 10% over the past 30 days, leading the default chart to rise to a new 52-week high at $20.50 over the past week. This chart moved back to a buy signal last month after showing downside movement in October. It has maintained a positive trend since November 2022 and moved back to an RS buy signal against the market in January, speaking to its long-term technical strength. This has helped EUFN reach a 5.74 recent fund score posting, besting the average Europe fund (3.51) as well as the average financial-services fund (3.54), and is paired with a positive 1.31 score direction. While the technical picture is overwhelmingly positive, note that EUFN is now in an overbought position with a weekly overbought/oversold (OBOS) reading north of 100% based on the intraday movement Wednesday. Due to this overbought posture, we would not be surprised to see some normalization or a pullback, which could present a more opportune entry point. Initial support is seen at $18, which is also the current location of the bullish support line.