Most Requested Symbols

The average distribution level is 14.03%.
Today's featured stock is Stryker Corporation (SYK).
AAPL and NET
Call: Darden Restaurants (DRI); Put: Pilgrim's Pride Corporation (PPC); Covered Write: Tempur Seal International Inc (TPX).
NDW Morning Update Video - August 7, 2023
NDW Morning Update Video
Click here to download MP3
This week saw the latest evaluation of our seasonal Fund Score Method (FSM) models, which were updated based on market data through Thursday, August 3. Any corresponding trades were sent out this morning, on Friday, August 4. As a refresher, the seasonal FSM models are checked four times a year, outside the typical calendar quarters. The system checks each model at the beginning of February, May, August, and November. At each of those points, the models are sorted by the fund scores of the corresponding constituents, with the top-scoring funds in each inventory selected as the model holdings. There are a few variations of the models in terms of differing holding counts, evaluation timeframes, or cash triggers, which are discussed more in-depth in our FSM Overview. Each model has the potential to transition to cash in times of broader market weakness, but those cash triggers remained unchanged in the latest evaluation.
Today, we will highlight some notable changes from a few of the most popular FSM models. These include the CoreSolutions US Core, CoreSolutions All Cap World, T Rowe Price, and American Funds models. Those looking for more information on trades for any of the models can review the updates on our Models page or contact our analyst team. Be sure to set alerts for Models you follow through the Models page to be notified of any future updates.
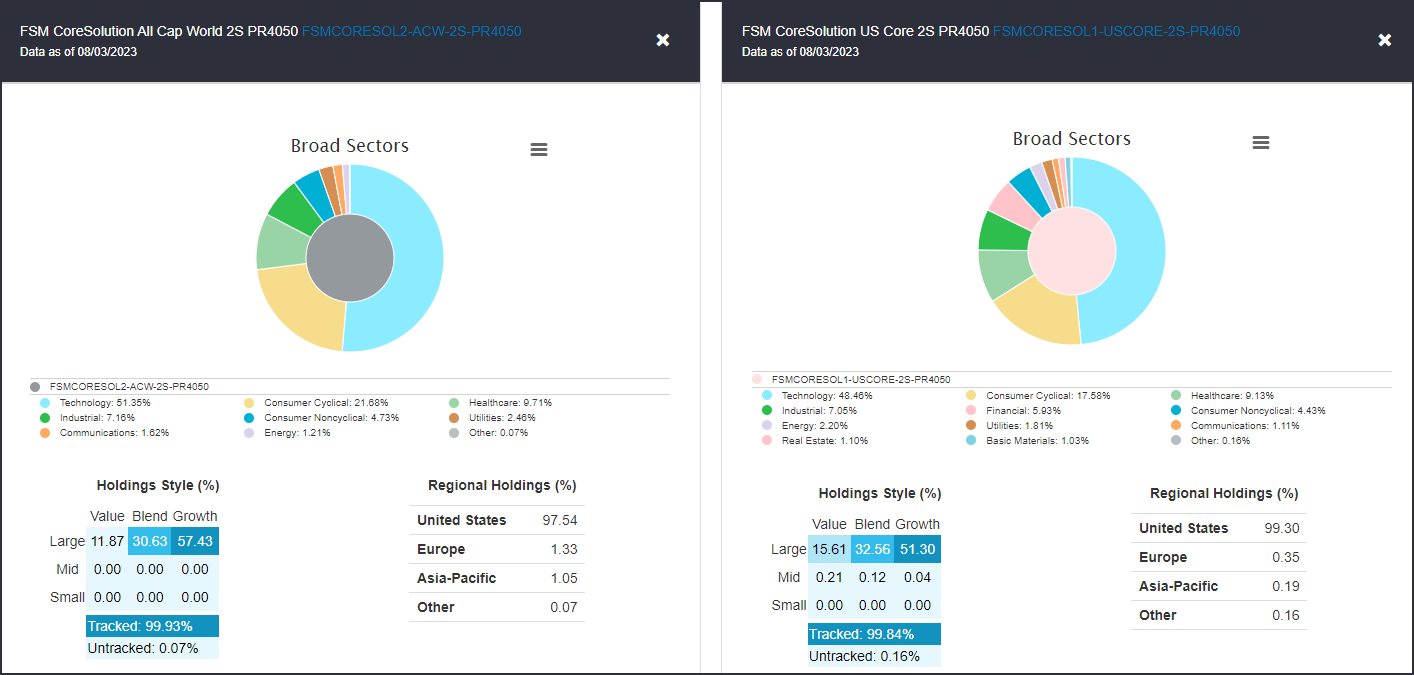
CoreSolutions All Cap World & US Core 2S Models
Each of the CoreSolutions models looks to hold two equity funds at a time, and we saw each model show similar trades at the latest evaluation. The All Cap World Model, which evaluates an inventory of 25 global equity funds, rotated away from international equities by selling the iShares MSCI EAFE ETF EFA this week after it was included as a model holding for the last three months. This was a quicker rotation than many predicted after the broad-developed market fund came into the portfolio in May, but we saw other areas of the marketplace show enough momentum to overtake the space in score. In place of EFA, the Model moved into the Invesco QQQ Trust QQQ, which joins the First Trust Nasdaq-100 Equal Weighted Index Fund QQEW as the two portfolio positions. QQEW came into the Model in May and has gained 12.88% during its time as a model holding (5/4/23 – 8/3/23).
The CoreSolutions US Core 2S Model looks at a more focused inventory of broad US large-cap representatives at each evaluation, in addition to our DWA Money Market Proxy MNYMKT, which is included in each of the FSM model inventories. MNYMKT saw a high enough score at the May evaluation to move into the portfolio at a 50% allocation, which was undone at this week’s evaluation due to weakening from that defensive position. In place of the money market proxy, the Model moved into the SPDR S&P 500 ETF Trust SPY. This fund joins QQQ as an existing holding, speaking to the pervasive nature of strength from large-cap growth across the ETF model lineup.
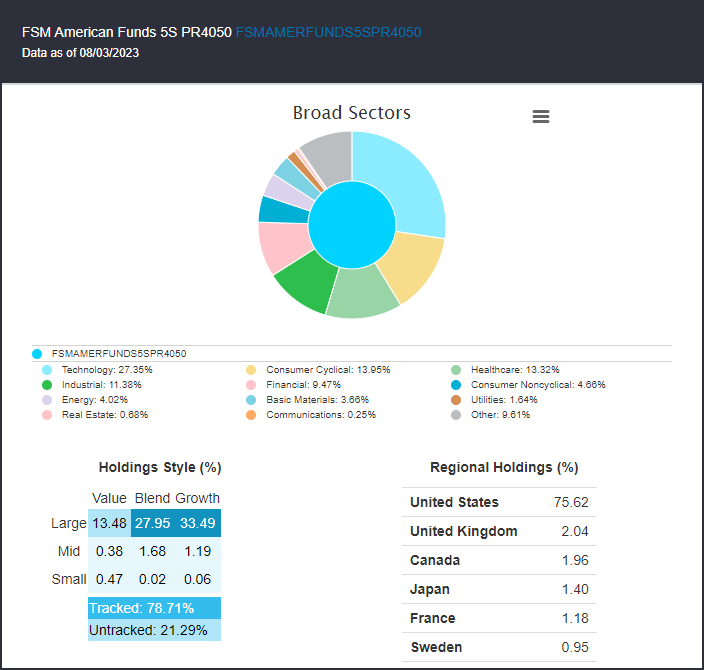
American Funds 5S Model
The American Funds lineup saw some notable changes to their score rankings over the past several weeks. The 5S model sold out of the focused international equity representatives, moving away from Europacific Growth AEPGX, International Growth & Income IGAAX, and New World NEWFX. This follows the broader theme of rotation away from foreign equities that was seen across many of the FSM models in this evaluation. It is worth noting that these funds that were sold did not necessarily show drastic score deterioration, as they each continue to possess fund scores north of the 4.00 threshold. Instead, we simply saw other areas of the equity market show enough score improvement to transition into areas of focus for the next three months. The new holdings included the Growth Fund of America AGTHX, the Investment Company of America IGAAX, and the Capital World Growth & Income CWGIX. This leaves the American Funds model with a diverse holding lineup, overweight growth while seeing some value-like representation, and a small amount of international exposure through the new addition of World Growth & Income.
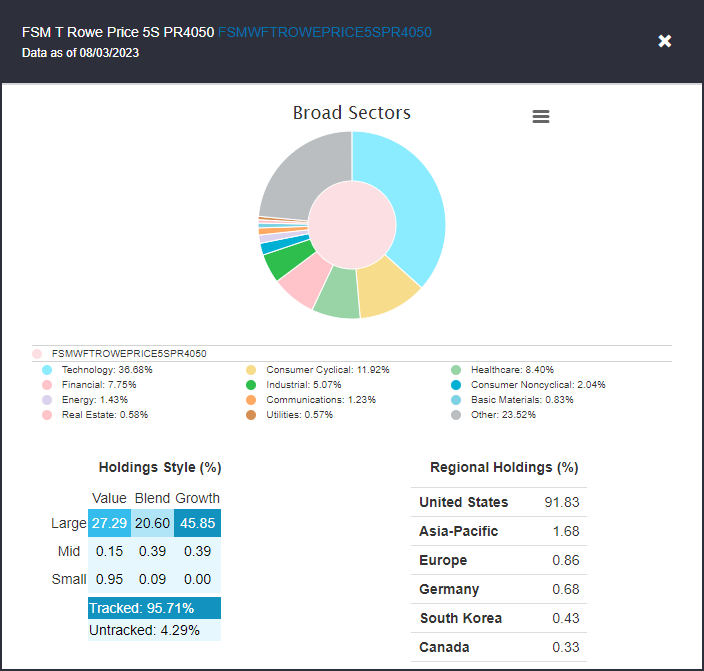
T Rowe Price 5S Model
The final model we will review is the T Rowe Price 5S portfolio, which sold International Equity PIEQX, Dividend Growth PRDGX, and Small Cap Growth PRDSX. In their place, the Model purchased All Cap Opportunities PRWAX, Blue Chip Growth TRBCX, and US Equity Research PRCOX. This leaves the strategy with a significant overweight toward technology at almost 37% of the portfolio, more than three times the exposure of any other sector. We can also see that the portfolio is 45% allocated toward large-cap growth, furthering the themes we saw play out across other portfolios.

Fitch Downgrades US Debt
The biggest “news” on the economy this week will probably be remembered as the decision by Fitch to downgrade US debt from AAA to AA+. Fitch had three reasons for the downgrade – one related to the fact we only just avoided a default (again) with the persistent debt ceiling debate. They are also concerned about the level of US government deficits (which are now running at over $1tr each year) and the impact of that for future spending and taxation.
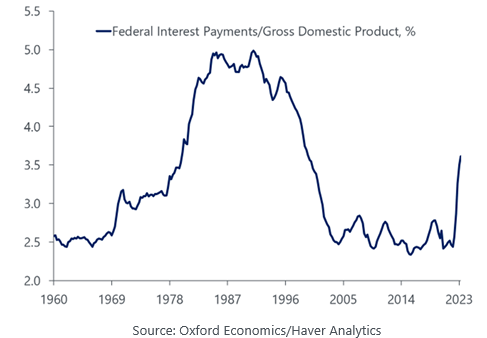
We talked about some of this when the debt ceiling debate was happening. The US government debt is already running at close to 100% of GDP, a level only previously seen after the second world war. And remember, S&P already downgraded us (for a similar reason) back in 2011 – and haven’t reversed their decision either. Data shows the US started running deficits consistently starting in the 70’s (see red line below). But it’s also worth highlighting that around that time, the frequency of grey bars (recessions) also dropped. This is a text-book economic result – governments intervene to boost the economy ahead of recessions, and slow the economy as bubbles form – to smooth the economic boom-bust cycles that tend to naturally form. It’s one reason why we are in a rate-hike cycle now.
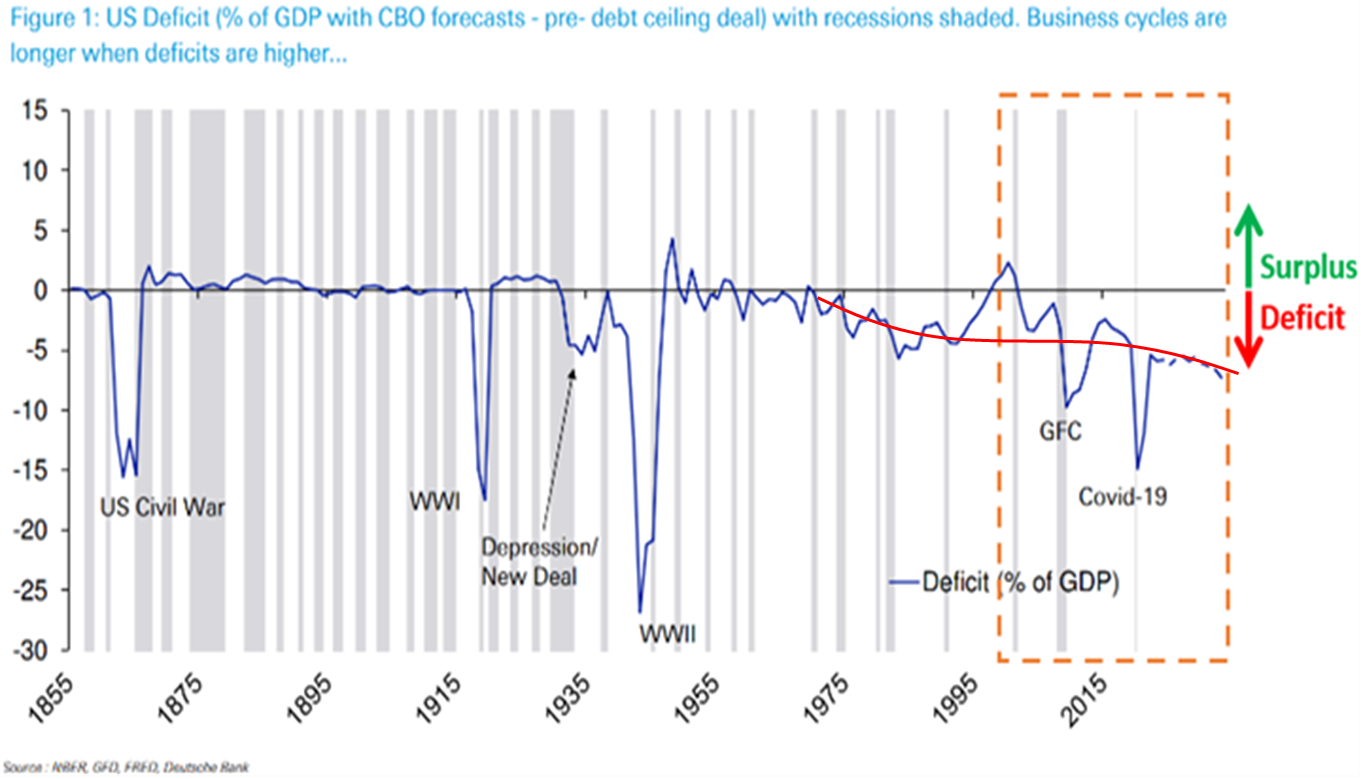
However, these persistent deficits, combined with an aging population which is expected to add to Medicare and social security costs, have some forecasting US debt will increase to 200% by 2050. That’s not unheard of - Japan was in a similar situation back in the 1990’s (red color in chart below), and they now have debt to GDP over 250%.
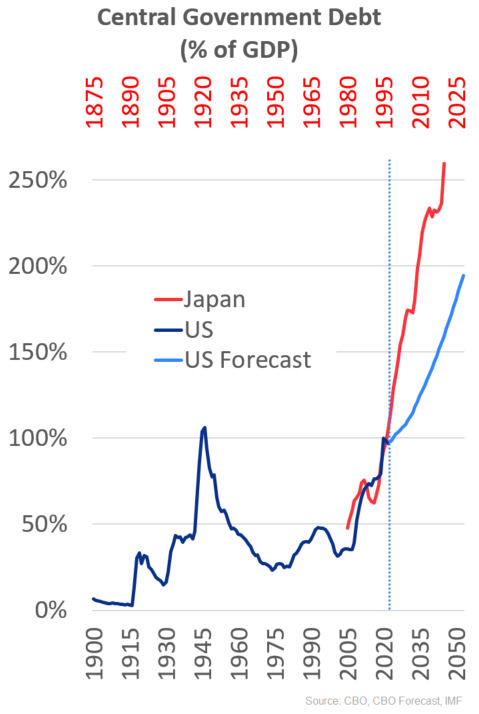
The problem with all that debt is that, just like all of us, the government needs to pay interest to its lenders. Japan has managed to continue deficit spending to support their economy because their interest rates are so low. Luckily, for now, the average interest rate the US government needs to pay on debt is also still pretty low. But, if inflation doesn’t recede, and debt keeps growing, it’s possible net US government interest costs could more than quadruple to 7.2% of GDP by 2052, That would soak up nearly 40% of federal revenues – compared to around 10% today – which would necessitate much higher taxes or much lower government spending. Or both.
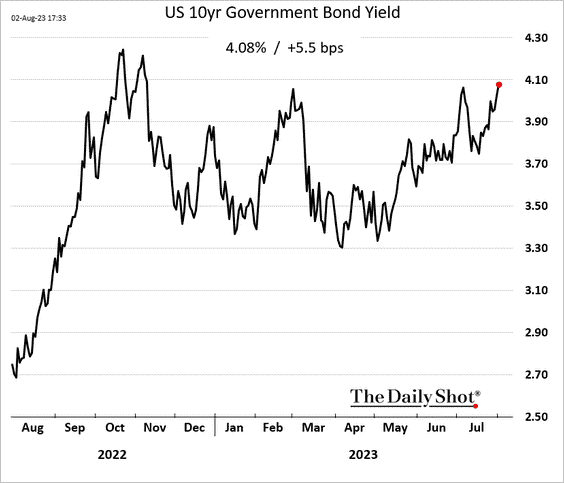
And in theory, if the US debt repayment is less reliable, the interest rate the world charges us to borrow should go up too. We did see US interest rates spike this week. The 10-year Treasury yield increased to the highest level since last November – and well above the 3.5% level it spent a lot of this year at. Today it is almost 4.2%. That could start to create headwinds for stocks again – just like we saw in 2022. And in line with that, stocks have been softer this week, with the Nasdaq falling around 3% so far.
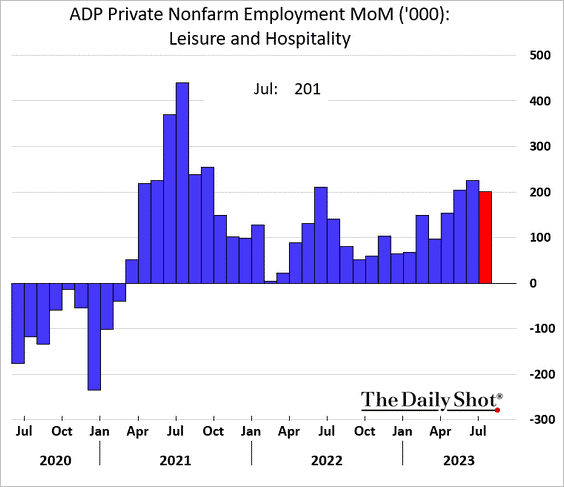
Higher rates could also be due to “good” jobs data
Although the rising US interest rates could also be due to this week’s jobs numbers – which were relatively strong. Layoffs and new jobless claims fell. Although manufacturing sector lost workers, leisure and hospitality hiring continued to grow.
Earnings data shows consumer companies still growing too
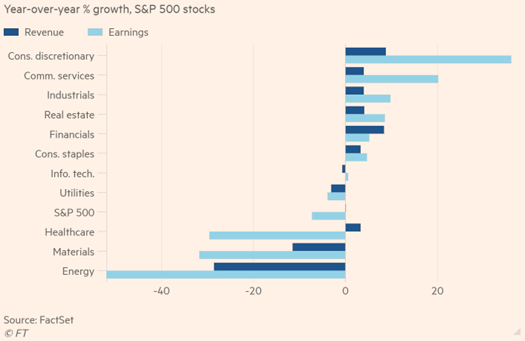
We are seeing a similar story from company earnings too. Consumer sectors are still growing revenues and earnings. Leisure and Hospitality (Airlines, hotels, cruise ships) are helping industrials and consumer discretionary results. However, the Manufacturing slowdown is affecting Energy and Materials companies. Thanks to that, and a couple of other sectors, market-wide earnings are still tracking to fall around 7% year over year – the third quarter in a row of contraction. In short, the consumer still seems to be holding the US economy together. But as spending changes, not every company is a winner.
Gold (GC/) is still getting a fair amount of attention from the investment community, and rightfully so, it remains near multiyear highs despite a prolonged equity rally and recent breakout from interest rates. Although, it feels a bit polarizing (at least anecdotally) – people seem to think gold will either come crashing down or break out to fresh highs with flying colors, and each party thinks the other is crazy.
Admittedly, the market is made up of people acting irrationally, but at the same time, it tends to be quite efficient. So, it pays to understand the other side of a trade. Today we will unpack two reasons why we think gold is still sitting near its chart highs, which could then inform how to position portfolios. We will start with a shorter-term case and conclude with a longer-term case.

Shorter-Term Case: Protection
There are various benefits to owning gold, but one of the most cited reasons is protection; in fact, gold is often outright labeled as a “safe haven” asset. Now, whether the performance numbers hold to that belief across all types of market environments is up for debate, but based on the averages, it tends to hold true. That said, after a historic start to the year for equities many strategists have recently come out with expectations for a “pullback” of some sort in the coming months, mentioning seasonality as a notable headwind along with persistently overbought conditions. We too have echoed these thoughts in recent podcasts, morning update videos, and reports.
While traditional, calendar year seasonality is against equity prices for the next couple of months, presidential election cycle seasonality is in favor of gold. The line chart below and the corresponding return table further this point.
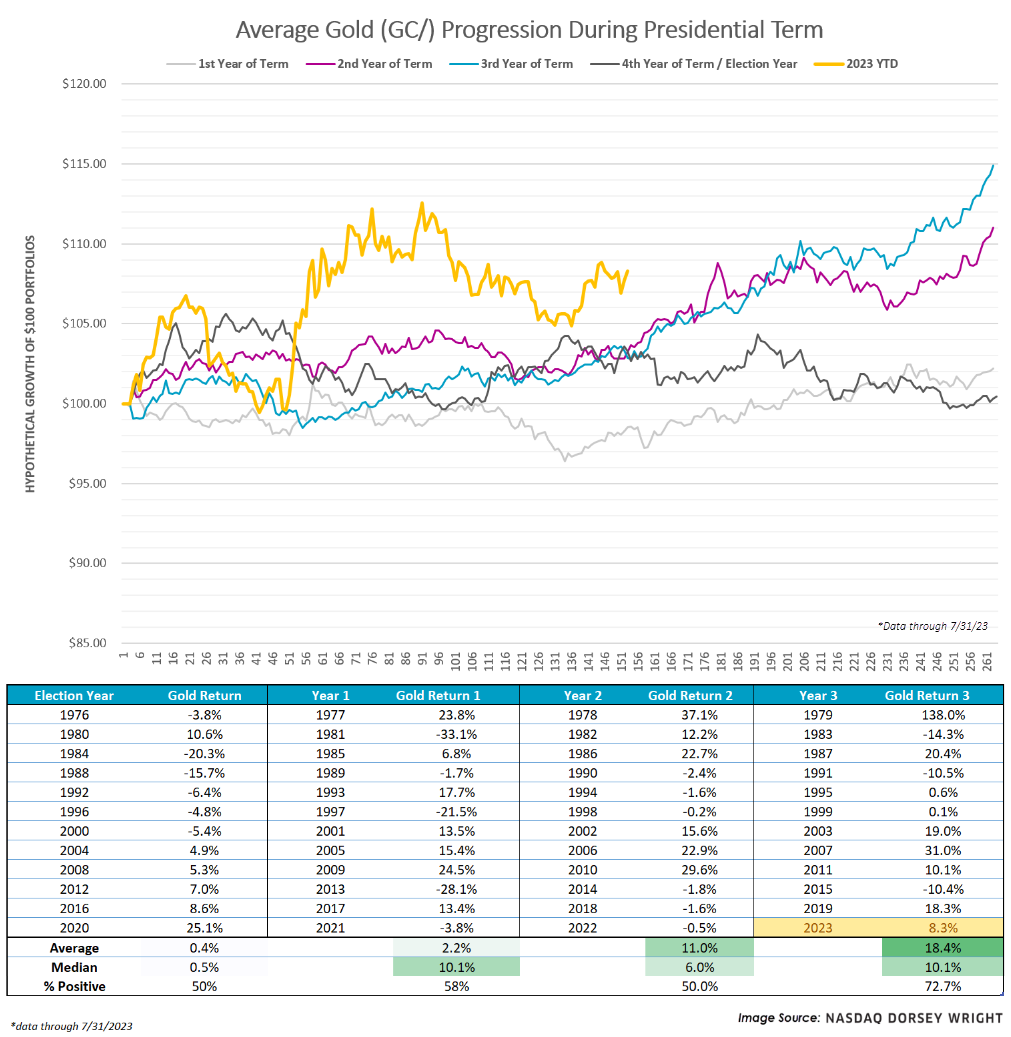
As we can see, gold tends to perform well in the third year of a president’s term, especially in the final stretch of the year. To those who looked closely at the performance table above and noticed the 138% gain in 1979 skewing the returns, even when removing that data point gold averaged a 6.4% gain and was positive 70% of the time. So, the seasonal strength of gold and seasonal weakness for equities, from a calendar and presidential cycle perspective, seem to agree in providing a near-term technical case for gold.
Longer-Term Case: Declining Real Yields
Expectations for inflation and interest rates could also be buoying gold prices. To streamline this discussion today we will talk about real yields, which combine the two topics by reflecting the inflation-adjusted cost of funds to a borrower and/or yield to a lender. A real interest rate can be simply calculated by taking the nominal interest rate and subtracting the rate of inflation (expected or actual).
Declining real yields make bonds less attractive and make other stores of wealth, especially those with values that tend to increase with inflation, more attractive. Of course, the reverse is also true, when real yields increase, it makes bonds more attractive relative to assets that don’t produce any income. In April of this year, we produced a piece on the relationship between real yields and precious metals, and just last week we wrote an update that highlighted gold’s negative correlation with treasury yields.
With all that in mind, gold investors could be expecting a decline in real yields. Potential reasons backing this expectation would be the recent broad-based advance from commodities (like crude oil, agriculture, and copper), which fuels inflation, in addition to forward expectations for monetary policy. Rate hike probabilities (based on Fed futures) have subsided since the last Fed meeting and treasury yields are fighting with firm areas of resistance, in addition to being overextended in the near-term based on their ten-week trading band.
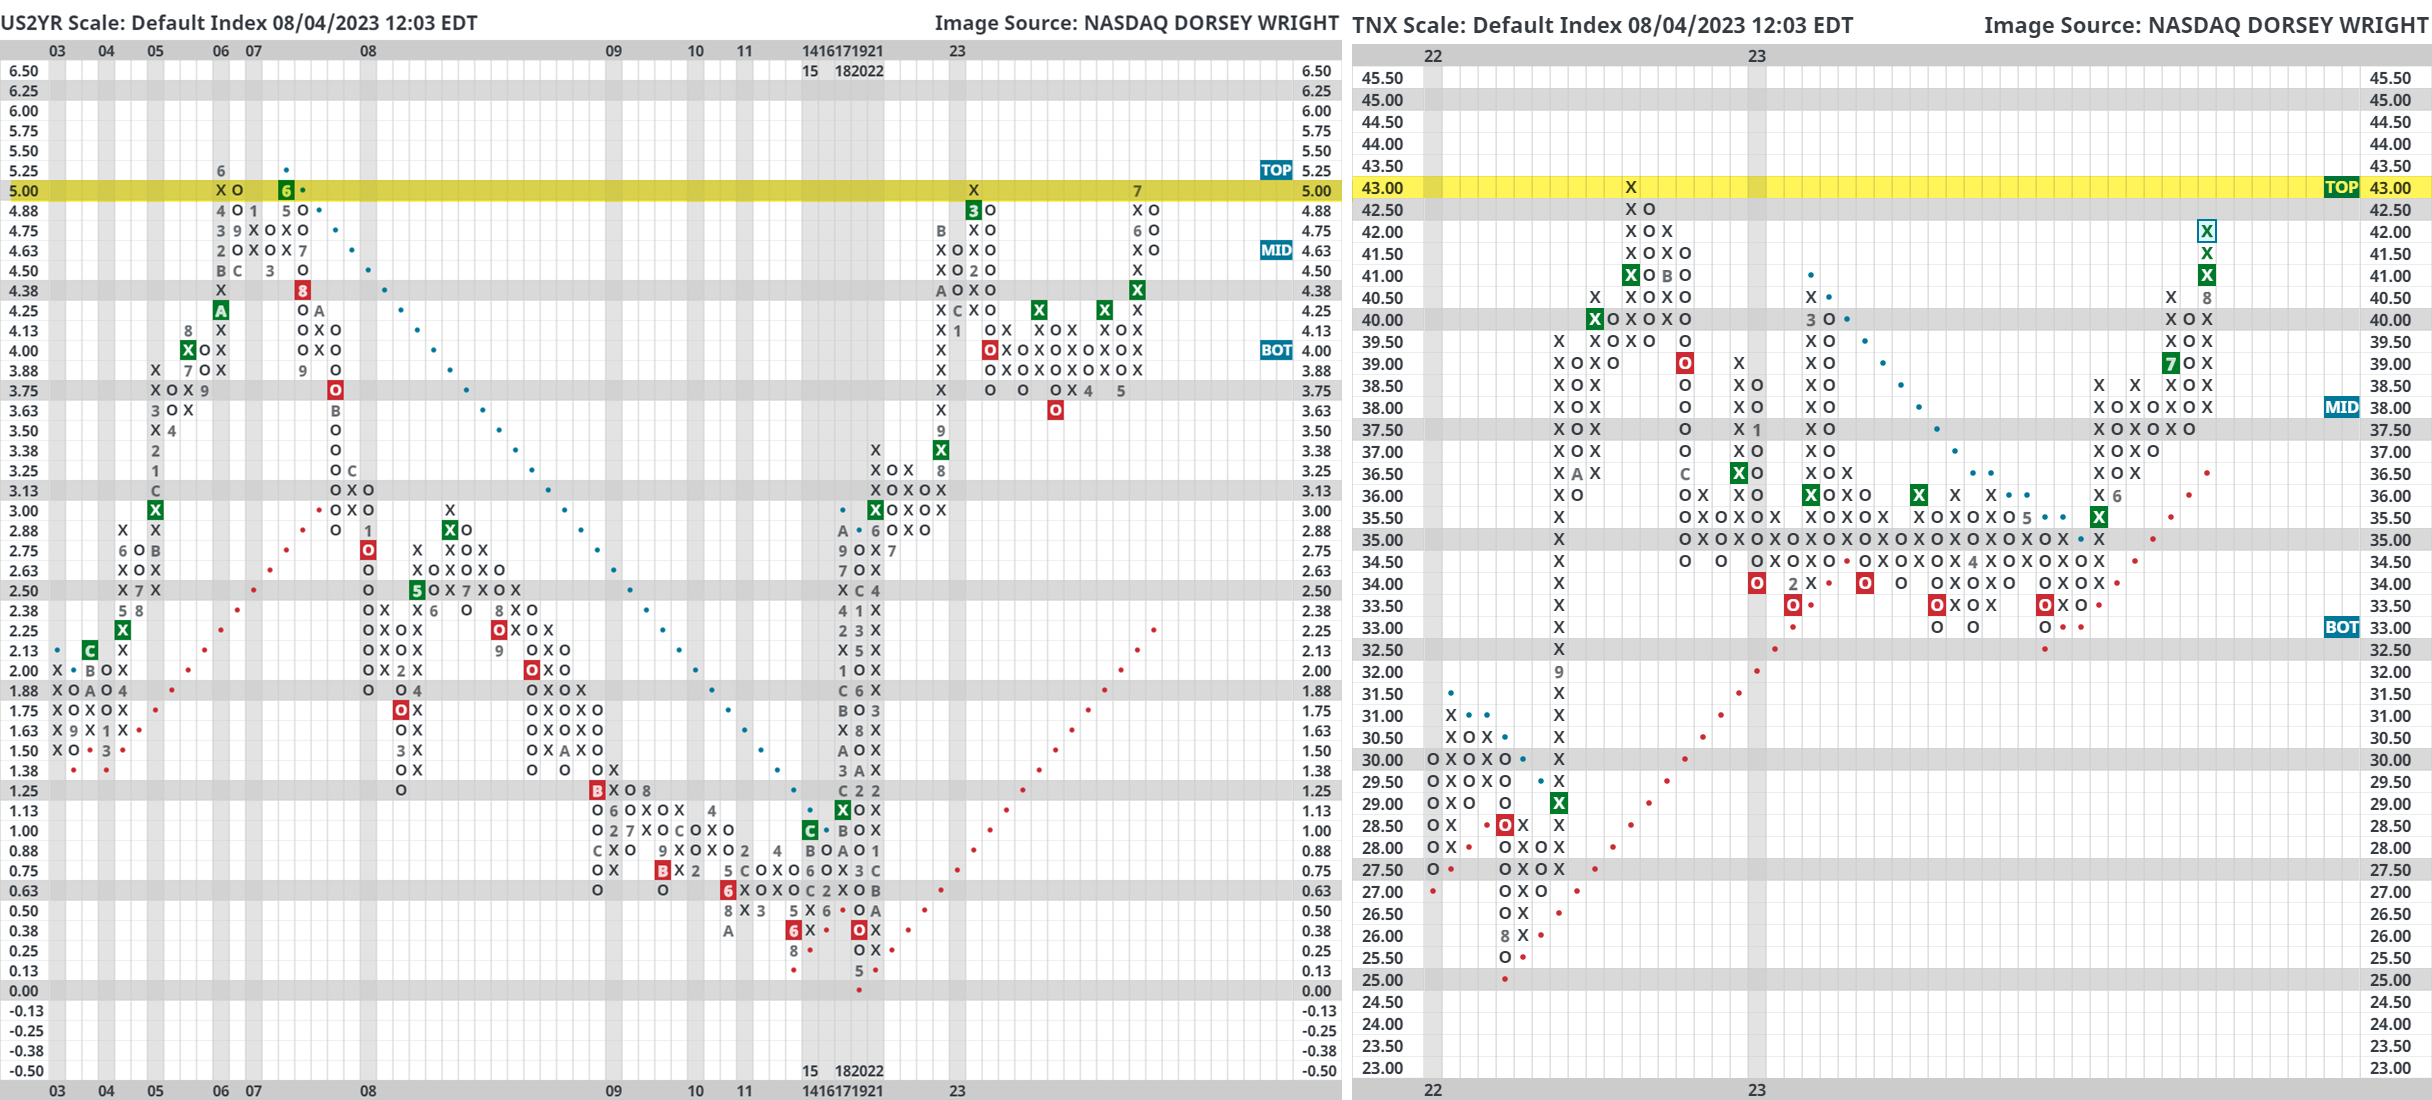
For example, the US 2 Year Yield (US2YR) reversed down into Os on its default Point & Figure chart last month from a multi-decade high of 5%. Although not talked about as frequently, resistance is also very clear on the US 5 Year chart (FVX). The US 10 Year Yield (TNX) got within one box of its multi-decade high at 4.3% (from October of 2022) yet now sits just one box away from reversing down into Os. Also, the US 30 Year Yield (TYX) got within two boxes of its multi-decade highs at 4.4% and now carries its highest weekly overbought (OBOS) reading since October 2022.
We do not discuss fund flows in our commentary very often, but to conclude our piece today we wanted to add a chart from BofA Global Research showing inflows for TIPS (Treasury Inflation-Protected Securities). As written atop the chart, TIPS recently registered their first inflow since August of 2022 which suggests a pickup in investor demand. Although this is currently just a blip on a chart, hopefully it underscores our shorter-term and longer-term points today as to why gold may be hanging around its all-time highs. Furthermore, ideally the passionate gold investors can understand the other side of a well-documented battle going on in the market right now.


| Symbol | Name | Price | Yield | PnF Trend | RS Signal | RS Col. | Fund Score | 200 Day MA | Weekly Mom |
|---|---|---|---|---|---|---|---|---|---|
| DIA | SPDR Dow Jones Industrial Average ETF Trust | 351.99 | 1.90 | Positive | Sell | O | 3.02 | 334.97 | +8W |
| EEM | iShares MSCI Emerging Markets ETF | 40.59 | 2.13 | Positive | Sell | X | 3.56 | 39.04 | +2W |
| EFA | iShares MSCI EAFE ETF | 71.96 | 2.12 | Positive | Sell | X | 3.92 | 69.48 | +4W |
| FM | iShares Frontier and Select EM ETF | 27.50 | 1.82 | Positive | Sell | X | 3.94 | 25.55 | +10W |
| IJH | iShares S&P MidCap 400 Index Fund | 267.69 | 1.52 | Positive | Sell | X | 4.36 | 251.49 | +10W |
| IJR | iShares S&P SmallCap 600 Index Fund | 103.38 | 1.47 | Positive | Sell | O | 2.94 | 97.97 | +16W |
| QQQ | Invesco QQQ Trust | 373.79 | 0.56 | Positive | Sell | X | 4.86 | 312.66 | -5W |
| RSP | Invesco S&P 500 Equal Weight ETF | 152.02 | 1.64 | Positive | Buy | O | 3.87 | 145.10 | +9W |
| SPY | SPDR S&P 500 ETF Trust | 448.84 | 1.43 | Positive | Sell | X | 4.32 | 408.30 | -1W |
| XLG | Invesco S&P 500 Top 50 ETF | 35.35 | 1.04 | Positive | Buy | X | 5.71 | 30.78 | -5W |
The SPDR Dow Jones Industrial Average ETF Trust DIA remains in a column of X’s this week, sitting at $355. The fund remains on its second consecutive buy signal on its default chart. The fund now scores above the 3.0 score threshold, sitting at 3.02. However, it still scores below the average US score of 3.65. DIA remains in a positive trend at current levels. Support is offered at $315 with overhead resistance at current levels.
The iShares MSCI Emerging Markets ETF EEM reversed down into a column of O’s this week to a chart reading of $40.50. However, the action seems to be constructive, as the fund remains on a string of consecutive buy signals. EEM now scores above the acceptable 3.0 threshold with a score posting of 3.56, catching up to developed markets representatives. The fund sees initial support at $39, with more substantial support down around $37.
The iShares MSCI EAFE ETF EFA remains in a column of X’s this week, sitting at 2023 highs at a chart reading of $73. Developed markets have deteriorated slightly, now shown by a positive, but weakening 3.92 fund score. As mentioned previously, however, the spread in fund score between EFA and emerging markets fund EEM is falling. The ETF remains in a positive trend at current levels with established support offered at $70.
The iShares MSCI Frontier and Select EM ETF FM remains in a column of X’s this week after posting a buy signal for the first time since 2021 recently. The fund is now seen at a chart reading of $28.00. FM has an acceptable fund score of 3.94 and is now paired with a positive 2.50 score direction. Support is seen below at $24.50.
The iShares S&P MidCap 400 Index Fund IJH maintains its column of X’s this week. The fund also remains in a positive trend, recently advancing to a price of $270. IJH has a current fund score of 4.36 which is now above the average US score of 3.65. From here, overhead resistance is found at $270 with the bullish support line found below. Further upside participation would see the fund return to a buy signal.
The iShares S&P SmallCap 600 Index Fund IJR remains on a buy signal this week after moving to recent rally highs at $104. Despite the recent action leading to three consecutive buy signals, IJR maintains an improved, but still unacceptable 2.94 fund score. Support is offered below at $97, with overhead resistance found at $108, the highs for the year.
The Invesco QQQ Trust QQQ remains in a column of X’s this week and is seen at a price of $385. Recent positive participation sees the fund hold a strong 4.86 fund score and is paired with a positive 2.33 score direction. This now outpaces the average US fund, which shows a 3.65 average score. Initial support is offered at $290, well below current levels.
The Invesco S&P 500 Equal Weight ETF RSP remains in a column of X’s this week, now seen at a price of $154. RSP holds a negative 1.63 score direction and now displays a 3.87 fund score. This is still behind the average S&P 500 Index fund score of 4.64. The spread between the two has solidified around current levels over the last few weeks. Support is now seen at $140.
The SPDR S&P 500 ETF Trust SPY remains in a column of Xs this week and trades at a price of $455. The fund now posts a strong 4.32 fund score, besting the average US fund score of 3.65. May’s action saw the fund return to a column of X’s against SPXEWI suggesting near-term strength for the cap-weighted names. Support is seen at $385 on the default chart, March lows.
The Invesco S&P 500 Top 50 ETF XLG remains in a column of X’s this week after undergoing a recent share split. With this in mind, the fund is seen at a price of $36, and it remains on a string of three consecutive buys signals. Furthermore, XLG now has a near-perfect 5.71 fund score with a now positive score direction of 3.63. XLG scores above the average US Fund (3.65) and has shown resilience in line with other larger names over the past week. Support is seen at $28.50 on the default chart, notably below current levels.
Average Level
14.03
| < - -100 | -100 - -80 | -80 - -60 | -60 - -40 | -40 - -20 | -20 - 0 | 0 - 20 | 20 - 40 | 40 - 60 | 60 - 80 | 80 - 100 | 100 - > |
|---|---|---|---|---|---|---|---|---|---|---|---|
|
Buy signalvoog
|
|||||||||||
|
Buy signalRSP
|
|||||||||||
|
Buy signalVOOV
|
|||||||||||
|
Buy signalijr
|
|||||||||||
|
Buy signaleem
|
Buy signaliwm
|
||||||||||
|
Buy signalqqq
|
Buy signalspy
|
||||||||||
|
Sell signalief
|
Buy signalhyg
|
Sell signaldx/y
|
Buy signaloneq
|
Sell signalijh
|
|||||||
|
Sell signalagg
|
Sell signalGLD
|
Buy signalfxe
|
Sell signaldvy
|
Buy signalgcc
|
Buy signalgsg
|
||||||
|
Sell signaltlt
|
Sell signallqd
|
Buy signalshy
|
Buy signalefa
|
Buy signalicf
|
Buy signalXLG
|
Buy signaldia
|
Buy signaluso
|
||||
| < - -100 | -100 - -80 | -80 - -60 | -60 - -40 | -40 - -20 | -20 - 0 | 0 - 20 | 20 - 40 | 40 - 60 | 60 - 80 | 80 - 100 | 100 - > |
| AGG | iShares US Core Bond ETF |
| USO | United States Oil Fund |
| DIA | SPDR Dow Jones Industrial Average ETF |
| DVY | iShares Dow Jones Select Dividend Index ETF |
| DX/Y | NYCE U.S.Dollar Index Spot |
| EFA | iShares MSCI EAFE ETF |
| FXE | Invesco CurrencyShares Euro Trust |
| GLD | SPDR Gold Trust |
| GSG | iShares S&P GSCI Commodity-Indexed Trust |
| HYG | iShares iBoxx $ High Yield Corporate Bond ETF |
| ICF | iShares Cohen & Steers Realty ETF |
| IEF | iShares Barclays 7-10 Yr. Tres. Bond ETF |
| LQD | iShares iBoxx $ Investment Grade Corp. Bond ETF |
| IJH | iShares S&P 400 MidCap Index Fund |
| ONEQ | Fidelity Nasdaq Composite Index Track |
| QQQ | Invesco QQQ Trust |
| RSP | Invesco S&P 500 Equal Weight ETF |
| IWM | iShares Russell 2000 Index ETF |
| SHY | iShares Barclays 1-3 Year Tres. Bond ETF |
| IJR | iShares S&P 600 SmallCap Index Fund |
| SPY | SPDR S&P 500 Index ETF Trust |
| TLT | iShares Barclays 20+ Year Treasury Bond ETF |
| GCC | WisdomTree Continuous Commodity Index Fund |
| VOOG | Vanguard S&P 500 Growth ETF |
| VOOV | Vanguard S&P 500 Value ETF |
| EEM | iShares MSCI Emerging Markets ETF |
| XLG | Invesco S&P 500 Top 50 ETF |

| Symbol | Company | Sector | Current Price | Action Price | Target | Stop | Notes |
|---|---|---|---|---|---|---|---|
| GPK | Graphic Packaging Intl. | Forest Prods/Paper | $22.92 | 21 - 23 | 26 | 18 | 5 for 5'er, #2 of 15 in favored FORE sector matrix, LT pos mkt RS, triple top, 1.3% yield, Earn. 8/1 |
| V | Visa Inc. | Finance | $238.76 | 210s - 220s | 262 | 188 | 5 for 5'er top third of FIN sector matrix, LT pos mkt RS, spread quintuple top |
| BJRI | BJ's Restaurants Inc. | Restaurants | $36.23 | low 30s | 55 | 26 | 3 for 5'er, top third of favored REST sector matrix, triple top, pullback from 52-week high, R-R>3.5 |
| TXRH | Texas Roadhouse, Inc. | Restaurants | $110.93 | 100s | 125 | 90 | 5 TA rating, top half REST sector matrix, consec. buy signals, LT RS buy, 2.10% yield |
| BRK.B | Berkshire Hathaway Inc | Insurance | $353.81 | mid 300s - low 330s | 396 | 280 | 5 TA rating, top third of INSU sector matrix, LT pos. trend, LT RS buy, buy-on-pullback |
| DRI | Darden Restaurants, Inc. | Restaurants | $162.93 | mid 150s - mid 160s | 192 | 130 | 5 TA rating, pos. trend, LT RS buy, pos. weekly mom., recent price normalization |
| VVV | Valvoline Inc | Autos and Parts | $36.12 | mid - hi 30s | 53 | 30 | 5 TA rating, top third in the AUTO sector RS matrix, consec. buy signals, buy-on-pullback, R-R > 2, Earn. 8/9 |
| PEP | PepsiCo, Inc. | Food Beverages/Soap | $187.12 | 180 - lo 190s | 250 | 152 | 4 TA rating, top third of FOOD sector matrix, LT RS buy, normalized entry point, 2.72% yield |
| SEM | Select Medical Holdings Corporation | Healthcare | $30.44 | hi 20s - lo 30s | 52.50 | 23 | 5 TA rating, top third of HEAL sector matrix, LT RS buy, normalized prices, recent pos. wkly mom., R-R > 3, Earn. 8/3 |
| MDLZ | Mondelez International, Inc. Class A | Food Beverages/Soap | $75.29 | hi 60s - mid 70s | 95 | 59 | 4 for 5'er. top 25% of favored FOOD sector matrix, multiple buy signals, pullback from ATH, 2.1% yield |
| AJG | Arthur J. Gallagher & Co. | Insurance | $222.20 | hi 200s - hi 210s | 298 | 180 | 5 for 5'er, 10 of 71 in favored INSU sector matrix, LT pos mkt RS, R-R>2.0 |
| RSG | Republic Services, Inc. | Waste Management | $149.12 | lo 140s - mid 150s | 190 | 120 | 5 TA rating, top third of WAST sector matrix, consec. buy signals, pos. wkly mom. |
| ALKS | Alkermes Incorporated | Biomedics/Genetics | $27.63 | hi 20s - low 30s | 48 | 24 | 5 for 5'er, top half of favored BIOM sector matrix, spread triple top, pull back from 52-week high, R-R>3.0 |
| ACA | Arcosa Inc | Transports/Non Air | $76.02 | low-to-mid $70s | 98 | 65 | 4 for 5'er, #8 of 50 in favored TRAN sector matrix, one box from peer RS buy signal, R-R>2.0, Earn. 8/3 |
| LIN | Linde Plc | Chemicals | $380.75 | 370s - 380s | 440 | 316 | 5 for 5'er, #6 of 47 in favored CHEM sector matrix, LT pos mkt RS, triple top, 1.35% yield |
| FERG | Ferguson PLC | Building | $158.70 | lo 150s - mid 160s | 204 | 132 | 4 TA rating, LT mkt RS buy & pos. trend, consec. buy signals, near-term price consolidation |
| LULU | Lululemon Athletica Inc. | Retailing | $384.00 | 370s - 390s | 452 | 320 | 5 for 5'er, top 25% of RETA sector matrix, triple top, Earn. 8/30 |
| HWC | Hancock Whitney Corp | Banks | $43.80 | hi 30s - mid 40s | 66 | 34 | 5 TA rating, top half of BANK sector matrix, LT RS buy, pos. wkly mom., 2.83% yield |
| MSFT | Microsoft Corporation | Software | $326.66 | 330s - 350s | 376 | 272 | 5 for 5'er, top third of favored SOFT sector matrix, LT pos RS, multiple buy signals, pullback from ATH |
| CAH | Cardinal Health, Inc. | Drugs | $93.77 | hi 80s - mid 90s | 112 | 74 | 5 TA rating, top quintile of DRUG sector matrix, consec. buy signals, buy-on-pullback, Earn. 8/15 |
| ALLE | Allegion PLC | Protection Safety Equipment | $111.59 | 110s | 139 | 98 | 4 for 5'er, top half of favored PROT sector matrix, pullback from 52-week high, 1.5% yield |
| HLT | Hilton Worldwide Holdings Inc | Leisure | $150.66 | 150s | 188 | 128 | 5 for 5'er, top half of favored LEIS sector matrix, LT pos mkt RS |
| WELL | Welltower Inc. | Real Estate | $83.79 | hi - lo 80s | 100 | 72 | 5 TA rating, top quintile of REAL sector matrix, 52-wk highs, LT RS buy |
| CC | The Chemours Company | Chemicals | $36.57 | mid 30s | 52 | 29 | 5 for 5'er, #3 of 47 in favored CHEM sector matrix, spread quad top, 2.7% yield |
| APAM | Artisan Partners Asset Management, Inc | Finance | $38.30 | mid 30s - lo 40s | 54 | 31 | 4 TA rating, top quintile of FINA sector matrix, consec. buy signals, buy-on-pullback, R-R > 2 |
| SYK | Stryker Corporation | Healthcare | $275.62 | mid 270s - mid 290s | 356 | 248 | 4 for 5'er, 41 of 122 in HEAL sector matrix, LT pos mkt RS, pullback from ATH |
| Symbol | Company | Sector | Current Price | Action Price | Target | Stop | Notes |
|---|
| Symbol | Company | Sector | Current Price | Action Price | Target | Stop | Notes |
|---|---|---|---|---|---|---|---|
| VRTX | Vertex Pharmaceuticals Incorporated | Biomedics/Genetics | $347.74 | hi 330s - lo 370s | 444 | 280 | VRTX fell to sell signal on Friday. OK to hold here. Raise stop to $316 |
| Comment | |||||||
|---|---|---|---|---|---|---|---|
|
|
|||||||
SYK Stryker Corporation R ($283.46) - Healthcare - SYK is a 4 for 5'er that ranks 41st out of 122 names in the healthcare sector matrix and has been on a market RS buy signal since 2019. On its default chart, the stock has completed four consecutive buy signals and reached a new all-time high in June before pulling back to the middle of its trading band., offering an entry point long exposure. Positions may be added in the mid-$270s to mid $290s and we will set our initial stop at $248, which would violate SYK's bullish support line. We will use the bullish price objective, $356, as our target price.
| 22 | 23 | |||||||||||||||||||||||||||||||||||||||||||||||||||
| 304.00 | X | X | 304.00 | |||||||||||||||||||||||||||||||||||||||||||||||||
| 300.00 | X | O | X | O | 300.00 | |||||||||||||||||||||||||||||||||||||||||||||||
| 296.00 | X | O | X | O | 296.00 | |||||||||||||||||||||||||||||||||||||||||||||||
| 292.00 | X | 5 | X | 7 | X | 292.00 | ||||||||||||||||||||||||||||||||||||||||||||||
| 288.00 | 4 | O | X | O | X | Mid | 288.00 | |||||||||||||||||||||||||||||||||||||||||||||
| 284.00 | • | • | X | X | O | X | O | X | 284.00 | |||||||||||||||||||||||||||||||||||||||||||
| 280.00 | 9 | • | • | • | X | • | • | X | O | X | O | 6 | 8 | X | 280.00 | |||||||||||||||||||||||||||||||||||||
| 276.00 | X | O | X | • | X | • | 1 | O | • | X | • | X | O | X | O | X | O | X | 276.00 | |||||||||||||||||||||||||||||||||
| 272.00 | X | X | O | X | O | B | O | • | X | O | • | • | • | X | X | O | • | X | O | 3 | O | X | O | 272.00 | ||||||||||||||||||||||||||||
| 268.00 | X | O | X | O | X | O | X | O | • | X | O | 3 | • | X | • | X | O | X | O | • | X | O | X | O | 268.00 | |||||||||||||||||||||||||||
| 264.00 | X | O | X | O | X | O | X | O | X | X | O | X | O | X | O | X | O | X | O | • | X | 2 | O | X | 264.00 | |||||||||||||||||||||||||||
| 260.00 | X | 8 | X | A | O | • | O | X | O | X | O | X | X | O | X | O | X | 4 | • | O | • | X | O | X | O | 260.00 | ||||||||||||||||||||||||||
| 256.00 | X | O | X | • | O | X | O | X | O | X | O | X | O | X | O | • | O | • | X | X | O | X | Bot | 256.00 | ||||||||||||||||||||||||||||
| 252.00 | X | O | • | O | C | O | X | O | 2 | O | X | O | X | • | O | • | X | O | X | O | 252.00 | |||||||||||||||||||||||||||||||
| 248.00 | • | O | X | O | X | O | X | O | O | X | • | O | • | X | O | 1 | • | 248.00 | ||||||||||||||||||||||||||||||||||
| 244.00 | • | O | X | O | • | O | X | O | • | O | X | • | X | O | X | • | 244.00 | |||||||||||||||||||||||||||||||||||
| 240.00 | • | O | • | • | O | • | 5 | X | O | • | X | O | X | • | 240.00 | |||||||||||||||||||||||||||||||||||||
| 236.00 | • | • | O | X | O | • | C | O | • | 236.00 | ||||||||||||||||||||||||||||||||||||||||||
| 232.00 | O | O | X | • | • | X | • | 232.00 | ||||||||||||||||||||||||||||||||||||||||||||
| 228.00 | O | X | O | • | • | X | • | X | • | 228.00 | ||||||||||||||||||||||||||||||||||||||||||
| 224.00 | 6 | 8 | X | O | X | • | X | O | X | • | 224.00 | |||||||||||||||||||||||||||||||||||||||||
| 220.00 | O | X | O | X | O | X | O | X | O | X | • | 220.00 | ||||||||||||||||||||||||||||||||||||||||
| 216.00 | O | X | O | X | O | A | X | O | X | B | X | • | 216.00 | |||||||||||||||||||||||||||||||||||||||
| 212.00 | O | X | O | X | O | X | O | X | O | • | O | X | • | 212.00 | ||||||||||||||||||||||||||||||||||||||
| 208.00 | O | X | O | X | O | X | O | X | • | O | • | 208.00 | ||||||||||||||||||||||||||||||||||||||||
| 204.00 | O | X | 7 | X | 9 | O | O | • | • | 204.00 | ||||||||||||||||||||||||||||||||||||||||||
| 200.00 | O | X | O | X | O | X | • | 200.00 | ||||||||||||||||||||||||||||||||||||||||||||
| 198.00 | O | X | O | X | O | X | • | 198.00 | ||||||||||||||||||||||||||||||||||||||||||||
| 196.00 | O | X | O | O | X | • | 196.00 | |||||||||||||||||||||||||||||||||||||||||||||
| 194.00 | O | O | X | • | 194.00 | |||||||||||||||||||||||||||||||||||||||||||||||
| 192.00 | O | X | • | 192.00 | ||||||||||||||||||||||||||||||||||||||||||||||||
| 190.00 | O | • | 190.00 | |||||||||||||||||||||||||||||||||||||||||||||||||
| 188.00 | • | 188.00 | ||||||||||||||||||||||||||||||||||||||||||||||||||
| 22 | 23 |
| AAPL Apple Inc. ($185.48) - Computers - AAPL moved lower on Friday after their earnings release to break a double bottom at $186 before falling to $184 intraday. This marks the first sell signal for the 5 for 5'er after five consecutive buy signals. The stock still remains in a positive trend and sits in the top quartile of the favored computers sector RS matrix, signifying strength in its long-term technical picture. This week's pullback simply suggests near-term weakness after such rapid acceleration throughout the first seven months of the year. Further support may be seen at $178. Overhead resistance may come at the all-time highs of $198 from last month. |
| NET Cloudflare Inc Class A ($72.96) - Computers - OLED rose after their earnings release to break a double top at $148 before reaching $160 intraday, notching a 15% gain and a new 52-week high. This 4 for 5'er moved to a positive trend in November of last year. The technical picture remains favorable from a longer-term perspective and is showing near-term strength. Initial support may be seen at $136 with further support offered at $136 and $132. The potential for further overhead resistance may be found at $176. |
| Name | Option Symbol | Action | Stop Loss |
|---|---|---|---|
| Darden Restaurants, Inc. - $162.78 | O: 23J160.00D20 | Buy the October 160.00 calls at 9.00 | 156.00 |
| Name | Option | Action |
|---|---|---|
|
|
||
| Name | Option Symbol | Action | Stop Loss |
|---|---|---|---|
| Pilgrim's Pride Corporation - $25.34 | O: 23X26.00D15 | Buy the December 26.00 puts at 2.10 | 27.00 |
| Name | Option | Action |
|---|---|---|
|
|
||
| Name | Option Sym. | Call to Sell | Call Price | Investment for 500 Shares | Annual Called Rtn. | Annual Static Rtn. | Downside Protection |
|---|---|---|---|---|---|---|---|
| Tempur Sealy International Inc. $45.94 | O: 23L47.50D15 | Dec. 47.50 | 3.10 | $21,680.35 | 23.29% | 16.51% | 5.68% |
| Name | Action |
|---|---|
| CrowdStrike Holdings, Inc. Class A (CRWD) - 157.55 | Sell the October 155.00 Calls. |
| Palantir Technologies Inc. Class A (PLTR) - 18.71 | Sell the November 18.00 Calls. |
| Schlumberger Limited (SLB) - 57.98 | Sell the November 60.00 Calls. |
| KB Home (KBH) - 53.24 | Sell the October 55.00 Calls. |
| Caesars Entertainment Inc. (CZR) - 55.00 | Sell the December 60.00 Calls. |
| CF Industries Holdings, Inc. (CF) - 81.23 | Sell the November 85.00 Calls. |
| United Airlines Holdings Inc. (UAL) - 52.16 | Sell the December 55.00 Calls. |
| Halliburton Company (HAL) - 39.69 | Sell the January 42.00 Calls. |
| Name | Covered Write |
|---|---|
|
|
|
Daily Equity & Market Analysis
Loading, Please Wait...
