Different presidential cycles have different variables that play into market returns, but we have seen similar themes play out over the years. Today, we examine how historical market returns have seen similarities to recent movement in the S&P 500 Index, and potential areas to monitor over the next few months.
Different presidential cycles have different variables that play into market returns, but we have seen similar themes play out over the years. To show this, we took the quarterly returns for the S&P 500 Index SPX since 1927 and organized them by the year of each presidential term. The data showed that the second year of a presidential term typically carries the worst returns, with SPX showing a modest gain of 3.33%, while the third year of a presidential term shows the best average return at a 13.51% gain. This general tendency has held true over the past few years, as we saw sharply negative returns last year followed by a strong gain in 2023. The quarterly data also highlights how the strength the S&P 500 experienced in the first two quarters of this year is also in line with historical norms, as the first half of the third year of a presidential term generally sees strong improvement at averages north of 4%. That improvement was amplified in the first half of this year, but we also saw amplified movement to the downside last year.
As we are often reminded, past performance is not indicative of future results. However, the consistency of recent movements with historical tendencies makes these trends important points to monitor as we move through the end of the third year of President Biden’s term. The third quarter of year three in any presidential term generally shows more muted results for equity markets, with the S&P 500 posting an average gain of just 0.39%. The fourth quarter of year three tends to show a rebound in performance, but the potential for underperformance over the next two months should be kept in mind as we round out the summer months.

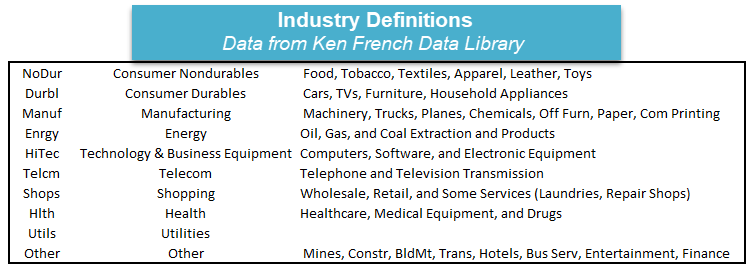
Even if we might expect more muted returns from the market benchmarks, that does not mean all areas of the market experience the same movement. We dove deeper into the examination by using the historical performance of 10 broad domestic equity industry sectors using data pulled from the Ken French Data Library. This is the same Ken French from the famous Fama-French Model. This data was used as it ran from December 1926 through June 2023, allowing us to take our testing back significantly further than what the current GICs sectors offer. A breakdown of what is included in each of the ten industries can be found below:
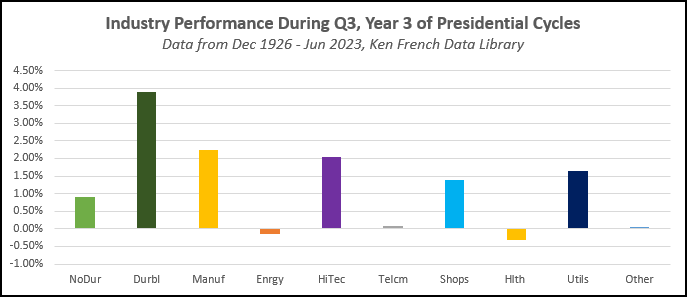
Using these industry classifications, we filtered through the data for returns during the third year of each presidential cycle. This showed that the Technology & Business equipment classification tends to post the strongest returns in year three, at an average gain of over 26%. Consumer Durables show the next highest returns at an average of almost 22%. These themes have remained relatively consistent over the first six months of the year. Narrowing the performance down to just Q3 of the third year in each presidential cycle reveals some interesting results. First, the returns for each sector in Q3 of year three are lower than the average Q3 returns in any year. Consumer Durables show the highest average returns in Q3 of presidential year three, with Manufacturing showing the second highest returns. While these industry breakdowns may not match up directly with current sector norms, the legend provided above may suggest some interesting places to monitor for the next two months, even with the potential for more muted returns.