
This week, commodities moved up to overtake cash for second place in the DALI asset class rankings. One contributor to the increase in the strength of commodities has been energy prices – crude oil has gained more than 19% since hitting a 52-week low in March. Also contributing to the strength of commodities is a recent resurgence in precious metals. Since the beginning of March, gold ([GC/]) has gained more than 9%, while silver ([SI]) is up over 21%; and silver now ranks fourth (out of 21 assets) in the continuous commodity matrix.
This week, commodities moved up to overtake cash for second place in the DALI asset class rankings. One contributor to the increase in the strength of commodities has been energy prices – crude oil has gained more than 19% since hitting a 52-week low in March. Also contributing to the strength of commodities is a recent resurgence in precious metals. Since the beginning of March, gold (GC/) has gained more than 9%, while silver (SI) is up over 21%; and silver now ranks fourth (out of 21 assets) in the continuous commodity matrix.
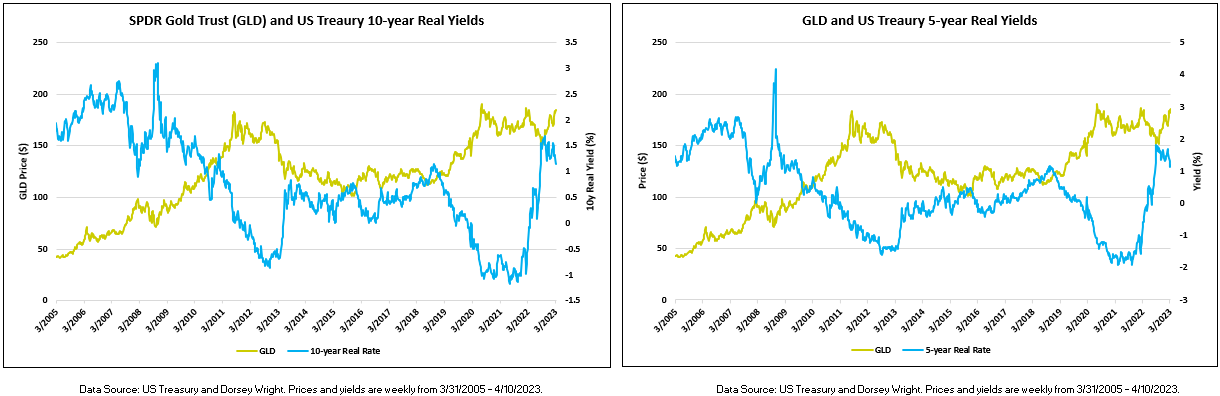
One factor helping to drive the strength in precious metals is that bond yields, both real and nominal, have dropped significantly since the beginning of March as investors reassessed the likelihood of additional rate hikes and flocked to the relative safety of Treasuries in the face of regional bank failures last month. Declining real yields make bonds less attractive and make other stores of wealth, especially those with values that tend to increase with inflation, more attractive. Of course, the reverse is also true, when real yields increase, it makes bonds more attractive relative to assets that don’t produce any income. As you can see in the charts below, there is an easily discernable inverse relationship between precious metals prices and real yields.


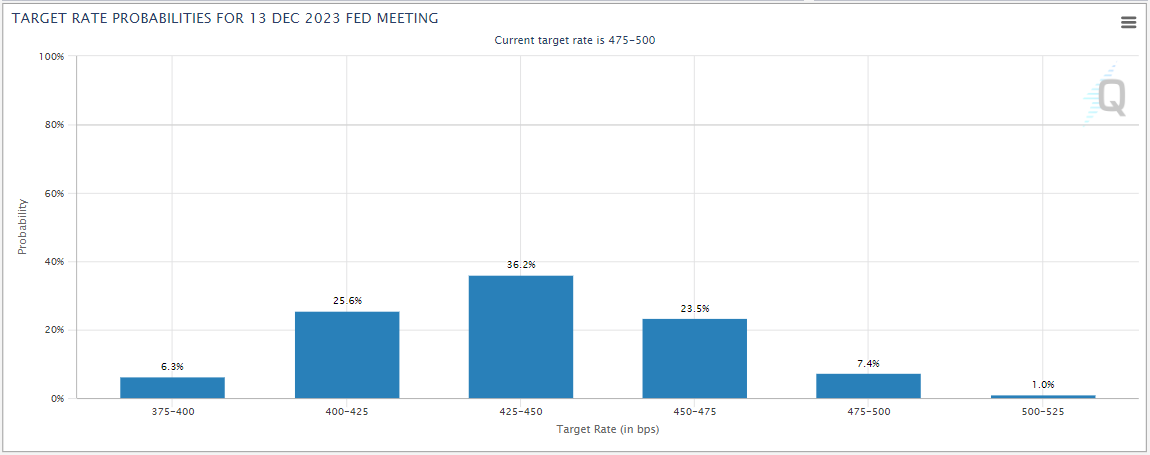
There is evidence to suggest that the current trend in Treasury yields is to the downside. Both the five- (FVX) and 10-year (TNX) US Treasury yield indexes are on sell signals and in negative trends on their default charts. Meanwhile, the Fed futures market is pricing in a better than 80% chance that the Fed will cut rates by at least 25 basis points from the current target of 475 – 500 bps. Of course, TNX, FVX, and the fed funds rate are nominal rates, so a significant drop in inflation, could result in higher real yields even if these nominal yields decline. However, all else being equal, if the trend in yields continues and the market’s prediction for rate cuts later this year is accurate, it could act as a continued tailwind for precious metals. For those interested in adding exposure to precious metals, the most readily accessible way to do so may be through an ETF like the iShares Silver Trust (SLV) or the SPDR Gold Trust (GLD).
The iShares Silver Trust (SLV) currently has a strong 5.67 fund score and a positive 4.58 score direction. On its default chart, SLV returned to a buy signal last week when it broke a triple top at $23, taking out resistance that had been in place since January. However, while it shows a decidedly strong technical picture, SLV now sits in heavily overbought territory with a weekly overbought/oversold (OBOS) reading north of 100%. So those interested in adding exposure to the fund may be best served to do so on a pullback or to wait for prices to normalize near current levels. On its default chart, SLV shows no support until $18.50, more than 25% below its current level. However, on its $0.125-per-box chart, the fund has recently found support at $22.63 and $21, so investors looking to add exposure on a pullback could potentially target one of these levels.
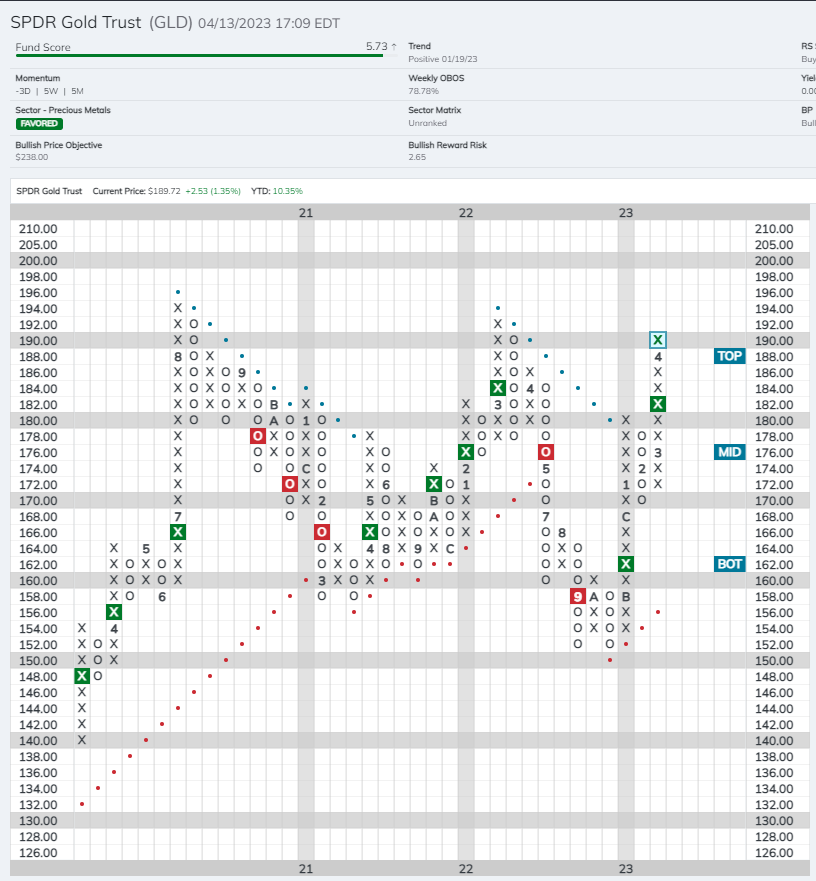
The SPDR Gold Trust (GLD) shows a similarly strong 5.73 fund score and 3.71 score direction. GLD has completed two consecutive buy signals, most recently breaking a double top at $182 in mid-March. The fund currently sits at $190, and it also sits in heavily overbought territory with a weekly OBOS reading just under 80%. On its default chart, the first level of support sits at $170; however, on its $1-per-box-chart, GLD has recently found multiple levels of support between $180 and $185.
For those considering adding positions in GLD or SLV it is worth noting that both funds hold physical metal, as opposed to exposure gained through futures contracts. Due to this structure, gains on positions are taxed as collectibles – the same as if you owned silver or gold bullion – which is generally higher than the rate on other investments. One upside of this structure, is that owning these funds will not generate a K-1, as is the case with most commodities funds that gain their exposure via futures contracts.
