Most Requested Symbols

In today's Midweek Macro from the Nasdaq Economic Research Team, US Economist Michael Normyle discusses June CPI data and the initial reaction from markets.
International Small Caps have shown improvement, with emerging markets leading the way.
The average distribution level is 21.11%.
Today's featured stock is Alkermes Incorporated (ALKS).
Comments include: AFL, AVGO, AZO, DKS, LAMR, LEN, LVMUY, MGM, OLED, REG, & STT.
Call: Molson Coors Company (TAP), Put: Southwest Airlines Co. (LUV), Covered Write: Steel Dynamics Inc. (STLD)
NDW Morning Update Video - July 13, 2023
NDW Morning Update Video
Click here to download MP3
Note to Wells Fargo Advisors: A CAR approved version of last Thursday's 2Q23 Newsletter has been added to the Media & Education section of the Resources tab. The CAR # is CAR-0723-00391.
On July 24th the Nasdaq 100 will undergo a special rebalancing for the third time in its history and the first time since 2011. The reason for the special rebalancing is due to the aggregate weight of companies, each having more than 4.5% weight in the index, exceeds 48%. While the rebalancing takes place, the cap is set to 40%. The adjustment will be based on shares outstanding as of July 3rd. Five stocks have at least a 4.5% weight including names like Microsoft (12.91%), Nvidia (7.04%), Amazon (6.89%), and Tesla (4.50%). The effects of the change will be more felt after the rebalance takes place. As most are aware, much of the performance attribution for both the Nasdaq 100 and S&P 500 indices have been at the hands of the stocks previously mentioned. Now that they will have a lower weighting in the Nasdaq 100, the influence these names have on the index will be less. Since Alphabet has two share classes, despite the total weighting of the two share classes exceeding the 4.5% threshold, it will not be affected by the rebalance.
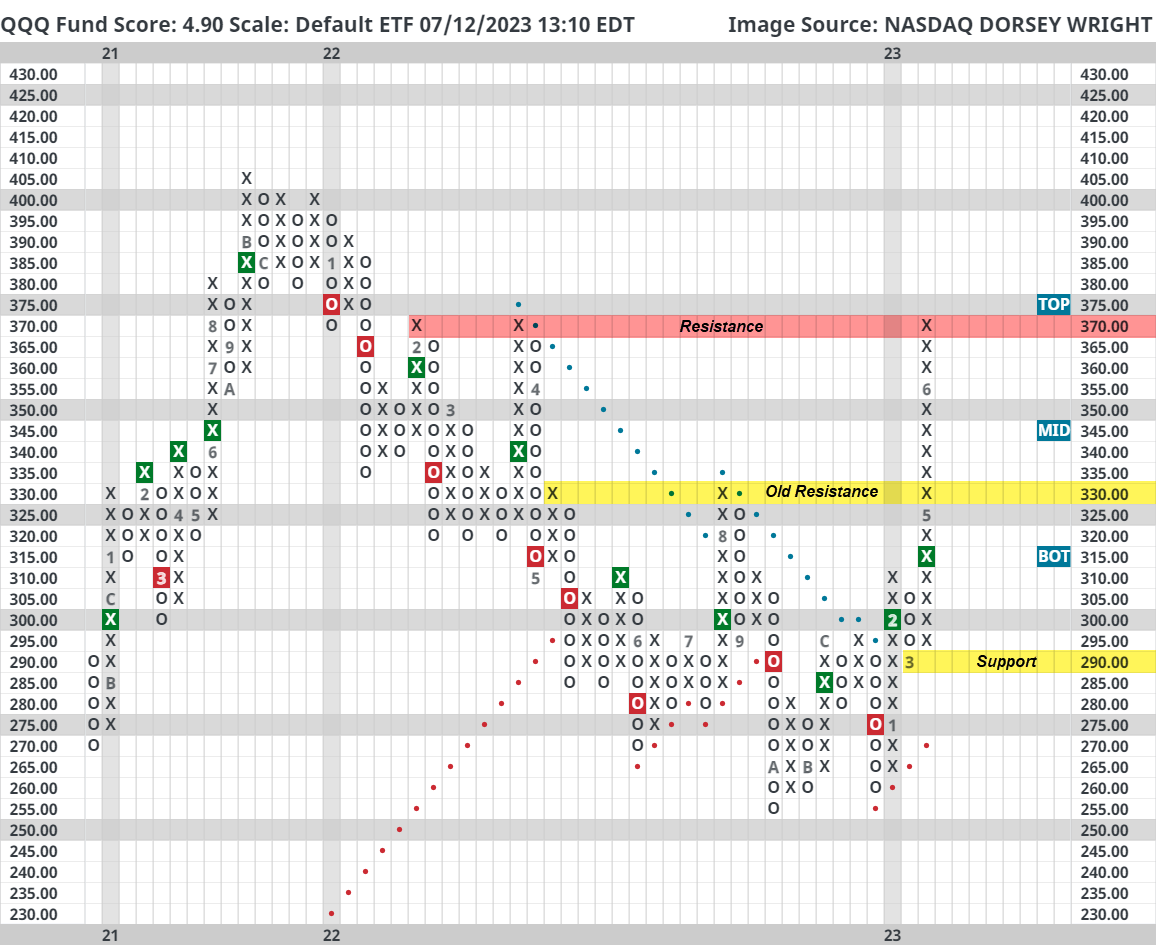
From a technical standpoint, the Nasdaq 100 has had an exceptionally strong year thus far, well noted in our research so far this year. The Invesco QQQ Trust (QQQ) has gained 38.26% year-to-date and possesses a strong fund score of 4.90. QQQ does sit in heavily overbought territory with a weekly overbought/oversold reading of 70% and is trading on a stem. Its current chart level of $370 is at a notable area of resistance dating back to February and April of 2022. From $370, its next level of true support is offered at $290, however, the $330 level may also act as support if revisited since it was a major resistance level previously. Nonetheless, the strength in Nasdaq 100 and other large-cap growth names has been exceptional so far this year and has yet to show any major signs of slowing down aside from some potential short-term headwinds.

In today's Midweek Macro from the Nasdaq Economic Research Team, US Economist Michael Normyle discusses June CPI data and the initial reaction from markets.
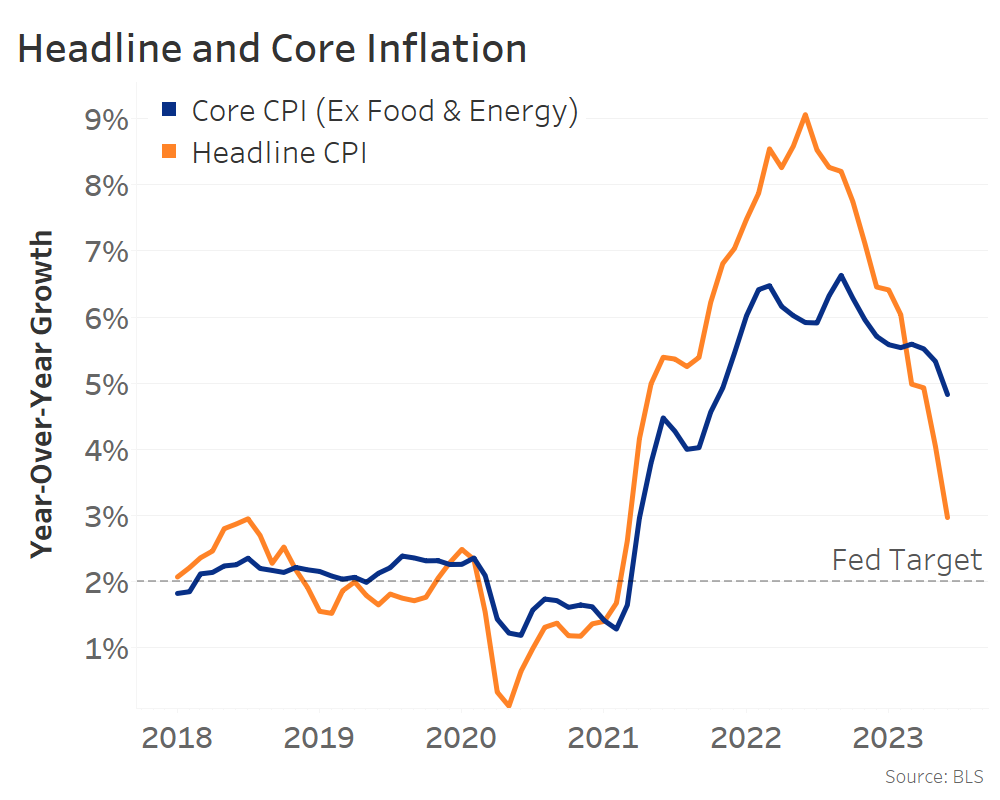
Headline and Core CPI fall more than markets expected
This morning, June’s CPI data came in lower than markets expected, especially core.
Headline dropped to 3.0% YoY (chart below, orange line) – that’s a lot lower than it was one year ago, when it peaked at 9.1% YoY.
The bigger surprise was that core CPI fell to 4.8% YoY from 5.3% (blue line) – consensus forecasts were for it to only slow to 5.1%.
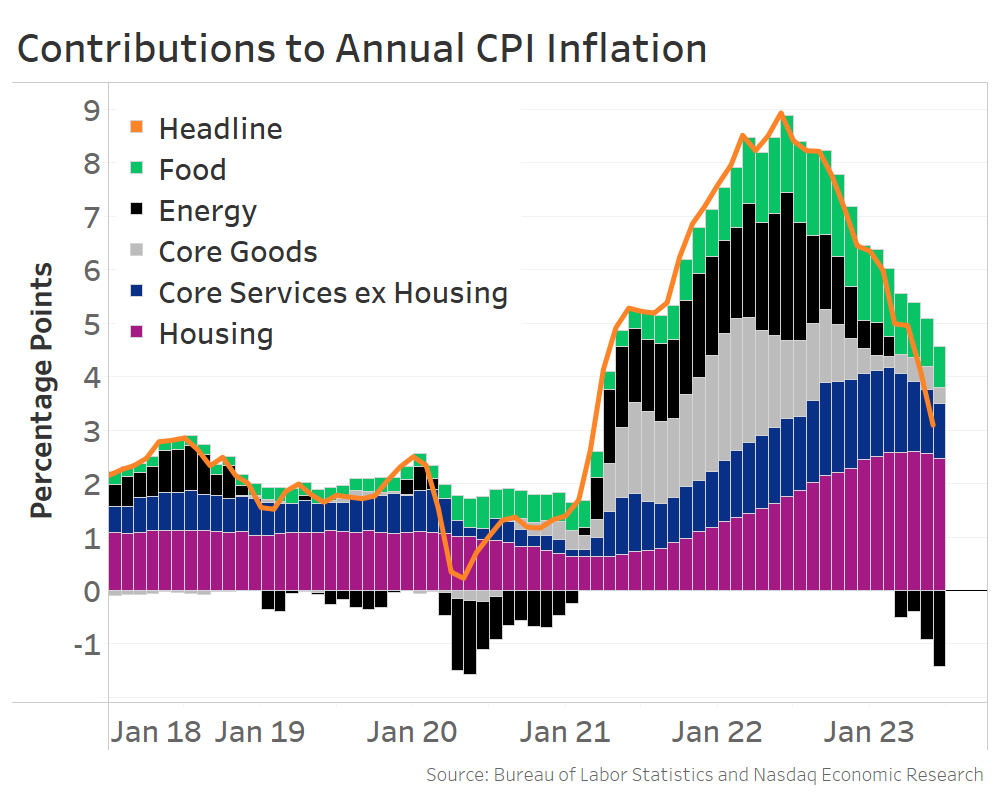
Headline inflation being pulled down by energy
A big reason why we saw headline CPI drop to 3% YoY from 4% in one month is that energy remains a negative contributor (chart below, black bars).
The other volatile CPI component – food (green bars) – is also starting to become a smaller driver, too. June marked its smallest contribution in 20 months, thanks to a combination of slowing wage growth and steady agricultural commodity prices.
Importantly, we’re also starting to see progress on the core components (grey, blue, and purple bars) that we talked about in our June 15 note.
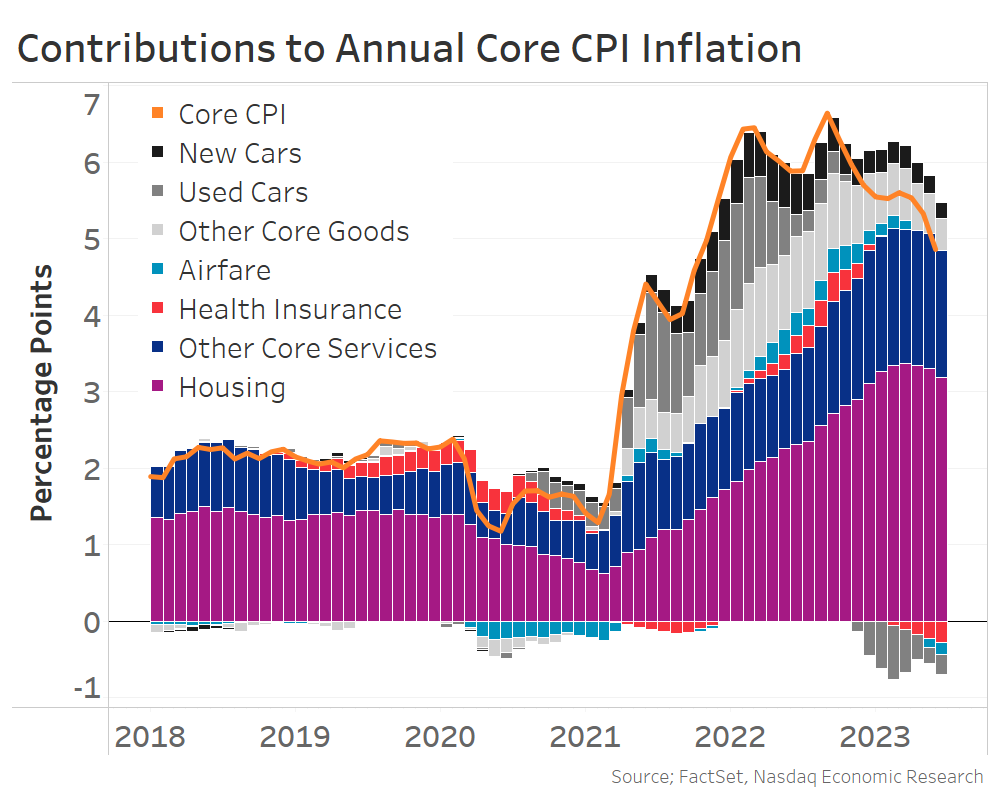
Core inflation pulled down by cars, but starting to see services and housing slow too
Looking at the breakdown of core CPI drivers (chart below), the most important development for the Fed and markets is that the “sticky” core components – housing and wage-driven core services – are now slowing.
The contribution from housing has slowed for three straight months (purple bars). That should continue because recent research shows housing CPI lags market-based measures by one year, and market-based measures of rent slowed to 0% YoY growth in June while home prices saw their first year-over-year decline in 11 years. So there’s more housing disinflation in the pipeline.
The rest of core services (blue bars), which is largely wage-driven, has now slowed for two straight months and saw its smallest contribution in 7 months, as the still-tight labor market continues to ease at the margin.
We also see some negative contributors already:
Despite CPI data, a 25bps rate hike still likely this month, but odds of second hike are falling
This is the kind of inflation report the Fed has been waiting for.
They want core inflation to slow because it tends to show better what is happening to long-term price inflation, so they care about it more than headline. And in particular, they’ve wanted to see progress on the “sticky” wage-driven components.
But the Fed will want to see these trends continue before they end their rate hike cycle. That’s why markets are still pricing 90+% odds of a 25bps rate hike in two weeks. However, odds the Fed can push through a second rate hike by November have dropped to 25% from 35%.
Increased odds that the Fed’s rate hike cycle ends this month is boosting markets
Lower odds of a second rate hike is good news for markets.
The major equity indices jumped on the CPI data (left chart below), gaining around 0.5-1% today, while 10-year Treasury rates fell over 10 basis points to 3.85% this morning (right chart).

That reversed a chunk of the recent run up in rates. Late last month, 10-year rates were as low as 3.7%, and they rose above 4% in the last week, as markets priced in “higher-for-longer” rates.
But after this CPI report, markets are thinking rates might not need to go as high for as long. That means less drag on the economy, which improves soft landing odds, and that’s good news for earnings and markets.
The broad crypto space took a bit of a breather ahead of this month’s CPI report, seeing all 11 coins in the Nasdaq Crypto Index (NCI) land in the red as of yesterday’s action. While no one piece of data (especially in a volatile and highly speculative area like crypto) gives a full picture as to what an investor should expect, the crypto market mirrors the equity space in the fact that a slowdown in inflation is undoubtedly a positive for the industry. Bitcoin ($BTC) has gained an average of nearly 5% in the following month when headline MoM inflation came in at or below expectations over the last year, versus 3.05% when the reading came in hot. While the difference isn’t quite drastic enough to write home about and many other factors warrant consideration when judging the correlation between collected data, it is a net positive to see inflation falling across the board.
Besides that, it was a relatively muted week in comparison to the last few months for the space. Larger coins, headed by Bitcoin and Ethereum, fell the least. This continues a strong theme that has been discussed in detail over the last few months in which these household crypto names have fared better than their smaller counterparts. The broad pullback for the space does bring many coins back towards the middle of their trading band, which could offer another opportunity to enter into positions if desired. Another “secondary” indicator that is painting a compelling picture for many is the recent flip to positive weekly momentum for the space. As seen in the chart below, no coin within the NCI displays higher than four weeks of weekly positive momentum, with many having recently just flipped. Ethereum ($ETH) fits the bill as a large coin, on consecutive buy signals in actionable territory and just flipped back to positive weekly momentum that could be considered today.


Each week the analysts at DWA review and comment on all major asset classes in the global markets. Shown below is the summary or snapshot of the primary technical indicators we follow for multiple areas. Should there be changes mid-week we will certainly bring these to your attention via the report.
| Universe | BP Col & Level (actual) | BP Rev Level | PT Col & Level (actual) | PT Rev Level | HiLo Col & Level (actual) | HiLo Rev Level | 10 Week Col & Level (actual) | 10 Week Rev Level | 30 Week Col & Level (actual) | 30 Week Rev Level |
|---|---|---|---|---|---|---|---|---|---|---|
| ALL |
|
36% |
|
36% |
|
54% |
|
52% |
|
40% |
| NYSE |
|
48% |
|
40% |
|
80% |
|
68% |
|
50% |
| OTC |
|
32% |
|
34% |
|
42% |
|
46% |
|
36% |
| World |
|
38% |
|
34% |
|
|
|
46% |
|
42% |
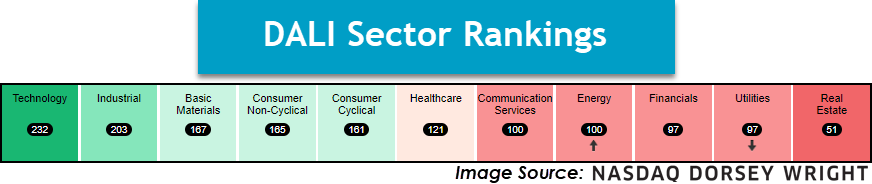
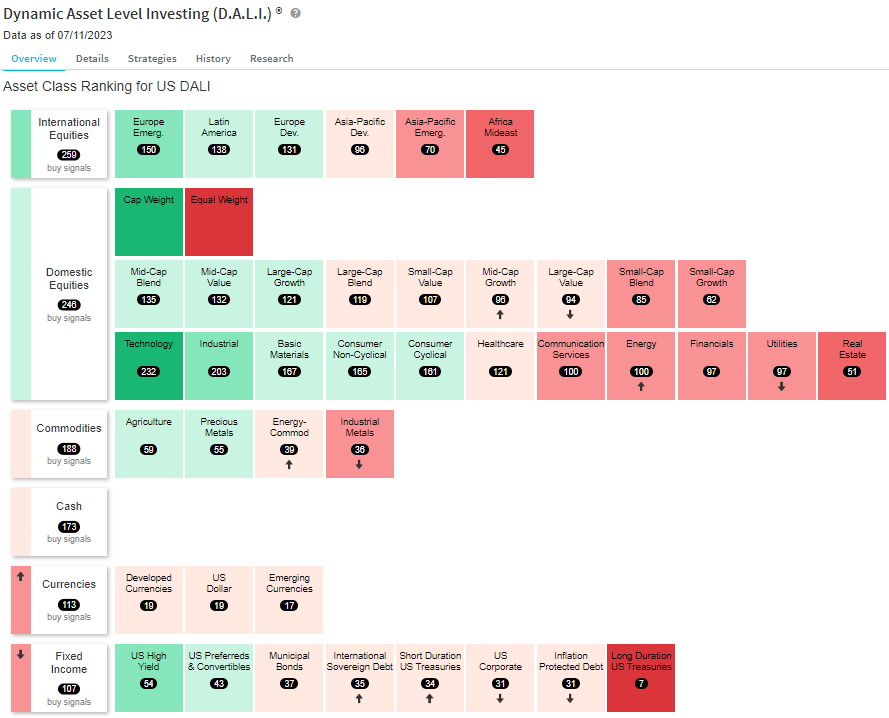
With coverage of Fixed Income’s fall to the 6th position in the DALI Asset Class rankings in the past couple of reports, today’s piece will seek to cover underlying changes that will be worth monitoring. First among them is Domestic Equity’s continued increase in tally signal count, having added 11 additional signals during July and bringing the total to 62 since the beginning of the second quarter. Along with Industrial’s sustained leadership, Technology, Consumer Cyclical, and Communication Services have garnered much attention in terms of improvement so far this year as the top four sectors in terms of signal gain. Since the beginning of the third quarter, only one sector has garnered a notable amount of signals.
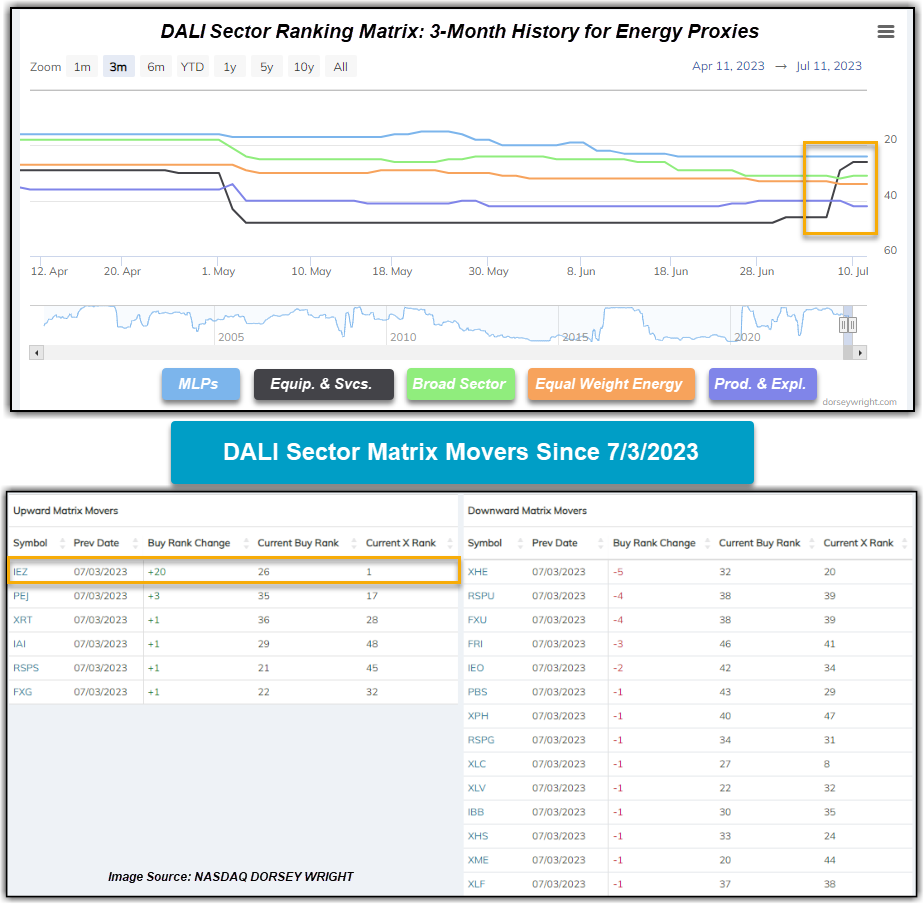
Over the last week, the Energy sector has risen from 10th to 8th in our DALI sector rankings, picking up 15 buy signals in that span. Amidst its rise, one may be interested in hopping aboard energy while it picks up steam. However, most of Energy’s recent movement has come from the Equipment and Services subsector, as opposed to the sector as a whole.

Out of the 15 buy signals energy has picked up, iShares U.S. Oil Equipment & Services ETF (IEZ) has accounted for a whopping 14 of those. This brought the fund from the bottom quintile to the upper half of the DALI sector matrix; meanwhile, the remainder of the proxies average a rank roughly in the bottom third. While most of IEZ’s new buy signals have come from weaker sectors such as Real Estate, Utilities, and Healthcare, it has also picked up a buy signal versus what has been one of the stronger subsectors in the broader market throughout 2023: Home Construction. This is significant, as it shows relative strength against more than current market laggards.
The chart below shows the RS relationship between Oil Equipment and Services versus the iShares U.S. Home Construction ETF ITB. With July’s action, IEZ has simply outpaced ITB, up 11.38% compared to down 63 basis points. Much of IEZ’s performance came after news last week that the U.S. posted higher net crude imports and gas inventories remained unchanged. The difference in performance toward the end of last week brought the RS chart into Xs and higher to complete an RS buy signal. Prior to last week’s change, IEZ had been on an RS sell versus ITB since early February and IEZ underperformed ITB during that time – down 1.20% versus up 11.92%. Bear in mind, this one RS chart is among many that evaluate an overall sector’s strength and much of the gain in strength for Energy has come from one subsector. Additionally, broader Technology and Industrials – along with a number of their subsectors – are still favored over Oil Equipment & Services in the long term. Some of the RS charts have shifted into Xs though with action over the past week and are favoring Oil Equipment & Services in the short-term, so it will be worth continuing to monitor. Further improvement is needed from the subsector for those RS relationships to flip, and upside from elsewhere in the broader Energy sector would help the case for garnering attention in client portfolios.
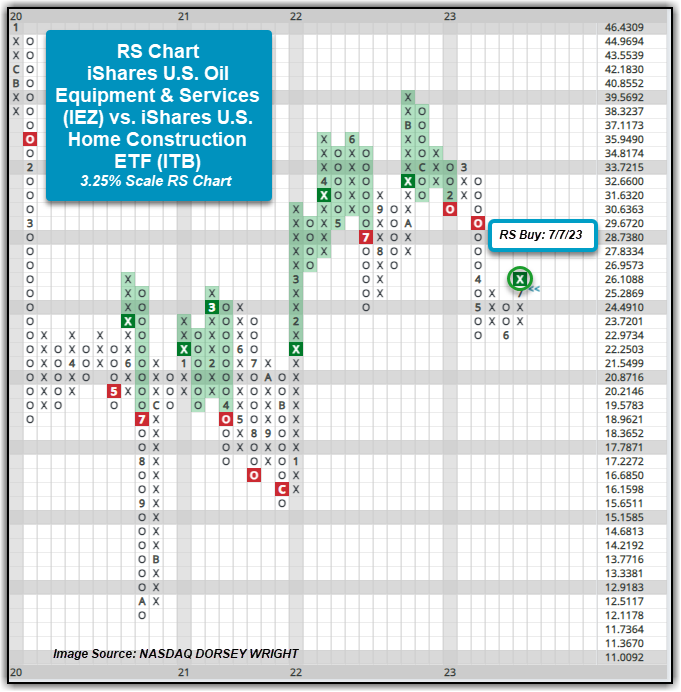
Given IEZ has both strong recent performance and relative strength versus a leading subsector, many clients may be asking whether now is the time to enter. IEZ does have a strong fund score of 4.46, which was boosted by a recent market RS chart reversal into Xs late last week, and has maintained a buy signal and a positive trend since early June. That said, the ETF has skyrocketed up 16.17% in the past week and now sits in heavily overbought territory with a weekly OBOS reading of over 100%. Additionally, it is nearing resistance at $23 without support until $18.50. Those seeking long-term exposure should wait for price consolidation or a pullback to $21 before entering. From here, a move to $23.50 would mark the highest chart level since early 2019.


The past week saw no significant technical developments in the Basic Materials, Healthcare, Communication Services, Utilities or Real Estate Sectors. Those that saw noteworthy movement are included below, in order of their relative strength ranking in the DALI domestic equity sector rankings. Sector designations are based on DALI sector rankings and are as follows: 1 - 3 overweight, 4 - 7 equal-weight, and 8 - 11 underweight.
Technology – Overweight, Improving
The technology sector continued to gain strength in June to maintain the top-ranked position in the DALI sector rankings. That strength has been furthered this week, with breadth improving across the various subsectors. The equally weighted sector representative RSPT completed a bullish triangle pattern on its 2-point chart Wednesday, showing improvement after a few weeks of consolidation. Semiconductors continue to consolidate but show more bullish participation, with SMH reversing back up into Xs this week to form a triple top at $154. A further breakout there could offer a more opportune entry point given the normalization over the past few weeks. Software stocks are also showing strength, with names like U and HUBS each showing consistent improvement.
Industrial- Overweight
The sector continues to improve, earning over 200 buy signals this week. This extends its lead over the rest of the group but leaves it well out of range of leader technology for the time being. With that said, there are many investable areas one may consider when looking for exposure to industrials. Starting broadly, both XLI & RSPN moved higher over the last week to all-time highs, and while heavily overbought could be considered on pullbacks. There are also several technically strong stocks one may look towards, including MOG.A, ODFL, and RSG.
Consumer Non-Cyclicals- Equal Weight
Consumer Staples maintained its DALI position this week, but the sector broadly continues to weaken relative to the rest of the pack. We are seeing an intensifying divergence between staples and discretionary on the Asset Class Group Scores page, while SPDR Sector ETF XLP was the worst performing of the major 11 and just posted its lowest fund score in roughly five years. All that said, a handful of non-discretionary stocks like LW, MNST, and TAP still look strong.
Consumer Cyclical- Equal Weight
XLY was down 32 basis points over the holiday-shortened week, but the group did see improvement within the Asset Class Group Scores pages as it moved above the 4 score threshold this week for the first time since 2021. Home Construction (ITB) continues to carry the leadership baton from an RS standpoint, remaining actionable at current levels along with Lennar Corp. LEN. Domino’s Pizza DPZ announced a partnership with UBER in which DPZ will list its menu on the Uber Eats App. With Wednesday’s rally, DPZ moves above the $400 level and reverses back into Xs on its market RS chart, bringing the stock up to a 2 for 5’er. UBER provides a stronger technical picture with a 5 attribute and is on a pullback from a recent rally high.
Energy- Underweight
Energy moved up to eighth in the DALI sector rankings this week. The Energy Select Sector SPDR Fund (XLE) gave a second consecutive buy signal and returned to a positive trend this week when it completed a bullish catapult at $83. XLE’s fund score has steadily improved over the last month and recently crossed the 3.5 threshold.
Financials – Underweight
International small-cap equities have had notable technical improvement over the past few weeks, as shown through the SPDR S&P International Small Cap ETF GWX. This fund moved higher at the end of June after finding support at the $29 level from December and continued climbing to the $31.50 level on its default chart this week. This forms a triple top at resistance from April and June and tests the longer-term negative trend line that has been in place since May of last year. The fund carries a less-than-acceptable 2.69 fund score but does show a positive score direction. The technical picture would strengthen with a potential breakout at $32, which would also return the fund to a positive trend. Initial support can be seen at the $29 level from June and last December.

The above representative includes broad international equity representation but carries a significant weight toward developed markets. Japan, South Korea, Canada, Australia, and the UK represent about 72% of the fund’s entire allocation, and there are 25 total countries included in the holdings. Therefore, it may be prudent to examine the relationship between emerging and developed markets by focusing on the small-cap space. This can be accomplished through a relative-strength comparison of the iShares MSCI Emerging Markets Small Cap ETF EEMS and the iShares MSCI Developed Markets Small Cap ETF SCZ. We will look at this relationship on a 2.5% scale as this has produced consistent signal movement over the years; buy signals have generally been followed by consecutive buy signals and sell signals have generally been followed by consecutive sell signals. This chart has maintained an RS buy signal since December 2020 and gave a second consecutive buy signal last April before reaching an RS peak in September. Movement over the next few months saw the chart retract into a column of Os as we entered 2023, signifying near-term weakness from small caps in emerging markets when compared to their developed market counterparts. However, the past two weeks of action have seen that shift, as the chart reversed back up into a column of Xs following the market action on Monday, July 3.
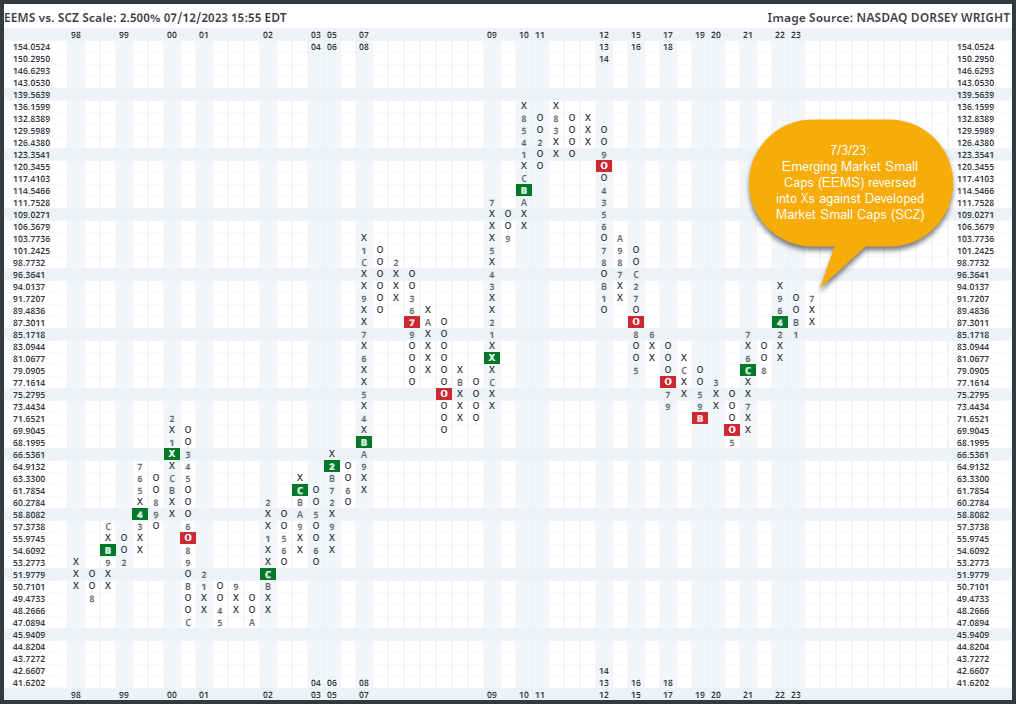
There are multiple representatives in the emerging market space that have shown recent strength, and these generally follow the areas that have exhibited strength through the broader market representatives. The Brazil Small-Cap fund EWZS has gained over 27% so far this year, while the India Small-Cap fund SMIN has risen over 13%. Both areas could provide potential opportunities for investors looking to gain exposure to international equities in the second half of the year. Regardless, the small-cap improvement seen across the broader international equity space adds to the positive weight of the evidence for the asset class moving forward.
Fixed income dropped to the bottom of the DALI asset class rankings for first time in more than 10-years. The move comes as rising yields have weakened the core fixed income market; the Bloomberg Barclays US Aggregate Bond Index (LBUSTRUU) finished June down slightly, while domestic equities, international equities, and commodities each advanced.
Yields reversed course on Wednesday after June CPI came in lower than expected. The US Treasury 10-year Yield Index (TNX) declined 11bps and reversed down, falling to 3.85% on its default chart. Shorter-term yields saw larger declines as the Two-year US Treasury Yield (US2YR) fell 14 bps.
Fed futures are still pricing in roughly a 92% chance of a 25 bps rate increase at the Fed’s July meeting. However, the odds of a second increase at the September meeting declined following the CPI release.
While yields have risen recently, weakening core bonds, high yield spreads have continued to narrow reflecting a risk-on stance toward credit in the market. CBUS 10 Year Spread (CBUS10YRSPREAD), which measures the spread between high yield bonds and US Treasuries reversed down in June and has narrowed further since the end of Q2, printing an O at 4.63%.
While the recent rise in yields and resulting decline of fixed income to the bottom of the DALI asset class rankings is certainly not a good sign for bond holders, it may be a positive indication for the economy (or at least economic sentiment) and US equities. The rise in yields combined with the drop in high yield spreads are the opposite of what we would expect to see if the bond market were predicting a recession.
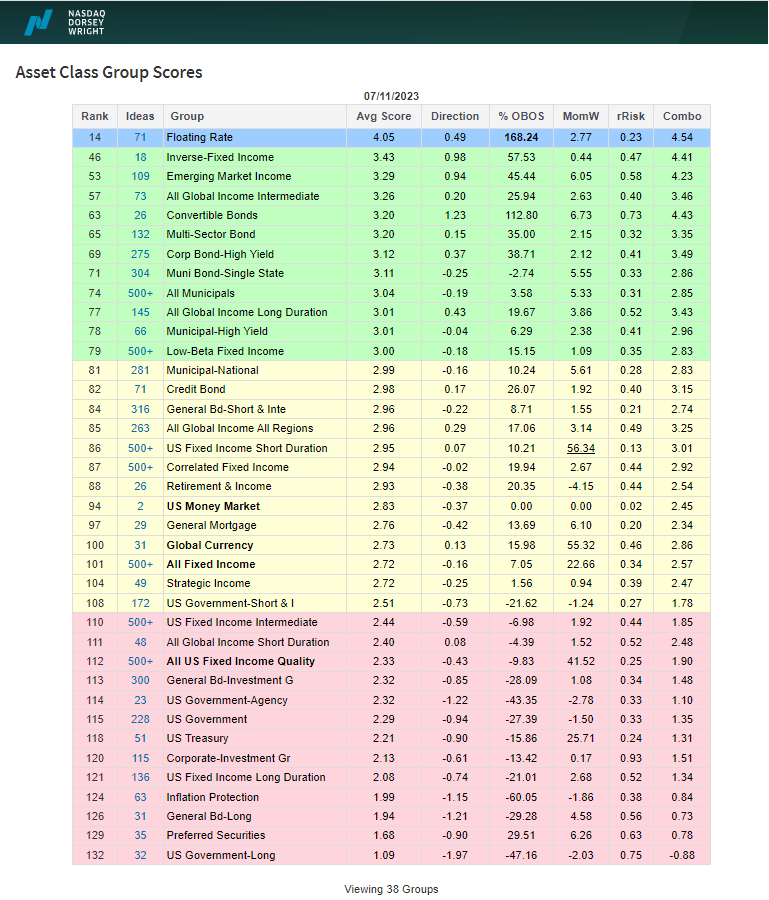
The fixed income rankings in the Asset Class Group Scores (ACGS) clearly reflect the weakening of the core fixed income market as many core groups – US Treasuries, investment grade corporates, US Government, etc. – now sit in the red zone with scores below 2.5. Meanwhile, the inverse fixed income group now ranks second among fixed income groups. However, there are still several groups – primarily outside of the core market – that show average scores above the 3.0 threshold including, floating rates, the only fixed income group with a score above 4.0, convertibles, high yield bonds, and emerging market income.
Remember, these are technical comments only. Just as you must be aware of fundamental data for the stocks we recommend based on technical criteria in the report, so too must you be aware of important data regarding delivery, market moving government releases, and other factors that may influence commodity pricing. We try to limit our technical comments to the most actively traded contracts in advance of delivery, but some contracts trade actively right up to delivery while others taper off well in advance. Be sure you check your dates before trading these contracts. For questions regarding this section or additional coverage of commodities email will.gibson@nasdaq.com.
Data represented in the table below is through 7/11/2023:
Broad Market Commodities Report
| Symbol | Name | Price | PnF Trend | RS Signal | RS Col. | 200 Day MA | Weekly Mom |
|---|---|---|---|---|---|---|---|
| CL/ | Crude Oil Continuous | 74.83 | Negative | Buy | O | 77.39 | +5W |
| DBLCIX | Deutsche Bank Liquid Commodities Index | 481.48 | Negative | Sell | O | 503.86 | +5W |
| DWACOMMOD | DWA Continuous Commodity Index | 801.54 | Positive | Buy | O | 788.67 | +6W |
| GC/ | Gold Continuous | 1931.30 | Negative | Sell | X | 1860.01 | -12W |
| HG/ | Copper Continuous | 3.75 | Negative | Sell | X | 3.84 | +5W |
| ZG/ | Corn (Electronic Day Session) Continuous | 494.50 | Negative | Sell | O | 645.55 | -2W |
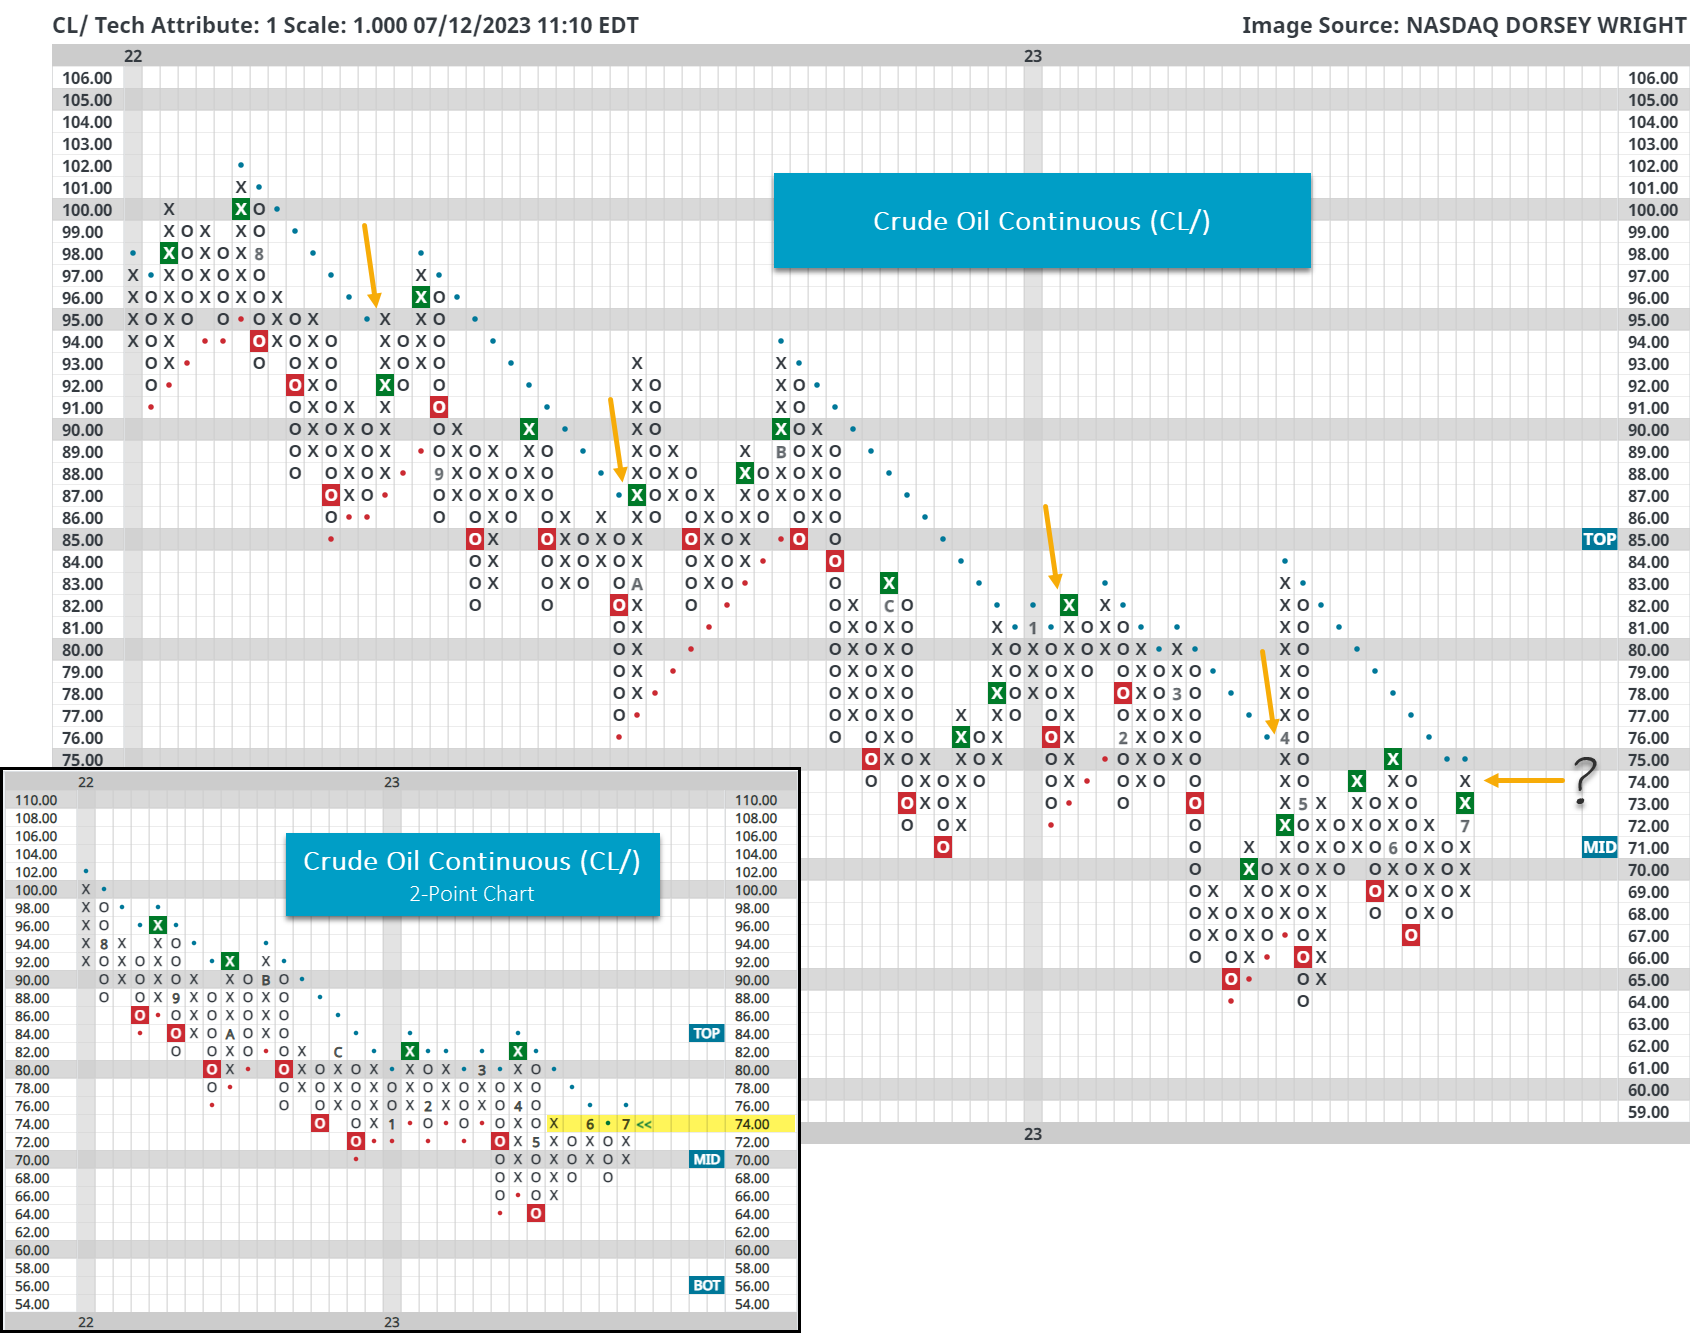
As already discussed in today’s Major Index and DALI Overview, energy is showing signs of life - this is also true in the commodities space. For instance, over the past seven days crude oil (CL/) gained over 7% and returned to a Point & Figure buy signal in the process.
While positive, this rally brings crude oil to its bearish resistance line on its default chart and a key area of resistance on its longer-term 2-point chart (pictured in the bottom left below). Notice that over the past year breaks of the bearish resistance line on the default chart led to short-lived rallies (at best) before a continued downtrend. On the 2-point chart, we saw a couple of head fakes as well earlier this year.
With market action on Wednesday (7/12), crude oil will print an additional X at $75 and officially reenter a positive trend – a break at $76 is needed on the 2-point scale. However, in light of the previous negative trend breaks over the past year (as first highlighted today), more technical evidence is needed, from our perspective, to consider this the beginning of a new long-term uptrend. Although, with the next level of resistance distant, situated at around $83, perhaps there is a near-term trading opportunity. Longer-term confirmation could come with a clearance of the $83 resistance level.
Average Level
21.11
| < - -100 | -100 - -80 | -80 - -60 | -60 - -40 | -40 - -20 | -20 - 0 | 0 - 20 | 20 - 40 | 40 - 60 | 60 - 80 | 80 - 100 | 100 - > |
|---|---|---|---|---|---|---|---|---|---|---|---|
|
Buy signalfxe
|
|||||||||||
|
Buy signalgsg
|
|||||||||||
|
Buy signalijr
|
|||||||||||
|
Sell signalicf
|
Buy signalRSP
|
||||||||||
|
Buy signaliwm
|
Buy signalVOOV
|
||||||||||
|
Sell signaldx/y
|
Buy signalhyg
|
Sell signaldvy
|
Buy signalXLG
|
Buy signalqqq
|
|||||||
|
Sell signalief
|
Sell signalagg
|
Sell signalGLD
|
Buy signaleem
|
Buy signaldia
|
Buy signalvoog
|
Sell signalijh
|
|||||
|
Buy signalshy
|
Sell signalTLT
|
Sell signallqd
|
Buy signalefa
|
Sell signalgcc
|
Buy signaluso
|
Buy signalspy
|
Buy signaloneq
|
||||
| < - -100 | -100 - -80 | -80 - -60 | -60 - -40 | -40 - -20 | -20 - 0 | 0 - 20 | 20 - 40 | 40 - 60 | 60 - 80 | 80 - 100 | 100 - > |
| AGG | iShares US Core Bond ETF |
| USO | United States Oil Fund |
| DIA | SPDR Dow Jones Industrial Average ETF |
| DVY | iShares Dow Jones Select Dividend Index ETF |
| DX/Y | NYCE U.S.Dollar Index Spot |
| EFA | iShares MSCI EAFE ETF |
| FXE | Invesco CurrencyShares Euro Trust |
| GLD | SPDR Gold Trust |
| GSG | iShares S&P GSCI Commodity-Indexed Trust |
| HYG | iShares iBoxx $ High Yield Corporate Bond ETF |
| ICF | iShares Cohen & Steers Realty ETF |
| IEF | iShares Barclays 7-10 Yr. Tres. Bond ETF |
| LQD | iShares iBoxx $ Investment Grade Corp. Bond ETF |
| IJH | iShares S&P 400 MidCap Index Fund |
| ONEQ | Fidelity Nasdaq Composite Index Track |
| QQQ | Invesco QQQ Trust |
| RSP | Invesco S&P 500 Equal Weight ETF |
| IWM | iShares Russell 2000 Index ETF |
| SHY | iShares Barclays 1-3 Year Tres. Bond ETF |
| IJR | iShares S&P 600 SmallCap Index Fund |
| SPY | SPDR S&P 500 Index ETF Trust |
| TLT | iShares Barclays 20+ Year Treasury Bond ETF |
| GCC | WisdomTree Continuous Commodity Index Fund |
| VOOG | Vanguard S&P 500 Growth ETF |
| VOOV | Vanguard S&P 500 Value ETF |
| EEM | iShares MSCI Emerging Markets ETF |
| XLG | Invesco S&P 500 Top 50 ETF |
| Symbol | Company | Sector | Current Price | Action Price | Target | Stop | Notes |
|---|---|---|---|---|---|---|---|
| GPK | Graphic Packaging Intl. | Forest Prods/Paper | $24.28 | 21 - 23 | 26 | 18 | 5 for 5'er, #2 of 15 in favored FORE sector matrix, LT pos mkt RS, triple top, 1.3% yield |
| V | Visa Inc. | Finance | $240.55 | 210s - 220s | 262 | 188 | 5 for 5'er top third of FIN sector matrix, LT pos mkt RS, spread quintuple top, Earn. 7/25 |
| MRK | Merck & Co., Inc. | Drugs | $108.70 | mid 100s - low 110s | 137 | 89 | 4 for 5'er top third of DRUG sector matrix, multiple consec buys, pullback from ATH, 2.7% yield, Earn. 8/1 |
| BJRI | BJ's Restaurants Inc. | Restaurants | $31.93 | low 30s | 55 | 26 | 3 for 5'er, top third of favored REST sector matrix, triple top, pullback from 52-week high, R-R>3.5, Earn. 7/19 |
| TXRH | Texas Roadhouse, Inc. | Restaurants | $113.94 | 100s | 125 | 90 | 5 TA rating, top half REST sector matrix, consec. buy signals, LT RS buy, 2.10% yield, Earn. 7/27 |
| UBS | UBS AG (Switzerland) ADR | Banks | $20.31 | 18 - 22 | 38.50 | 16 | 5 for 5'er, #5 of 126 in BANK sector matrix, bullish triangle, R-R>4.0, 2.75% yield |
| BRK.B | Berkshire Hathaway Inc | Insurance | $343.37 | mid 300s - low 330s | 396 | 280 | 5 TA rating, top third of INSU sector matrix, LT pos. trend, LT RS buy, buy-on-pullback |
| CLX | The Clorox Company | Household Goods | $154.85 | 160s | 194 | 136 | 5 for 5'er, 7th of 26 in HOUS sector matrix, RS buy signal, triple top, 2.8% yield, Earn. 8/2 |
| DRI | Darden Restaurants, Inc. | Restaurants | $166.56 | mid 150s - mid 160s | 192 | 130 | 5 TA rating, pos. trend, LT RS buy, pos. weekly mom., recent price normalization |
| CMCSA | Comcast Corporation | Media | $42.01 | hi 30s - low 40s | 50 | 33 | 4 for 5'er, top third of MEDI sector matrix, multiple consec buy signal, pullback to middle of trading band, 2.94% yield, Earn. 7/27 |
| GE | General Electric Company | Electronics | $111.22 | hi 90s - hi 100s | -- | 86 | 5 for 5'er, #4 of 67 in ELEC sector matrix, LT pos mkt RS, triple top breakout, Earn. 7/25 |
| CRM | Salesforce Inc. | Software | $221.17 | hi 190s - 220 | 258 | 168 | 4 TA rating, top 20% of SOFT sector matrix, consec. buy signals, buy-on-pullback |
| AXP | American Express Company | Finance | $174.64 | mid 160s - mid 170s | 222 | 146 | 4 for 5'er, 14th of 72 in FINA sector matrix, pos trend flip, spread triple top, pos wkly mom flip, R-R>2.0, Earn. 7/21 |
| IPG | The Interpublic Group of Companies, Inc. | Media | $38.85 | hi 30s - low 40s | 66 | 32 | 5 for 5'er, #1 of 30 in MEDI sector matrix, spread quad top, R-R>3.0, 3.1% yield, Earn. 7/21 |
| VVV | Valvoline Inc | Autos and Parts | $37.46 | mid - hi 30s | 53 | 30 | 5 TA rating, top third in the AUTO sector RS matrix, consec. buy signals, buy-on-pullback, R-R > 2, Earn. 8/1 |
| HCA | HCA Healthcare Inc. | Healthcare | $294.69 | mid 270s - lo 300s | 392 | 236 | 5 TA rating, top 20% of HEAL sector, consec. buy signals, LT market RS buy, buy-on-pullback, Earn. 7/27 |
| PEP | PepsiCo, Inc. | Food Beverages/Soap | $183.98 | 180 - lo 190s | 250 | 152 | 4 TA rating, top third of FOOD sector matrix, LT RS buy, normalized entry point, 2.72% yield, Earn. 7/13 |
| ANSS | Ansys Inc | Software | $333.72 | 320s - 340s | 404 | 280 | 5 for 5'er, top third of SOFT sector matrix, LT pos mkt RS, multiple consec buy signals, Earn. 8/1 |
| SEM | Select Medical Holdings Corporation | Healthcare | $30.44 | hi 20s - lo 30s | 52.50 | 23 | 5 TA rating, top third of HEAL sector matrix, LT RS buy, normalized prices, recent pos. wkly mom., R-R > 3, Earn. 8/3 |
| AL | Air Lease Corp. | Aerospace Airline | $42.58 | hi 30s - low 40s | 64 | 35 | 4 for 5'er, favored AERO sector matrix, bullish triangle, R-R>4.0, 1.95% yield, Earn. 8/3 |
| MMC | Marsh & McLennan Companies, Inc. | Insurance | $186.90 | mid 170s - low 190s | 244 | 150 | 5 TA rating, top third of INSU sector matrix, LT RS buy, consec. buy signals, pos wkly mom, Earn. 7/20 |
| BRO | Brown & Brown, Inc. | Insurance | $69.44 | mid-to-upper 60s | 93 | 55 | 5 for 5'er, favored INSU sector matrix, LT pos mkt RS, R-R>2.0, Earn. 7/24 |
| SFM | Sprouts Farmers Market, LLC | Food Beverages/Soap | $38.26 | mid-hi 30s | $49 | $29 | 5 TA rating, top quintile of favored FOOD matrix, LT pos trend, pos. monthly mom., Earn. 8/1 |
| MDLZ | Mondelez International, Inc. Class A | Food Beverages/Soap | $70.89 | hi 60s - mid 70s | 95 | 59 | 4 for 5'er. top 25% of favored FOOD sector matrix, multiple buy signals, pullback from ATH, 2.1% yield, Earn. 7/24 |
| CXM | Sprinklr, Inc. Class A | Software | $14.30 | 13 - 14 | 24.50 | 11 | 5 for 5'er. 22 of 138 in favored SOFT sector matrix, spread quintuple top, pullback to old resistance, R-R>3.5 |
| AJG | Arthur J. Gallagher & Co. | Insurance | $216.35 | hi 200s - hi 210s | 298 | 180 | 5 for 5'er, 10 of 71 in favored INSU sector matrix, LT pos mkt RS, R-R>2.0, Earn. 7/27 |
| CRSR | Corsair Gaming, Inc. | Leisure | $17.53 | 17 - 18.50 | 26 | 14.50 | 5 for 5'er, top third of favored LEIS sector matrix, spread quad top, R-R~3.0, Earn. 8/2 |
| RSG | Republic Services, Inc. | Waste Management | $149.85 | lo 140s - mid 150s | 190 | 120 | 5 TA rating, top third of WAST sector matrix, consec. buy signals, pos. wkly mom., Earn. 7/31 |
| ALKS | Alkermes Incorporated | Biomedics/Genetics | $30.24 | hi 20s - low 30s | 48 | 24 | 5 for 5'er, top half of favored BIOM sector matrix, spread triple top, pull back from 52-week high, R-R>3.0 |
| Symbol | Company | Sector | Current Price | Action Price | Target | Stop | Notes |
|---|---|---|---|---|---|---|---|
| LAUR | Laureate Education Inc | Business Products | $12.30 | (11.50-12.50) | 6 | 13.50 | 0 for 5'er, LT negative trend & market RS, spread triple bottom, R-R>3.0, Earn. 8/2 |
| Symbol | Company | Sector | Current Price | Action Price | Target | Stop | Notes |
|---|---|---|---|---|---|---|---|
| FI | Fiserv, Inc. | Computers | $126.99 | mid 100s - mid 110s | 123 | 91 | FI has moved into heavily overbought territory. OK to hold here. Raise stop to $102 Earn. 7/24 |
| AER | AerCap Holdings NV | Aerospace Airline | $64.40 | hi 50s - low 60s | 72 | 49 | AER has moved into heavily overbought territory. OK hold here. Raise stop to $53Earn. 7/31 |
| CBRE | CBRE Group, Inc. | Real Estate | $83.80 | 72 - low 80s | 91 | 66 | CBRE has moved into heavily overbought territory. OK to hold here. Raise stop to $71. B>Earn. 7/27 |
| FTNT | Fortinet Inc. | Software | $78.32 | hi 60s - low 70s | 92 | 60 | FTNT has moved into heavily overbought territory. OK to hold here. Raise stop to $66 Earn. 8/3 |
| FND | Floor & Decor Holdings Inc | Retailing | $109.00 | hi 90s - mid 100s | 115 | 87 | FND has moved into heavily overbought territory. OK to hold here. Raise stop to $94 Earn. 8/2 |
| Comment | |||||||
|---|---|---|---|---|---|---|---|
|
|
|||||||
ALKS Alkermes Incorporated R ($29.93) - Biomedics/Genetics - ALKS is a 5 for 5'er that ranks in the top half of the favored biomedics/genetics sector matrix. Late lost month, ALKS broke a spread triple top at $33, taking out resistance that had been in place since April 2022. The stock has subsequently pulled back to the middle of its trading band, offering an entry point for long exposure. Positions may be added in the high $20s to low $30s and we will set our initial stop at $$24, the potential trend line violation on ALKS default chart. We will use the bullish price objective, $48, as our target price, giving us a reward-to-risk ratio north of 3.0.
| 20 | 21 | 22 | 23 | ||||||||||||||||||||||||||||||||||||||||||||||||||
| 36.00 | O | • | 36.00 | ||||||||||||||||||||||||||||||||||||||||||||||||||
| 35.00 | O | • | Top | 35.00 | |||||||||||||||||||||||||||||||||||||||||||||||||
| 34.00 | O | • | 34.00 | ||||||||||||||||||||||||||||||||||||||||||||||||||
| 33.00 | O | • | A | • | X | 33.00 | |||||||||||||||||||||||||||||||||||||||||||||||
| 32.00 | O | • | 9 | O | X | X | • | 6 | O | 32.00 | |||||||||||||||||||||||||||||||||||||||||||
| 31.00 | O | • | X | O | B | X | O | 7 | O | • | 5 | O | 31.00 | ||||||||||||||||||||||||||||||||||||||||
| 30.00 | O | • | X | O | X | O | X | O | X | X | O | • | X | 7 | Mid | 30.00 | |||||||||||||||||||||||||||||||||||||
| 29.00 | 5 | • | X | O | X | O | 4 | O | X | O | X | O | X | 4 | 29.00 | ||||||||||||||||||||||||||||||||||||||
| 28.00 | O | • | X | O | O | X | 5 | X | O | X | O | X | O | X | 28.00 | ||||||||||||||||||||||||||||||||||||||
| 27.00 | O | • | 8 | O | X | O | 6 | • | O | 1 | O | X | 27.00 | ||||||||||||||||||||||||||||||||||||||||
| 26.00 | O | • | 7 | O | X | X | X | • | O | C | 3 | Bot | 26.00 | ||||||||||||||||||||||||||||||||||||||||
| 25.00 | O | • | X | O | 1 | O | X | O | X | • | 8 | B | • | 25.00 | |||||||||||||||||||||||||||||||||||||||
| 24.00 | O | • | X | O | X | O | X | O | X | • | O | X | • | 24.00 | |||||||||||||||||||||||||||||||||||||||
| 23.00 | O | X | X | • | X | 6 | O | X | 2 | • | 3 | • | 9 | X | • | 23.00 | |||||||||||||||||||||||||||||||||||||
| 22.00 | O | X | O | 9 | O | • | X | X | O | X | O | • | • | O | • | 22.00 | |||||||||||||||||||||||||||||||||||||
| 21.00 | 7 | X | O | X | O | B | X | • | • | X | O | X | O | X | • | • | 21.00 | ||||||||||||||||||||||||||||||||||||
| 20.00 | O | 8 | X | O | X | O | X | X | O | • | 7 | X | • | X | O | X | 2 | X | X | • | 20.00 | ||||||||||||||||||||||||||||||||
| 19.50 | O | O | X | O | X | O | X | O | • | X | O | X | O | • | • | X | 1 | O | X | O | X | • | 19.50 | ||||||||||||||||||||||||||||||
| 19.00 | O | X | 1 | X | O | X | 3 | X | O | X | O | X | • | X | • | C | O | X | O | X | • | 19.00 | |||||||||||||||||||||||||||||||
| 18.50 | A | X | O | X | O | X | O | X | O | O | X | O | X | O | X | 3 | 4 | • | 18.50 | ||||||||||||||||||||||||||||||||||
| 18.00 | O | X | O | X | O | X | O | X | O | X | O | X | O | X | • | 18.00 | |||||||||||||||||||||||||||||||||||||
| 17.50 | O | O | X | O | X | O | 6 | X | 8 | 9 | O | X | O | X | • | 17.50 | |||||||||||||||||||||||||||||||||||||
| 17.00 | 2 | O | O | X | X | O | X | O | X | O | X | O | B | • | 17.00 | ||||||||||||||||||||||||||||||||||||||
| 16.50 | O | X | O | X | O | X | O | X | O | X | O | X | • | 16.50 | |||||||||||||||||||||||||||||||||||||||
| 16.00 | O | X | X | O | X | O | O | • | A | • | O | X | • | 16.00 | |||||||||||||||||||||||||||||||||||||||
| 15.50 | O | X | O | X | O | X | • | • | • | O | • | 15.50 | |||||||||||||||||||||||||||||||||||||||||
| 15.00 | O | X | O | X | 4 | O | X | • | • | 15.00 | |||||||||||||||||||||||||||||||||||||||||||
| 14.50 | O | O | X | O | X | O | X | • | 14.50 | ||||||||||||||||||||||||||||||||||||||||||||
| 14.00 | O | X | O | X | O | X | • | 14.00 | |||||||||||||||||||||||||||||||||||||||||||||
| 13.50 | O | X | O | X | 5 | • | 13.50 | ||||||||||||||||||||||||||||||||||||||||||||||
| 13.00 | O | X | O | • | • | 13.00 | |||||||||||||||||||||||||||||||||||||||||||||||
| 12.50 | O | X | • | 12.50 | |||||||||||||||||||||||||||||||||||||||||||||||||
| 12.00 | O | • | 12.00 | ||||||||||||||||||||||||||||||||||||||||||||||||||
| 20 | 21 | 22 | 23 |
| AFL AFLAC Incorporated ($70.45) - Insurance - AFL shares moved higher today to break a triple top at $71 to mark its second consecutive buy signal. This 5 for 5'er has been in a positive trend since August and on an RS buy signal versus the market since October. AFL shares are trading above the middle of their trading band with a weekly overbought/oversold reading of 40%. From here, support is offered at $67. |
| AVGO Broadcom Ltd ($889.95) - Semiconductors - AVGO completed a bullish triangle Wednesday at $896, marking a second consecutive buy signal. This stock moved to a positive trend in November and has maintained an RS buy signal against the market since late-2010. It also sits in the top decile of the favored semiconductors sector RS matrix. The weight of the technical evidence is favorable and continues to improve. Initial support may be seen at $832, with further support offered at $784. Further overhead resistance may be found at the all-time high of $912 from May. |
| AZO Autozone, Inc. ($2,576.01) - Autos and Parts - AZO broke a double top at $2560 for a second buy signal since testing support at $2304 in June. The stock is a 5 for 5'er, but currently ranks in the bottom half of the Autos and Parts sector matrix because of notable rallies elsewhere within the industry. Those seeking exposure to AZO can consider the stock here on the breakout. Resistance lies at $2720, the April rally high. Initial support lies at $2368, the bullish support line, as well as at $2304, a support level that dates to January. |
| DKS Dick's Sporting Goods, Inc. ($139.27) - Retailing - DKS broke a double top at $140 to return to a buy signal. The stock is a 5 for 5'er that ranks in the top half of the Retailing sector matrix and is accompanied by a yield north of 2%. Okay to consider here on the breakout, but note resistance lies in the $150 to $152 range, the March rally and all-time high. Initial support lies at $130, while the bullish support line lies at $126. |
| GS Goldman Sachs Group, Inc. ($326.93) - Wall Street - GS shares moved higher today to break a double top at $332 to mark its first buy signal. This 3 for 5'er has been in a negative trend since June and on an RS sell signal versus the market since June 2016. GS shares are trading near the middle of their trading band with a weekly overbought/oversold reading of -15%. From here, support is offered at $316. |
| LAMR Lamar Advertising Company ($101.49) - Media - LAMR posted a 2nd consecutive double-top buy signal with today's action at $102, moving it back into a positive trend. This will push the stock to a technically favorable 4/5'er from a TA perspective, suggesting LAMR may be gearing up to take on resistance toward the top of the trading band at $106. Support is found below at $97. |
| LEN Lennar Corporation ($128.16) - Building - LEN reversed into X and broke a double top at $128 for an eighth consecutive buy signal and a new all-time high. LEN is a 4 for 5'er that ranks in the top third of the Building sector matrix and is accompanied by a yield north of 1%. Those seeking exposure may look to dollar cost average into the position at this time or consider a full position on a pullback to $122. Support lies at $120 and $106. |
| LVMUY LVMH Moet Hennessy Louis Vuitton SA (France) ADR ($193.40) - Textiles/Apparel - LVMUY broke a double top at $190 to return to a buy signal as it rallied to $192. LVMUY is a 5 or 5'er that has maintained a positive trend and long-term RS versus the market since November last year. Okay to consider the stock on the breakout here. Note resistance leis at $198, the April rally high. Initial support lies at $178 and $172, while the bullish support line lies at $164. |
| MGM MGM Resorts International ($47.02) - Gaming - MGM broke a spread triple top at $47 to return to a buy signal. This follows the stock testing its bullish support line at $39 back in June and brings it to a 52-week high. The stock is a 4 for 5'er that maintains positive near and long-term RS versus the market. Okay to consider here on the breakout. Note the November 2021 rally high for the stock lies at $51 and a move to $52 would bring the stock to its highest level since 2008. Support lies at the bullish support line at $39. |
| OLED Universal Display Corporation ($145.72) - Computers - OLED rose Wednesday to break a double top at $146. This 4 for 5'er moved to a positive trend in November and sits in the top half of the favored computers sector RS matrix. The technical picture is strong and is improving once again. Initial support can be seen at $138 and $136. Overhead resistance may come initially at the $156 level last seen in May. Note that earnings are expected on 8/3. |
| REG Regency Centers Corporation ($63.11) - Real Estate - REG shares reentered a positive trend on Wednesday at $63, raising the technical attribute rating to a 3 for 5'er (hold). Firm resistance is situated around $68, the highs for this year, but the technical picture is improving. Support is offered at $58. |
| STT State Street Corporation ($75.90) - Banks - STT shares moved higher today to break a triple top at $76 to mark its first buy signal. This 2 for 5'er has been in a negative trend since March and on an RS sell signal versus the market since June 2011. STT shares are trading above the middle of their trading band with a weekly overbought/oversold reading of 48%. From here, support is offered at $70. |
| Name | Option Symbol | Action | Stop Loss |
|---|---|---|---|
| Molson Coors Company - $65.72 | TAP2320J65 | Buy the October 65.00 calls at 4.10 | 59.00 |
| Name | Option | Action |
|---|---|---|
| CBRE Group, Inc. ( CBRE) | Sep. 80.00 Calls | Raise the option stop loss to 6.20 (CP: 8.20) |
| Fiserv, Inc. ( FI) | Sep. 110.00 Calls | Raise the option stop loss to 16.80 (CP: 18.80) |
| Visa Inc. ( V) | Sep. 225.00 Calls | Raise the option stop loss to 18.95 (CP: 20.95) |
| Name | Option Symbol | Action | Stop Loss |
|---|---|---|---|
| Southwest Airlines Co. - $38.74 | LUV2315X37.5 | Buy the December 37.50 puts at 2.31 | 42.00 |
| Name | Option | Action |
|---|---|---|
| Pan American Silver Corp (PAAS) | Jul. 18.00 Puts | Stopped at 2.10 (CP: 2.05) |
| Regions Financial Corporation (RF) | Aug. 18.00 Puts | Stopped at 19.00 (CP: 18.85) |
| Alibaba Group Holding Ltd (China) ADR (BABA) | Oct. 90.00 Puts | Stopped at 93.00 (CP: 94.28) |
| Johnson & Johnson (JNJ) | Oct. 165.00 Puts | Raise the option stop loss to 6.35 (CP: 8.35) |
| Name | Option Sym. | Call to Sell | Call Price | Investment for 500 Shares | Annual Called Rtn. | Annual Static Rtn. | Downside Protection |
|---|---|---|---|---|---|---|---|
| Steel Dynamics Inc. $106.80 | STLD2317K110 | Nov. 110.00 | 8.00 | $50,170.95 | 24.40% | 19.46% | 6.39% |
| Name | Action |
|---|---|
| CrowdStrike Holdings, Inc. Class A (CRWD) - 150.79 | Sell the October 155.00 Calls. |
| Tapestry Inc. (TPR) - 44.39 | Sell the November 45.00 Calls. |
| Roku, Inc. Class A (ROKU) - 75.43 | Sell the October 65.00 Calls. |
| International Game Technology (IGT) - 31.77 | Sell the October 33.00 Calls. |
| Palantir Technologies Inc. Class A (PLTR) - 16.49 | Sell the November 18.00 Calls. |
| Carnival Corporation (CCL) - 18.90 | Sell the October 21.00 Calls. |
| Bath & Body Works Inc. (BBWI) - 37.21 | Sell the September 37.50 Calls. |
| Schlumberger Limited (SLB) - 56.05 | Sell the November 60.00 Calls. |
| Name | Covered Write |
|---|---|
| Dexcom Inc. ( DXCM - 131.23 ) | December 130.00 covered write. |
| EQT Corporation ( EQT - 40.56 ) | September 41.00 covered write. |
Daily Equity & Market Analysis
Loading, Please Wait...
