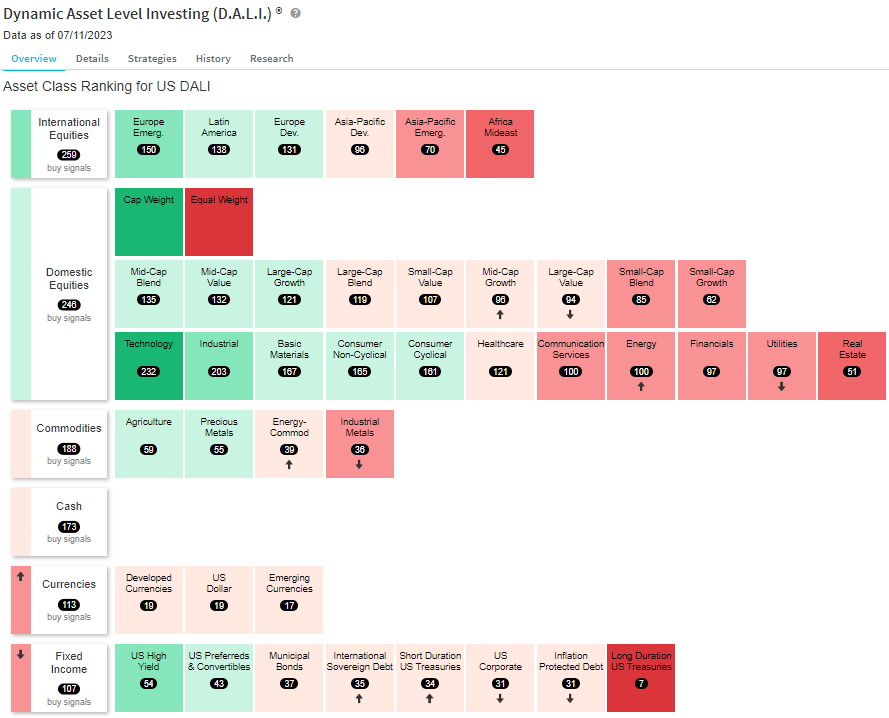
Fixed income has fallen to the bottom of the DALI rankings. However, there remain a number fixed income groups showing relative strength, mostly outside of the core market.
Fixed income dropped to the bottom of the DALI asset class rankings for first time in more than 10-years. The move comes as rising yields have weakened the core fixed income market; the Bloomberg Barclays US Aggregate Bond Index (LBUSTRUU) finished June down slightly, while domestic equities, international equities, and commodities each advanced.
Yields reversed course on Wednesday after June CPI came in lower than expected. The US Treasury 10-year Yield Index (TNX) declined 11bps and reversed down, falling to 3.85% on its default chart. Shorter-term yields saw larger declines as the Two-year US Treasury Yield (US2YR) fell 14 bps.
Fed futures are still pricing in roughly a 92% chance of a 25 bps rate increase at the Fed’s July meeting. However, the odds of a second increase at the September meeting declined following the CPI release.
While yields have risen recently, weakening core bonds, high yield spreads have continued to narrow reflecting a risk-on stance toward credit in the market. CBUS 10 Year Spread (CBUS10YRSPREAD), which measures the spread between high yield bonds and US Treasuries reversed down in June and has narrowed further since the end of Q2, printing an O at 4.63%.
While the recent rise in yields and resulting decline of fixed income to the bottom of the DALI asset class rankings is certainly not a good sign for bond holders, it may be a positive indication for the economy (or at least economic sentiment) and US equities. The rise in yields combined with the drop in high yield spreads are the opposite of what we would expect to see if the bond market were predicting a recession.
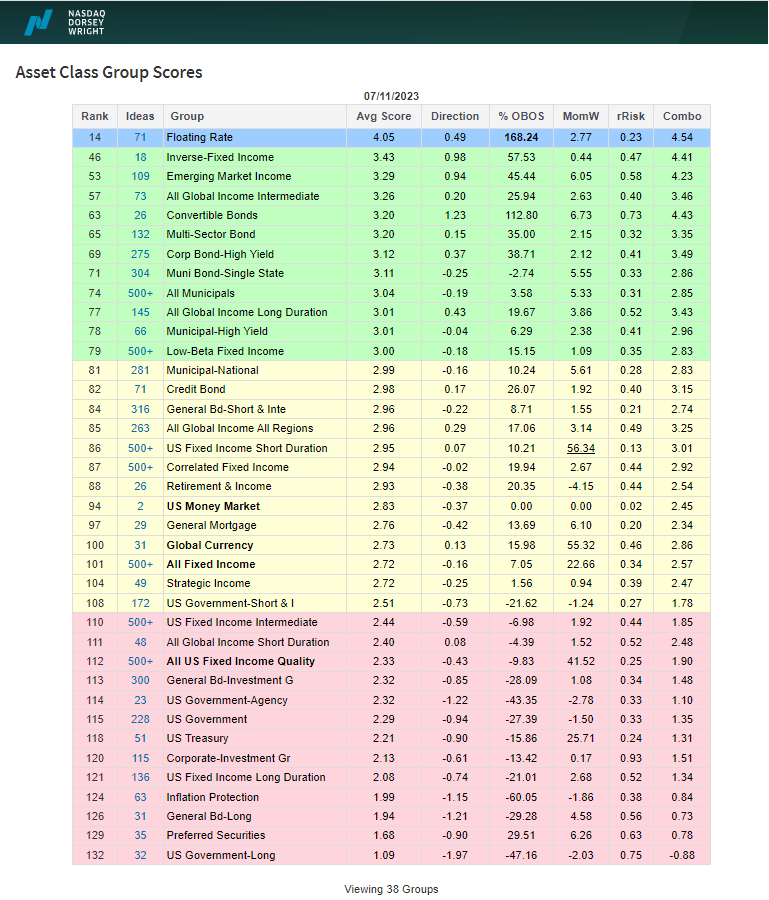
The fixed income rankings in the Asset Class Group Scores (ACGS) clearly reflect the weakening of the core fixed income market as many core groups – US Treasuries, investment grade corporates, US Government, etc. – now sit in the red zone with scores below 2.5. Meanwhile, the inverse fixed income group now ranks second among fixed income groups. However, there are still several groups – primarily outside of the core market – that show average scores above the 3.0 threshold including, floating rates, the only fixed income group with a score above 4.0, convertibles, high yield bonds, and emerging market income.