
With coverage of Fixed Income’s fall to the 6th position in the DALI Asset Class rankings in the past couple of reports, today’s piece will seek to cover underlying changes that will be worth monitoring.
With coverage of Fixed Income’s fall to the 6th position in the DALI Asset Class rankings in the past couple of reports, today’s piece will seek to cover underlying changes that will be worth monitoring. First among them is Domestic Equity’s continued increase in tally signal count, having added 11 additional signals during July and bringing the total to 62 since the beginning of the second quarter. Along with Industrial’s sustained leadership, Technology, Consumer Cyclical, and Communication Services have garnered much attention in terms of improvement so far this year as the top four sectors in terms of signal gain. Since the beginning of the third quarter, only one sector has garnered a notable amount of signals.
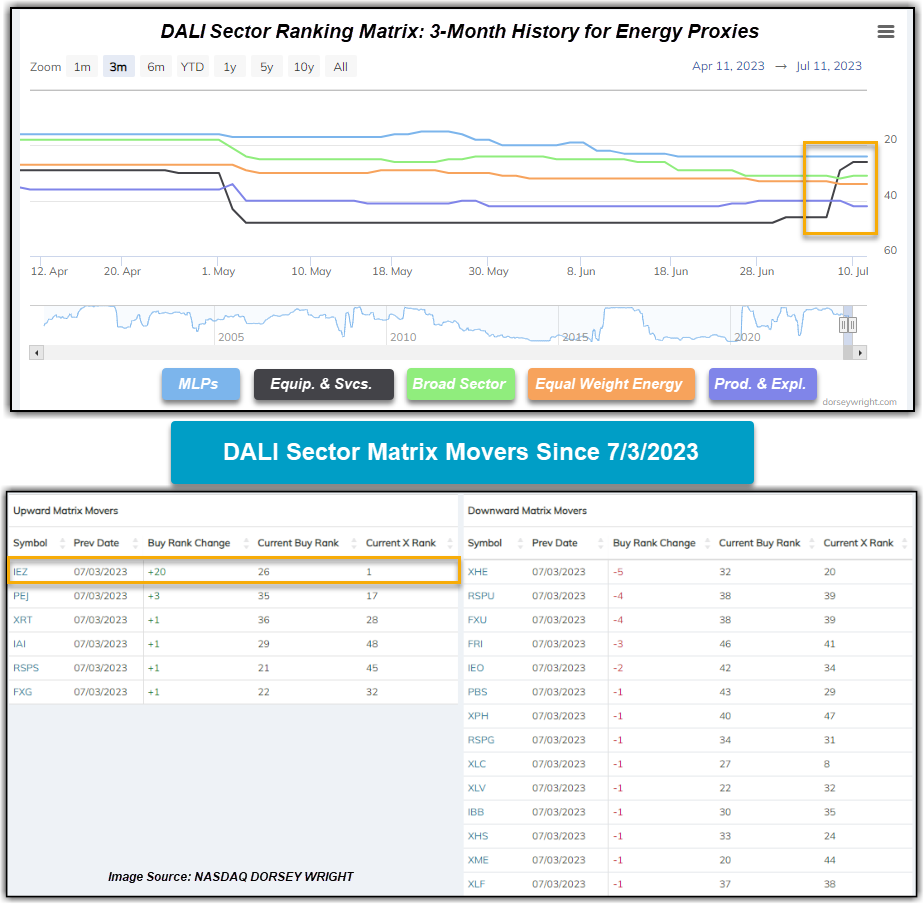
Over the last week, the Energy sector has risen from 10th to 8th in our DALI sector rankings, picking up 15 buy signals in that span. Amidst its rise, one may be interested in hopping aboard energy while it picks up steam. However, most of Energy’s recent movement has come from the Equipment and Services subsector, as opposed to the sector as a whole.

Out of the 15 buy signals energy has picked up, iShares U.S. Oil Equipment & Services ETF (IEZ) has accounted for a whopping 14 of those. This brought the fund from the bottom quintile to the upper half of the DALI sector matrix; meanwhile, the remainder of the proxies average a rank roughly in the bottom third. While most of IEZ’s new buy signals have come from weaker sectors such as Real Estate, Utilities, and Healthcare, it has also picked up a buy signal versus what has been one of the stronger subsectors in the broader market throughout 2023: Home Construction. This is significant, as it shows relative strength against more than current market laggards.
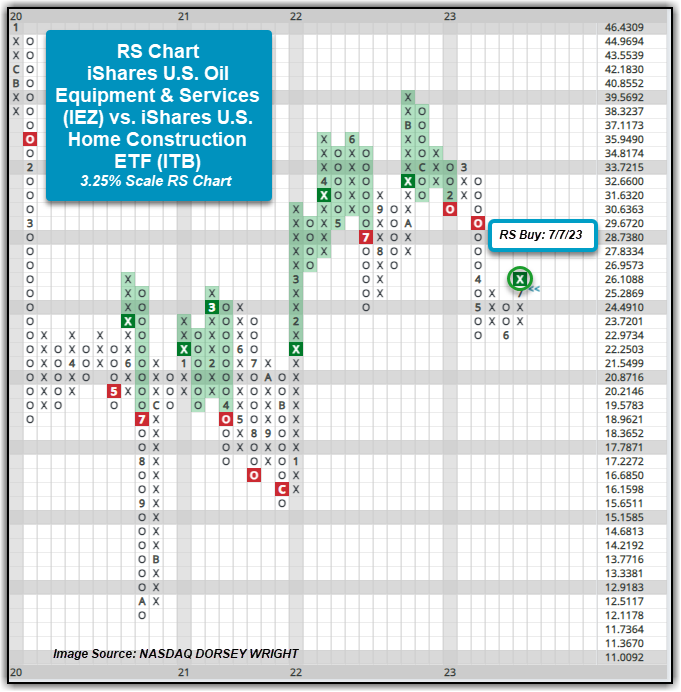
The chart below shows the RS relationship between Oil Equipment and Services versus the iShares U.S. Home Construction ETF ITB. With July’s action, IEZ has simply outpaced ITB, up 11.38% compared to down 63 basis points. Much of IEZ’s performance came after news last week that the U.S. posted higher net crude imports and gas inventories remained unchanged. The difference in performance toward the end of last week brought the RS chart into Xs and higher to complete an RS buy signal. Prior to last week’s change, IEZ had been on an RS sell versus ITB since early February and IEZ underperformed ITB during that time – down 1.20% versus up 11.92%. Bear in mind, this one RS chart is among many that evaluate an overall sector’s strength and much of the gain in strength for Energy has come from one subsector. Additionally, broader Technology and Industrials – along with a number of their subsectors – are still favored over Oil Equipment & Services in the long term. Some of the RS charts have shifted into Xs though with action over the past week and are favoring Oil Equipment & Services in the short-term, so it will be worth continuing to monitor. Further improvement is needed from the subsector for those RS relationships to flip, and upside from elsewhere in the broader Energy sector would help the case for garnering attention in client portfolios.
Given IEZ has both strong recent performance and relative strength versus a leading subsector, many clients may be asking whether now is the time to enter. IEZ does have a strong fund score of 4.46, which was boosted by a recent market RS chart reversal into Xs late last week, and has maintained a buy signal and a positive trend since early June. That said, the ETF has skyrocketed up 16.17% in the past week and now sits in heavily overbought territory with a weekly OBOS reading of over 100%. Additionally, it is nearing resistance at $23 without support until $18.50. Those seeking long-term exposure should wait for price consolidation or a pullback to $21 before entering. From here, a move to $23.50 would mark the highest chart level since early 2019.

